The VesselGlyph: Focus & Context Visualization in CT-Angiography
|
|
|
- Maud Powers
- 5 years ago
- Views:
Transcription
1 The VesselGlyph: Focus & Context Visualization in CT-Angiography Matúš Straka M. Šrámek, A. La Cruz E. Gröller, D. Fleischmann
2 Contents Motivation:» Why again a new visualization method for vessel data? Concept of the VesselGlyph Patient data examples Algorithm Conclusion 2/28
3 Vessel Visualization Basics Visualization of vessels (angiography)» Diseased vessels, e.g. PAOD» Depiction of soft plaque, calcifications, occlusions, Datasets acquired using helical CT scanner Vessels enhanced in CT-Angiography images by injection of contrast agent CT-Angiography data are huge (1200+ slices) 3/28

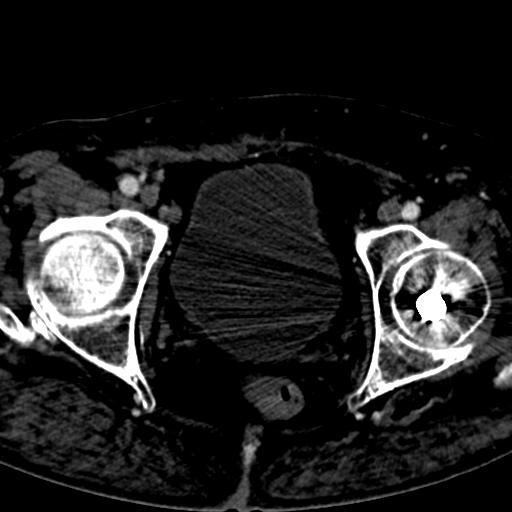
4 4/28
 Vertebra (bone) Vessels represent a small part of the dataset The rest is important as an anatomic")
5 Vessel Visualization Basics Visualization of diseased vessels (PAOD) CT-Angiography data are huge (1200+ slices) Tissue density ranges can overlap, tissues can be spatially very close» Problematic segmentation» Only centerlines of the main vessels often available Aorta (vessel) Vertebra (bone) Vessels represent a small part of the dataset The rest is important as an anatomic context 5/28
6 The AngioVis Project Interdisciplinary project aimed at visualization and assessment of vessels in 3D CT-Angiography datasets» Development of new methods and SW tools Cooperation of:» Austrian Academy of Sciences» Vienna University of Technology, Austria» General Hospital (AKH) of Vienna, Austria» Stanford Medical Centre, USA 6/28
 Curved Planar Reformation (CPR) Direct Volume Rendering")
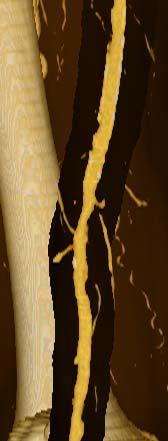
7 Vessel Visualization Basics 7/28 Maximum Intensity Projection (MIP) Curved Planar Reformation (CPR) Direct Volume Rendering (DVR)
8 Why something new? Objects in focus (vessels) need to be enhanced in the images Anatomic context is important for orientation in the images» No relevant anatomic context in CPR images» Depth perception ambiguous in MIP images» Occlusion in MIP and DVR images Anatomic context should not dominate the images Different visualization techniques and/or parameters for focus and context are needed 8/28
9 The VesselGlyph Is a concept for:» Spatially dependent definition of focus and context areas» Combination of various visualization techniques and/or parameters therein» If necessary, allows also smooth transition in between Focus and context areas are defined by:» Vessel centerlines» Voxel-to-centerline distances and viewing vector 9/28
10 The VesselGlyph Concept Soft Tissue Vessel Focus Area Bone Dataset Slice View Direction Context Area 10/28
11 VesselGlyph Construction Dataset Slice Context Focus Context Transitional Areas 11/28
12 VesselGlyph Application For tubular structures, VesselGlyph» can be used as 2D-to-3D interface» Allows easy modification of parameters (size, layout, technique, ) in 2D widget» Swept along the centerline for 3D results 12/28
13 VesselGlyph Application Vessel 13/28
14 VesselGlyph Layouts Dataset Context Focus Context Transitional Areas 14/28
15 VesselGlyph Layouts Dataset Context Focus Context Transitional Areas 15/28

16 VesselGlyph Layouts Dataset Focus Context Transitional 16/28
17 VesselGlyph Layouts Dataset Context Focus Transitional Areas 17/28
18 Focus & Context Definition r r α d f f = f ( d, v) / c or r v r View Dir f f = f ( d, α) / c 18/28


19 Tubular VesselGlyph» Normal DVR for focus» Transparent DVR for context View Dir Motivation» Concept» Examples»Algorithm»Conclusion 19/28
20 20/28


21 Thick-Slab VesselGlyph View Dir» Normal DVR for focus» Transparent DVR for context 21/28

22 CPR-in-DVR VesselGlyph focus c View Dir» CPR for focus» DVR for context Motivation» Concept» Examples»Algorithm»Conclusion 22/28


23 Foreground-Cleft» DVR for focus» DVR for context View Dir Motivation» Concept» Examples»Algorithm»Conclusion 23/28


24 Foreground Cleft with Occlusion Lines View Dir» DVR for focus» DVR for context Rear view Front view Motivation» Concept» Examples»Algorithm»Conclusion 24/28
» Based on distance» Based")
25 Algorithm Three-stage processing:» 1. Distance-to-centerline evaluation» 2. Focus and context partial rendering» 3. Compositing of partial renderings Compositing of partial renderings can be:» Implicit (F/C rendered at once)» Based on distance» Based on data density 25/28
26 Algorithm Extension of standard DVR algorithm Opacity depends also on spatial location Transparency modifier coefficient:» Influences opacity transfer function» Different for focus and context» Works for DVR+DVR layouts f f / c Special cases - DVR+CPR, DVR+MIP 26/28
27 Conclusion & Future Work VesselGlyph:» Is a generalization of various visualization techniques (DVR, CPR, MIP, )» Displays unoccluded objects in a correct anatomic context Clinical evaluation in progress Extension to arbitrary shapes using distance fields 27/28
28 Thank you for your attention 28/28
The VesselGlyph: Focus & Context Visualization in CT-Angiography
 The VesselGlyph: Focus & Context Visualization in CT-Angiography Matúš Straka Commission for Scientific Visualization, Austrian Academy of Sciences Arnold Köchl Medical University of Vienna, Austria Michal
Non-linear Model Fitting to Parameterize Diseased Blood Vessels
 Non-linear Model Fitting to Parameterize Diseased Blood Vessels Alexandra La Cruz Vienna University of Technology Miloš Šrámek Austrian Academy of Sciences Matúš Straka Austrian Academy of Sciences Eduard
FINDING THE TRUE EDGE IN CTA
 FINDING THE TRUE EDGE IN CTA by: John A. Rumberger, PhD, MD, FACC Your patient has chest pain. The Cardiac CT Angiography shows plaque in the LAD. You adjust the viewing window trying to evaluate the stenosis
Blood Vessel Visualization on CT Data
 WDS'12 Proceedings of Contributed Papers, Part I, 88 93, 2012. ISBN 978-80-7378-224-5 MATFYZPRESS Blood Vessel Visualization on CT Data J. Dupej Charles University Prague, Faculty of Mathematics and Physics,
Vessel Explorer: a tool for quantitative measurements in CT and MR angiography
 Clinical applications Vessel Explorer: a tool for quantitative measurements in CT and MR angiography J. Oliván Bescós J. Sonnemans R. Habets J. Peters H. van den Bosch T. Leiner Healthcare Informatics/Patient
Medical Image Processing: Image Reconstruction and 3D Renderings
 Medical Image Processing: Image Reconstruction and 3D Renderings 김보형 서울대학교컴퓨터공학부 Computer Graphics and Image Processing Lab. 2011. 3. 23 1 Computer Graphics & Image Processing Computer Graphics : Create,
Medical Visualization - Volume Rendering. J.-Prof. Dr. Kai Lawonn
 Medical Visualization - Volume Rendering J.-Prof. Dr. Kai Lawonn Medical Visualization Pipeline Acquisition Filtering/Enhancement Mapping Rendering Data are given Data are processed e.g., feature extraction
THE F3D TOOLS FOR PROCESSING AND VISUALIZATION OF VOLUMETRIC DATA
 3D Data Processing Volume Visualization 3D File Format Miloš ŠRÁMEK, Leonid I. DIMITROV, Matúš STRAKA and Michal ČERVEŇANSKÝ THE F3D TOOLS FOR PROCESSING AND VISUALIZATION OF VOLUMETRIC DATA In this paper
Diagnostic Relevant Visualization of Vascular Structures
 Diagnostic Relevant Visualization of Vascular Structures Armin Kanitsar 1, Dominik Fleischmann 2, Rainer Wegenkittl 3, and Meister Eduard Gröller 1 1 Institute of Computer Graphics and Algorithms, Vienna
Volume Visualization
 Volume Visualization Part 1 (out of 3) Overview: Volume Visualization Introduction to volume visualization On volume data Surface vs. volume rendering Overview: Techniques Simple methods Slicing, cuberille
Vessel Visualization using Curved Surface Reformation
 Vessel Visualization using Curved Surface Reformation Thomas Auzinger, Gabriel Mistelbauer, Ivan Baclija, Rüdiger Schernthaner, Arnold Köchl, Michael Wimmer, Meister Eduard Gröller, Member, IEEE Computer
Volume Visualization. Part 1 (out of 3) Volume Data. Where do the data come from? 3D Data Space How are volume data organized?
 Volume Data. Where do the data come from? 3D Data Space How are volume data organized?") Volume Data Volume Visualization Part 1 (out of 3) Where do the data come from? Medical Application Computed Tomographie (CT) Magnetic Resonance Imaging (MR) Materials testing Industrial-CT Simulation
Volume Data Volume Visualization Part 1 (out of 3) Where do the data come from? Medical Application Computed Tomographie (CT) Magnetic Resonance Imaging (MR) Materials testing Industrial-CT Simulation
TECHNICAL REPORT. Smart Linking of 2D and 3D Views in Medical Applications
 Institut für Computergraphik und Algorithmen Technische Universität Wien Karlsplatz 13/186/2 A-1040 Wien AUSTRIA Tel: +43 (1) 58801-18601 Fax: +43 (1) 58801-18698 Institute of Computer Graphics and Algorithms
Tomographic Reconstruction
 Tomographic Reconstruction 3D Image Processing Torsten Möller Reading Gonzales + Woods, Chapter 5.11 2 Overview Physics History Reconstruction basic idea Radon transform Fourier-Slice theorem (Parallel-beam)
[PDR03] RECOMMENDED CT-SCAN PROTOCOLS
![[PDR03] RECOMMENDED CT-SCAN PROTOCOLS](/thumbs/72/66454100.jpg "[PDR03] RECOMMENDED CT-SCAN PROTOCOLS") SURGICAL & PROSTHETIC DESIGN [PDR03] RECOMMENDED CT-SCAN PROTOCOLS WORK-INSTRUCTIONS DOCUMENT (CUSTOMER) RECOMMENDED CT-SCAN PROTOCOLS [PDR03_V1]: LIVE 1 PRESCRIBING SURGEONS Patient-specific implants,
SURGICAL & PROSTHETIC DESIGN [PDR03] RECOMMENDED CT-SCAN PROTOCOLS WORK-INSTRUCTIONS DOCUMENT (CUSTOMER) RECOMMENDED CT-SCAN PROTOCOLS [PDR03_V1]: LIVE 1 PRESCRIBING SURGEONS Patient-specific implants,
Mirrored LH Histograms for the Visualization of Material Boundaries
 Mirrored LH Histograms for the Visualization of Material Boundaries Petr Šereda 1, Anna Vilanova 1 and Frans A. Gerritsen 1,2 1 Department of Biomedical Engineering, Technische Universiteit Eindhoven,
Contrast Enhancement with Dual Energy CT for the Assessment of Atherosclerosis
 Contrast Enhancement with Dual Energy CT for the Assessment of Atherosclerosis Stefan C. Saur 1, Hatem Alkadhi 2, Luca Regazzoni 1, Simon Eugster 1, Gábor Székely 1, Philippe Cattin 1,3 1 Computer Vision
Modeling and preoperative planning for kidney surgery
 Modeling and preoperative planning for kidney surgery Refael Vivanti Computer Aided Surgery and Medical Image Processing Lab Hebrew University of Jerusalem, Israel Advisor: Prof. Leo Joskowicz Clinical
CIS 467/602-01: Data Visualization
 CIS 467/60-01: Data Visualization Isosurfacing and Volume Rendering Dr. David Koop Fields and Grids Fields: values come from a continuous domain, infinitely many values - Sampled at certain positions to
4D Magnetic Resonance Analysis. MR 4D Flow. Visualization and Quantification of Aortic Blood Flow
 4D Magnetic Resonance Analysis MR 4D Flow Visualization and Quantification of Aortic Blood Flow 4D Magnetic Resonance Analysis Complete assesment of your MR 4D Flow data Time-efficient and intuitive analysis
IMPAX Volume Viewing 3D Visualization & Segmentation
 Getting started guide IMPAX Volume Viewing 3D Visualization & Segmentation This guide outlines the basic steps to perform and manipulate a 3D reconstruction of volumetric image data using IMPAX Volume
Image Acquisition Systems
 Image Acquisition Systems Goals and Terminology Conventional Radiography Axial Tomography Computer Axial Tomography (CAT) Magnetic Resonance Imaging (MRI) PET, SPECT Ultrasound Microscopy Imaging ITCS
Volume Illumination and Segmentation
 Volume Illumination and Segmentation Computer Animation and Visualisation Lecture 13 Institute for Perception, Action & Behaviour School of Informatics Overview Volume illumination Segmentation Volume
Fast Visualization of Object Contours by Non-Photorealistic Volume Rendering
 Fast Visualization of Object Contours by Non-Photorealistic Volume Rendering Balázs Csébfalvi bfalvi,, Lukas Mroz, Helwig Hauser, Andreas König, Eduard Gröller Institute of Computer Graphics and Algorithms
Computer-Tomography I: Principles, History, Technology
 Computer-Tomography I: Principles, History, Technology Prof. Dr. U. Oelfke DKFZ Heidelberg Department of Medical Physics (E040) Im Neuenheimer Feld 280 69120 Heidelberg, Germany u.oelfke@dkfz.de History
Advanced Curved Planar Reformation: Flattening of Vascular Structures
 Advanced Curved Planar Reformation: Flattening of Vascular Structures Armin Kanitsar Rainer Wegenkittl Dominik Fleischmann Meister Eduard Gröller Institute of Computer Graphics and Algorithms Department
Data Visualization (DSC 530/CIS )
") Data Visualization (DSC 530/CIS 60-0) Isosurfaces & Volume Rendering Dr. David Koop Fields & Grids Fields: - Values come from a continuous domain, infinitely many values - Sampled at certain positions
Data Visualization (DSC 530/CIS 60-0) Isosurfaces & Volume Rendering Dr. David Koop Fields & Grids Fields: - Values come from a continuous domain, infinitely many values - Sampled at certain positions
Fundamentals of CT imaging
 SECTION 1 Fundamentals of CT imaging I History In the early 1970s Sir Godfrey Hounsfield s research produced the first clinically useful CT scans. Original scanners took approximately 6 minutes to perform
COMPREHENSIVE QUALITY CONTROL OF NMR TOMOGRAPHY USING 3D PRINTED PHANTOM
 COMPREHENSIVE QUALITY CONTROL OF NMR TOMOGRAPHY USING 3D PRINTED PHANTOM Mažena MACIUSOVIČ *, Marius BURKANAS *, Jonas VENIUS *, ** * Medical Physics Department, National Cancer Institute, Vilnius, Lithuania
Vessel Visualization using Curvicircular Feature Aggregation
 Eurographics Conference on Visualization (EuroVis) 2013 B. Preim, P. Rheingans, and H. Theisel (Guest Editors) Volume 32 (2013), Number 3 Vessel Visualization using Curvicircular Feature Aggregation G.
Bilateral Depth Filtering for Enhanced Vessel Reformation
 Eurographics Conference on Visualization (EuroVis) (04) N. Elmqvist, M. Hlawitschka, and J. Kennedy (Editors) Short Papers Bilateral Depth Filtering for Enhanced Vessel Reformation Jan Kretchmer,, Bernhard
Data Visualization (CIS/DSC 468)
") Data Visualization (CIS/DSC 46) Volume Rendering Dr. David Koop Visualizing Volume (3D) Data 2D visualization slice images (or multi-planar reformating MPR) Indirect 3D visualization isosurfaces (or surface-shaded
Data Visualization (CIS/DSC 46) Volume Rendering Dr. David Koop Visualizing Volume (3D) Data 2D visualization slice images (or multi-planar reformating MPR) Indirect 3D visualization isosurfaces (or surface-shaded
Machine Learning for Medical Image Analysis. A. Criminisi
 Machine Learning for Medical Image Analysis A. Criminisi Overview Introduction to machine learning Decision forests Applications in medical image analysis Anatomy localization in CT Scans Spine Detection
An Advanced Data Structure for Large Medical Datasets
 D I P L O M A R B E I T An Advanced Data Structure for Large Medical Datasets ausgeführt am Institut für Computergraphik und Algorithmen der Technischen Universität Wien unter Anleitung von Ao.Univ.Prof.
Centerline Reformations of Complex Vascular Structures
 Centerline Reformations of Complex Vascular Structures Gabriel Mistelbauer Andrej Varchola Hamed Bouzari Juraj Starinsky Arnold Ko chl Vienna University of Technology, Austria Vienna University of Technology,
icatvision Quick Reference
 icatvision Quick Reference Navigating the i-cat Interface This guide shows how to: View reconstructed images Use main features and tools to optimize an image. REMINDER Images are displayed as if you are
Multimodal Vessel Visualization of Mouse Aorta PET/CT Scans
 Multimodal Vessel Visualization of Mouse Aorta PET/CT Scans Timo Ropinski, Member, IEEE, Sven Hermann, Rainer Reich, Michael Schäfers, and Klaus Hinrichs, Member, IEEE Abstract In this paper, we present
Display. Introduction page 67 2D Images page 68. All Orientations page 69 Single Image page 70 3D Images page 71
 Display Introduction page 67 2D Images page 68 All Orientations page 69 Single Image page 70 3D Images page 71 Intersecting Sections page 71 Cube Sections page 72 Render page 73 1. Tissue Maps page 77
Coronary Artery Calcium Quantification in Contrast-enhanced Computed Tomography Angiography
 Georgia State University ScholarWorks @ Georgia State University Computer Science Dissertations Department of Computer Science 12-18-2013 Coronary Artery Calcium Quantification in Contrast-enhanced Computed
CT Basics Principles of Spiral CT Dose. Always Thinking Ahead.
 1 CT Basics Principles of Spiral CT Dose 2 Who invented CT? 1963 - Alan Cormack developed a mathematical method of reconstructing images from x-ray projections Sir Godfrey Hounsfield worked for the Central
Automatic Ascending Aorta Detection in CTA Datasets
 Automatic Ascending Aorta Detection in CTA Datasets Stefan C. Saur 1, Caroline Kühnel 2, Tobias Boskamp 2, Gábor Székely 1, Philippe Cattin 1,3 1 Computer Vision Laboratory, ETH Zurich, 8092 Zurich, Switzerland
Extraction and recognition of the thoracic organs based on 3D CT images and its application
 1 Extraction and recognition of the thoracic organs based on 3D CT images and its application Xiangrong Zhou, PhD a, Takeshi Hara, PhD b, Hiroshi Fujita, PhD b, Yoshihiro Ida, RT c, Kazuhiro Katada, MD
3D Surface Reconstruction of the Brain based on Level Set Method
 3D Surface Reconstruction of the Brain based on Level Set Method Shijun Tang, Bill P. Buckles, and Kamesh Namuduri Department of Computer Science & Engineering Department of Electrical Engineering University
3/27/2012 WHY SPECT / CT? SPECT / CT Basic Principles. Advantages of SPECT. Advantages of CT. Dr John C. Dickson, Principal Physicist UCLH
 3/27/212 Advantages of SPECT SPECT / CT Basic Principles Dr John C. Dickson, Principal Physicist UCLH Institute of Nuclear Medicine, University College London Hospitals and University College London john.dickson@uclh.nhs.uk
Computer-Tomography II: Image reconstruction and applications
 Computer-Tomography II: Image reconstruction and applications Prof. Dr. U. Oelfke DKFZ Heidelberg Department of Medical Physics (E040) Im Neuenheimer Feld 280 69120 Heidelberg, Germany u.oelfke@dkfz.de
Fast Segmentation of Kidneys in CT Images
 WDS'10 Proceedings of Contributed Papers, Part I, 70 75, 2010. ISBN 978-80-7378-139-2 MATFYZPRESS Fast Segmentation of Kidneys in CT Images J. Kolomazník Charles University, Faculty of Mathematics and
AORTA CTA VPMC-12419
 AORTA CTA VPMC-12419 Workflow Overview: The Aorta can be post-processed in various ways. Auto Bone Removal and Vessel Pick provide a quick overview of the entire Aorta. Vessel Probe creates a centerline
Shadow casting. What is the problem? Cone Beam Computed Tomography THE OBJECTIVES OF DIAGNOSTIC IMAGING IDEAL DIAGNOSTIC IMAGING STUDY LIMITATIONS
 Cone Beam Computed Tomography THE OBJECTIVES OF DIAGNOSTIC IMAGING Reveal pathology Reveal the anatomic truth Steven R. Singer, DDS srs2@columbia.edu IDEAL DIAGNOSTIC IMAGING STUDY Provides desired diagnostic
Contours & Implicit Modelling 4
 Brief Recap Contouring & Implicit Modelling Contouring Implicit Functions Visualisation Lecture 8 lecture 6 Marching Cubes lecture 3 visualisation of a Quadric toby.breckon@ed.ac.uk Computer Vision Lab.
Arbitrary cut planes Slab control with slab thickness Projection plane adjustment Box cropping Mandible detection MPR cross-section linked views
 Provides unparalleled quality and performance no need to sacrifice one for the other Enables high fidelity viewing with interactive deep supersampling Requires no GPUs or hardware accelerators a true,
Computational Medical Imaging Analysis Chapter 4: Image Visualization
 Computational Medical Imaging Analysis Chapter 4: Image Visualization Jun Zhang Laboratory for Computational Medical Imaging & Data Analysis Department of Computer Science University of Kentucky Lexington,
Interactive Boundary Detection for Automatic Definition of 2D Opacity Transfer Function
 Interactive Boundary Detection for Automatic Definition of 2D Opacity Transfer Function Martin Rauberger, Heinrich Martin Overhoff Medical Engineering Laboratory, University of Applied Sciences Gelsenkirchen,
Vessel Tracking in Peripheral CTA Datasets An Overview
 Vessel Tracking in Peripheral CTA Datasets An Overview Petr Felkel, Rainer Wegenkittl VRVis Center, Austria, www.vrvis.at Donau-City-Straße 1, A-1220 Vienna petr.felkel rainer.wegenkittl@vrvis.at Armin
CTA HEAD Perfusion AqONE without and with IV Contrast
 CTA HEAD Perfusion AqONE without and with IV Contrast Patient Position Adult Contrast Adult Injection Rate Supine IOML perpendicular to table top. IV: 100 ml with helical head CTA 50 ml without helical
Enhanced material contrast by dual-energy microct imaging
 Enhanced material contrast by dual-energy microct imaging Method note Page 1 of 12 2 Method note: Dual-energy microct analysis 1. Introduction 1.1. The basis for dual energy imaging Micro-computed tomography
Image Post-Processing, Workflow, & Interpretation
 Image Post-Processing, Workflow, & Interpretation Richard L. Hallett, MD Chief, Cardiovascular Imaging Northwest Radiology Network Indianapolis, IN Adjunct Assistant Professor Stanford University Stanford,
Direct Volume Rendering. Overview
 Direct Volume Rendering Department of Computer Science University of New Hampshire Durham, NH 03824 Based on: Brodlie and Wood, Recent Advances in Visualization of Volumetric Data, Eurographics 2000 State
Overview. Direct Volume Rendering. Volume Rendering Integral. Volume Rendering Integral Approximation
 Overview Direct Volume Rendering Department of Computer Science University of New Hampshire Durham, NH 03824 Based on: Brodlie and Wood, Recent Advances in Visualization of Volumetric Data, Eurographics
A Workflow for Improving Medical Visualization of Semantically Annotated CT-Images
 A Workflow for Improving Medical Visualization of Semantically Annotated CT-Images Alexander Baranya 1,2, Luis Landaeta 1,2, Alexandra La Cruz 1, and Maria-Esther Vidal 2 1 Biophysic and Bioengeneering
Smart Super Views A Knowledge-Assisted Interface for Medical Visualization
 Smart Super Views A Knowledge-Assisted Interface for Medical Visualization Gabriel Mistelbauer Hamed Bouzari Rudiger Schernthaner Ivan Baclija Vienna University of Technology, Austria Austrian Academy
SIGMI Meeting ~Image Fusion~ Computer Graphics and Visualization Lab Image System Lab
 SIGMI Meeting ~Image Fusion~ Computer Graphics and Visualization Lab Image System Lab Introduction Medical Imaging and Application CGV 3D Organ Modeling Model-based Simulation Model-based Quantification
US 1.
 US 1 Sample image: Normal pancreas seen on sonogram. Looking up from abdomen toward the head of the patient. The liver is in front of the pancreas. A vein draining the spleen is behind the pancreas http://www.radiologyinfo.org/photocat/photos.cfm?image=abdo-us-pancr.jpg&&subcategory=abdomen&&stop=9
Data Visualization (DSC 530/CIS )
") Data Visualization (DSC 530/CIS 60-01) Scalar Visualization Dr. David Koop Online JavaScript Resources http://learnjsdata.com/ Good coverage of data wrangling using JavaScript Fields in Visualization Scalar
Data Visualization (DSC 530/CIS 60-01) Scalar Visualization Dr. David Koop Online JavaScript Resources http://learnjsdata.com/ Good coverage of data wrangling using JavaScript Fields in Visualization Scalar
8. Tensor Field Visualization
 8. Tensor Field Visualization Tensor: extension of concept of scalar and vector Tensor data for a tensor of level k is given by t i1,i2,,ik (x 1,,x n ) Second-order tensor often represented by matrix Examples:
VieW 3D. 3D Post-Processing WorKstation THE THIRD DIMENSION. Version 3.1
 VieW 3D 3D Post-Processing WorKstation THE THIRD DIMENSION Version 3.1 iq-view 3D THE FULLY-FEATURED 3D MEDICAL IMAGING SOLUTION FOR RADIOLOGISTS iq-view 3D contains all components of iq-view with the
8/3/2017. Contour Assessment for Quality Assurance and Data Mining. Objective. Outline. Tom Purdie, PhD, MCCPM
 Contour Assessment for Quality Assurance and Data Mining Tom Purdie, PhD, MCCPM Objective Understand the state-of-the-art in contour assessment for quality assurance including data mining-based techniques
Visually Supporting Depth Perception in Angiography Imaging
 Visually Supporting Depth Perception in Angiography Imaging Timo Ropinski, Frank Steinicke, and Klaus Hinrichs Department of Computer Science, University of Münster, Germany {ropinski, fsteini, khh}@math.uni-muenster.de
Human Heart Coronary Arteries Segmentation
 Human Heart Coronary Arteries Segmentation Qian Huang Wright State University, Computer Science Department Abstract The volume information extracted from computed tomography angiogram (CTA) datasets makes
Operator s manual. Operator s Manual WhiteFox Imaging V0C (15) 10/2017 NCBCEN020C
 10/2017 NCBCEN020C") Operator s manual Operator s Manual WhiteFox Imaging V0C (15) 10/2017 NCBCEN020C MANUFACTURER de Götzen S.r.l. - a company of ACTEON Group Via Roma, 45 21057 OLGIATE OLONA (VA) ITALY Tel. +39 0331 376760
Operator s manual Operator s Manual WhiteFox Imaging V0C (15) 10/2017 NCBCEN020C MANUFACTURER de Götzen S.r.l. - a company of ACTEON Group Via Roma, 45 21057 OLGIATE OLONA (VA) ITALY Tel. +39 0331 376760
Ch. 4 Physical Principles of CT
 Ch. 4 Physical Principles of CT CLRS 408: Intro to CT Department of Radiation Sciences Review: Why CT? Solution for radiography/tomography limitations Superimposition of structures Distinguishing between
Management and Visualization of images with labeled segments:
 Management and Visualization of images with labeled segments: Chest CT Atlas Management Anthony P. Reeves and Jaesung Lee Introduction to label map management. Currently the main label map is defined for
Previously... contour or image rendering in 2D
 Volume Rendering Visualisation Lecture 10 Taku Komura Institute for Perception, Action & Behaviour School of Informatics Volume Rendering 1 Previously... contour or image rendering in 2D 2D Contour line
Volume Rendering. Computer Animation and Visualisation Lecture 9. Taku Komura. Institute for Perception, Action & Behaviour School of Informatics
 Volume Rendering Computer Animation and Visualisation Lecture 9 Taku Komura Institute for Perception, Action & Behaviour School of Informatics Volume Rendering 1 Volume Data Usually, a data uniformly distributed
Conveying 3D Shape and Depth with Textured and Transparent Surfaces Victoria Interrante
 Conveying 3D Shape and Depth with Textured and Transparent Surfaces Victoria Interrante In scientific visualization, there are many applications in which researchers need to achieve an integrated understanding
How to Adjust the 16-Bit CLUT (Color Look Up Table) Editor in OsiriX
 Editor in OsiriX") How to Adjust the 16-Bit CLUT (Color Look Up Table) Editor in OsiriX 1. Import the series you are interested in into the 2D/3D Viewer. I m using the OBELIX data set, slices 1-395, available for download
How to Adjust the 16-Bit CLUT (Color Look Up Table) Editor in OsiriX 1. Import the series you are interested in into the 2D/3D Viewer. I m using the OBELIX data set, slices 1-395, available for download
Multi-slice CT Image Reconstruction Jiang Hsieh, Ph.D.
 Multi-slice CT Image Reconstruction Jiang Hsieh, Ph.D. Applied Science Laboratory, GE Healthcare Technologies 1 Image Generation Reconstruction of images from projections. textbook reconstruction advanced
Automated segmentation methods for liver analysis in oncology applications
 University of Szeged Department of Image Processing and Computer Graphics Automated segmentation methods for liver analysis in oncology applications Ph. D. Thesis László Ruskó Thesis Advisor Dr. Antal
GPU-Accelerated Deep Shadow Maps
 GPU-Accelerated Deep Shadow Maps for Direct Volume Rendering Markus Hadwiger, Andrea Kratz, Christian Sigg*, Katja Bühler VRVis Research Center, Vienna *ETH Zurich Andrea Kratz Motivation High-quality
Advanced MRI Techniques (and Applications)
") Advanced MRI Techniques (and Applications) Jeffry R. Alger, PhD Department of Neurology Ahmanson-Lovelace Brain Mapping Center Brain Research Institute Jonsson Comprehensive Cancer Center University of
Advanced MRI Techniques (and Applications) Jeffry R. Alger, PhD Department of Neurology Ahmanson-Lovelace Brain Mapping Center Brain Research Institute Jonsson Comprehensive Cancer Center University of
RADIOMICS: potential role in the clinics and challenges
 27 giugno 2018 Dipartimento di Fisica Università degli Studi di Milano RADIOMICS: potential role in the clinics and challenges Dr. Francesca Botta Medical Physicist Istituto Europeo di Oncologia (Milano)
Hardware Acceleration for Vessel Visualization Tasks
 Hardware Acceleration for Vessel Visualization Tasks 1 Research Context Research projects on vessel visualization with Vis-Group of the Otto von Guericke University of Magdeburg Automatic Transfer Functions
Automatic Transfer Function Specification for Visual Emphasis of Coronary Artery Plaque
 Glaßer & Oeltze & Hennemuth & Kubisch & Mahnken & Wilhelmsen & Preim / Automatic TF Specification for Visual Emphasis of Coronary Plaque1 Automatic Transfer Function Specification for Visual Emphasis of
Construction of Voxel-type Phantom Based on Computed Tomographic Data of RANDO Phantom for the Monte Carlo Simulations
 Construction of Voxel-type Phantom Based on Computed Tomographic Data of RANDO Phantom for the Monte Carlo Simulations K. Minami 1, K. Ejiri 1, M. Shimo 1, M. Kato, Y. Takeuchi, K. Yonemochi, H. Toyama
High dynamic range magnetic resonance flow imaging in the abdomen
 High dynamic range magnetic resonance flow imaging in the abdomen Christopher M. Sandino EE 367 Project Proposal 1 Motivation Time-resolved, volumetric phase-contrast magnetic resonance imaging (also known
Optimisation of Toshiba Aquilion ONE Volume Imaging
 Optimisation of Toshiba Aquilion ONE Volume Imaging Jane Edwards, RPRSG Royal Free London NHS Foundation Trust Dr Mufudzi Maviki, Plymouth Hospitals NHS Trust Background In 2011/12 Radiology at RFH was
Scalar Data. CMPT 467/767 Visualization Torsten Möller. Weiskopf/Machiraju/Möller
 Scalar Data CMPT 467/767 Visualization Torsten Möller Weiskopf/Machiraju/Möller Overview Basic strategies Function plots and height fields Isolines Color coding Volume visualization (overview) Classification
Automatic Segmentation of the Aortic Dissection Membrane from 3D CTA Images
 Automatic Segmentation of the Aortic Dissection Membrane from 3D CTA Images Tamás Kovács 1, Philippe Cattin 1, Hatem Alkadhi 2, Simon Wildermuth 3, and Gábor Székely 1 1 Computer Vision Group, ETH Zurich,
Motion artifact detection in four-dimensional computed tomography images
 Motion artifact detection in four-dimensional computed tomography images G Bouilhol 1,, M Ayadi, R Pinho, S Rit 1, and D Sarrut 1, 1 University of Lyon, CREATIS; CNRS UMR 5; Inserm U144; INSA-Lyon; University
Scalar Data. Visualization Torsten Möller. Weiskopf/Machiraju/Möller
 Scalar Data Visualization Torsten Möller Weiskopf/Machiraju/Möller Overview Basic strategies Function plots and height fields Isolines Color coding Volume visualization (overview) Classification Segmentation
Functional Analysis of the Vertebral Column Based on MR and Direct Volume Rendering
 Functional Analysis of the Vertebral Column Based on MR and Direct Volume Rendering P. Hastreiter 1, C. Rezk-Salama 2,K.Eberhardt 3 and B. Tomandl 3,andT.Ertl 4 1 Neurocenter, University of Erlangen-Nuremberg,
cs6630 November TRANSFER FUNCTIONS Alex Bigelow University of Utah
 cs6630 November 14 2014 TRANSFER FUNCTIONS Alex Bigelow University of Utah 1 cs6630 November 13 2014 TRANSFER FUNCTIONS Alex Bigelow University of Utah slide acknowledgements: Miriah Meyer, University
ThE ultimate, INTuITIVE Mr INTErFAcE
 ThE ultimate, INTuITIVE Mr INTErFAcE Empowering you to do more The revolutionary Toshiba M-power user interface takes Mr performance and flexibility to levels higher than ever before. M-power is able to
Using Pinnacle 16 Deformable Image registration in a re-treat scenario
 Introduction Using Pinnacle 16 Deformable Image registration in a re-treat scenario This short Hands On exercise will introduce how the Deformable Image Registration (DIR) tools in Pinnacle can be used
RADIOLOGY AND DIAGNOSTIC IMAGING
 Day 2 part 2 RADIOLOGY AND DIAGNOSTIC IMAGING Dr hab. Zbigniew Serafin, MD, PhD serafin@cm.umk.pl 2 3 4 5 CT technique CT technique 6 CT system Kanal K: RSNA/AAPM web module: CT Systems & CT Image Quality
Medical Image Analysis
 Computer assisted Image Analysis VT04 29 april 2004 Medical Image Analysis Lecture 10 (part 1) Xavier Tizon Medical Image Processing Medical imaging modalities XRay,, CT Ultrasound MRI PET, SPECT Generic
Vessel Tracking in Peripheral CTA Datasets an overview
 Vessel Tracking in Peripheral CTA Datasets an overview Petr Felkel and Rainer Wegenkittl Λ VRVis Center, Austria, felkel@vrvis.at Abstract The paper describes the results of the literature review focused
Phantom-based evaluation of a semi-automatic segmentation algorithm for cerebral vascular structures in 3D ultrasound angiography (3D USA)
") Phantom-based evaluation of a semi-automatic segmentation algorithm for cerebral vascular structures in 3D ultrasound angiography (3D USA) C. Chalopin¹, K. Krissian², A. Müns 3, F. Arlt 3, J. Meixensberger³,
Phantom-based evaluation of a semi-automatic segmentation algorithm for cerebral vascular structures in 3D ultrasound angiography (3D USA) C. Chalopin¹, K. Krissian², A. Müns 3, F. Arlt 3, J. Meixensberger³,
3D Object Representation. Michael Kazhdan ( /657)
") 3D Object Representation Michael Kazhdan (601.457/657) 3D Objects How can this object be represented in a computer? 3D Objects This one? H&B Figure 10.46 3D Objects This one? H&B Figure 9.9 3D Objects
3D Object Representation Michael Kazhdan (601.457/657) 3D Objects How can this object be represented in a computer? 3D Objects This one? H&B Figure 10.46 3D Objects This one? H&B Figure 9.9 3D Objects
Presentation and analysis of multidimensional data sets
 Presentation and analysis of multidimensional data sets Overview 1. 3D data visualisation Multidimensional images Data pre-processing Visualisation methods Multidimensional images wavelength time 3D image
Fast Visualization of Object Contours by Non-Photorealistic Volume Rendering
 EUROGRAPHICS 200 / A. Chalmers and T.-M. Rhyne (Guest Editors) Volume 20 (200), Number 3 Fast Visualization of Object Contours by Non-Photorealistic Volume Rendering Balázs Csébfalvi, Vienna University