Analytical reasoning task reveals limits of social learning in networks
|
|
|
- Arnold Andrews
- 5 years ago
- Views:
Transcription

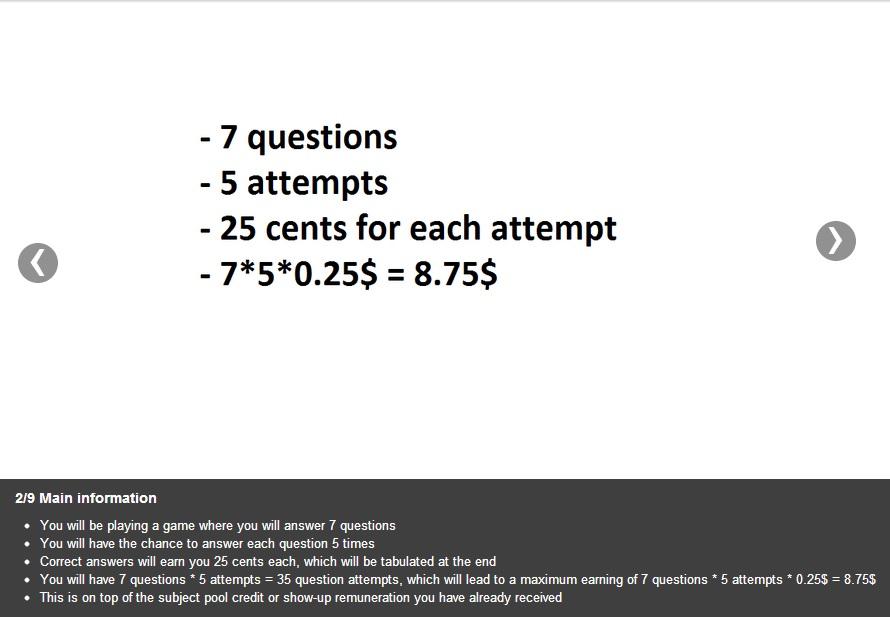
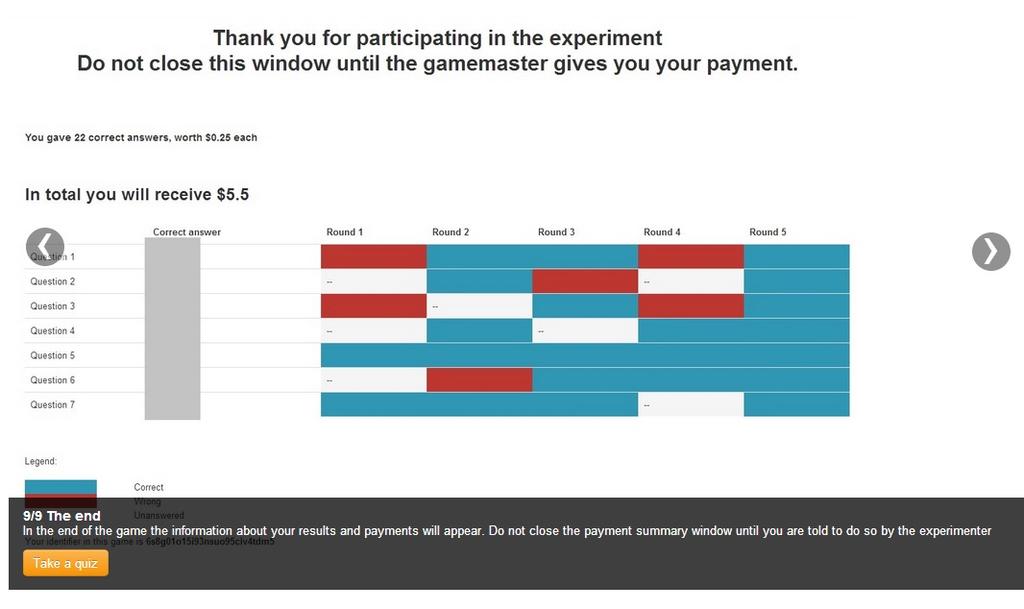
1 Electronic Supplementary Material for: Analytical reasoning task reveals limits of social learning in networks Iyad Rahwan, Dmytro Krasnoshtan, Azim Shariff, Jean-François Bonnefon A Experimental Interface A.1 Tutorial Screenshots 1
2 2
3 3
4 4
5 5
6 A.2 Quiz Questions Following is the set of quiz questions that participants have to correctly answer before they can proceed to the experiment. The correct answers are highlighted in bold. How many times will you see each question? 1. Only once 2. 5 times Does your reward depends on the responses of other players? 1. Yes 2. No How do you make money in this game? 1. Every correct response gets me money 2. Not every correct response gets me money, only the last trial counts for each question 3. Not every correct response gets me money, multiple correct responses to the same question only count as one 6
7 B Questions Below is the list of all questions. The first three questions corresponded to the Cognitive Reflection Test (CRT). These three questions generate an incorrect intuitive answer, which must be inhibited in order to produce the correct analytic answer [1]. 1. [CRT1] In a lake, there is a patch of lily pads. Every day, the patch doubles in size. If it takes 48 days for the patch to cover the entire lake, how long would it take for the patch to cover half of the lake? (Answer: 47) 2. [CRT2] If it takes 5 machines 5 minutes to make 5 widgets, how long would it take 100 machines to make 100 widgets? Write the answer in minutes. (Answer: 5) 3. [CRT3] A bat and a ball cost $1.10 in total. The bat costs $1.00 more than the ball. How much does the ball cost? (Answer: 0.05) After the three CRT questions, subjects moved on to another series of four questions from the Berlin Numeracy Test (BNT), which we do not discuss in this article [2]. Being either too easy or too hard, these questions produced little variance between participants in our networks, and thus did not allow us to test our hypotheses (see Figure 1 below for a visualization of the responses in the BNT questions). As these question came after participants had completed the three CRT questions, there is no concern that they could have contaminated the CRT data that we analyze in this article. 1. [BNT1] Imagine we are throwing a five-sided die 50 times. On average, out of these 50 throws how many times would this five-sided die show an odd number (1, 3 or 5)? out of 50 throws. (Answer: 30) 2. [BNT2] Out of 1,000 people in a small town 500 are members of a choir. Out of these 500 members in the choir 100 are men. Out of the 500 inhabitants that are not in the choir 300 are men. What is the probability that a randomly drawn man (not a person) is a member of the choir? (please indicate the probability in percents) (Answer: 25) 3. [BNT3] Imagine we are throwing a loaded die (6 sides). The probability that the die shows a 6 is twice as high as the probability of each of the other numbers. On average, out of these 70 throws, how many times would the die show the number 6? out of 70 throws. (Answer: 20) 4. [BNT4] In a forest 20% of mushrooms are red, 50% brown and 30% white. A red mushroom is poisonous with a probability of 20%. A mushroom that is not red is poisonous with a probability of 5%. What is the probability that a poisonous mushroom in the forest is red? (Answer: 50) 7
8 TOPOLOGY Full Erdos Renyi Barabasi Albert Clustered Baseline Proportion of correct responses First Question Second Question Third Question Fourth Qestion Trial Figure 1: BNT questions are either too easy or too hard, reducing variance observed in CRT questions. 8
9 C Network Structures & Their Properties C.1 The Networks A network (or graph) consists of a set V vertices (a.k.a. nodes, individuals), and a set E of edges (a.k.a. connections or links) between them. Elements of E can be denoted by a pair E ij = (i, j) where i, j V. Each of our experimental sessions ran on one of the four graphs: (1) Barabasi-Albert model; (2) Clustering graph; (3) Erdos-Renyi model; (4) Full graph. The different graph structures are visually depicted below. These graphs were chosen due to significant discrepancy in their measures on the macro (network) and micro (node) level, as shown below. Barabasi Albert model Clustering graph Full graph Erdos Renyi model Figure 2: List of graphs 9
10 C.2 Micro Measures And on the micro level (for each node): Degree: The degree k i of a vertex i is simply the number of edges incident to this vertex. In a directed graph, we can distinguish between the out-degree (outgoing edges) and in-degree (incoming edges). In the present paper, edges are considered undirected. The different graph structures we used have significantly varying distributions of node degrees, as shown below. The degree distribution of the Erdo-Renyi graph follows a Poission distribution, thus most nodes have a more or less equal number of neighbors (no one is disproportionately popular). In contrasted, in the Barabasi-Albert graph, the distribution is long-tailed, with a few very highly connected nodes. In the full graph, everyone has equal degree, since everyone is connected to everyone else. Finally, in the clustering graph, degrees are more or less identical. However, as we will see below, some nodes are a more privilaged position in the middle of the graph. 20 Barabasi model 20 Erdos Renyi model Full graph 20 Clustering graph Figure 3: Degree distribution Local clustering coefficient: The local clustering coefficient captures the following intuition: out of all pairs of friends that i is connected to, how many of those friends are also friends with one another. In other words: C i = number of triangles connected to node i number of triples centered around node i where a triple centred around node i is a set of two edges connected to node i (if the degree of node i is 0 or 1, we which gives us C i = 0/0, we can set C i = 0). High local clustering coefficient for node i indicates that i belongs to a tightly knit group. More formally, the local clustering coefficient c i is defined as follows: C i = {E jk} k i (k i 1) : v j, v k N i, E jk E where k i is the out-degree of vertex i, and N i = {v j : E ij E} is the set of out-neighbours of vertex i. For 10
11 undirected graphs the value of C i is normalized as C i = 2C i. If to rephrase this in the simple words, the local clustering coefficient of a vertex in a graph shows how close its neighbors are to being a full graph. The figure below highlights how the distribution of local clustering coefficients varies significantly across the different network structures. In particular, nodes in the Erdos-Renyi and Barabasi-Albert graphs have much lower clustering compared to the Clustering graph. Note that in the full graph, every node has a local clustering coefficient of 1, since everyone is connected to everyone else. Betweenness centrality: The betweenness centrality of a node is equal to the number of shortest paths (among all other vertices) that pass through that node. The higher the number, the more important is the node, in the sense that there is a small number of hops between that node and the majority of the network. Mathematically it can be defined as g(v) = s v t σ st (v) σ st where σ st is the total number of shortest paths from node s to node t and σ st (v) is the number of those paths that pass through v. The figure below shows that the betweenness centrality of nodes in the Clustering graph vary significantly (contrast this with the fact that the node degrees in this graph are almost identical to one another). 1 Clustering coefficient Barabasi model Erdos Renyi model Full graph Clustering graph Betweenness centrality Barabasi model Erdos Renyi model Full graph Clustering graph Figure 4: Clustering coefficient, betweenness centrality C.3 Macro Measures Graph density: In graph theory, graph density is defined as V ( V 1). Density represents the ratio of the number of edges to the maximum number of possible edges. Density will therefore have a value in the interval [0, 1]. Clustering coefficient of a graph: The clustering coefficient of an undirected graph is a measure of the number of triangles in a graph. The clustering coefficient for the whole graph is the average of the local clustering coefficients C i : C = 1 n C i n 11 i=1 2 E
12 where n is the number of nodes in the network. By definition 0 C i 1 and 0 C 1. Diameter: Diameter of the graph is the lenght of the longest shortest path between any two vertices of the graph. Macro level parameters for the four classes of networks are summarized in the table below. Note how the density and diameter of all graphs is almost identical, with the exception of the full graph, which has maximum density. graph type Density Clustering Diameter Number of edges Barabassi Erdos-Renyi Full graph Clustering graph
13 D Evolution of Network States The figures below show samples of the detailed evolution of correct (blue) and incorrect answers (red) in a selection of network/question combinations. Figure 5: Evolution of the game (Barabasi-Albert, question 1) 13
14 Figure 6: Evolution of the game (Barabasi-Albert, question 3) 14
15 Figure 7: Evolution of the game (Full, question 1) 15
 16")
16 Figure 8: Evolution of the game (Full, question 2) 16
17 Figure 9: Evolution of the game (Erdos-Renyi, question 1) 17
18 References [1] Frederick S. Cognitive reflection and decision making. The Journal of Economic Perspectives. 2005;19(4): [2] Cokely ET, Galesic M, Schulz E, Ghazal S, Garcia-Retamero R. Measuring risk literacy: The Berlin numeracy test. Judgment and Decision Making. 2012;7(1):
Lesson 4. Random graphs. Sergio Barbarossa. UPC - Barcelona - July 2008
 Lesson 4 Random graphs Sergio Barbarossa Graph models 1. Uncorrelated random graph (Erdős, Rényi) N nodes are connected through n edges which are chosen randomly from the possible configurations 2. Binomial
Erdős-Rényi Model for network formation
 Network Science: Erdős-Rényi Model for network formation Ozalp Babaoglu Dipartimento di Informatica Scienza e Ingegneria Università di Bologna www.cs.unibo.it/babaoglu/ Why model? Simpler representation
Networks in economics and finance. Lecture 1 - Measuring networks
 Networks in economics and finance Lecture 1 - Measuring networks What are networks and why study them? A network is a set of items (nodes) connected by edges or links. Units (nodes) Individuals Firms Banks
Introduction to network metrics
 Universitat Politècnica de Catalunya Version 0.5 Complex and Social Networks (2018-2019) Master in Innovation and Research in Informatics (MIRI) Instructors Argimiro Arratia, argimiro@cs.upc.edu, http://www.cs.upc.edu/~argimiro/
CSCI5070 Advanced Topics in Social Computing
 CSCI5070 Advanced Topics in Social Computing Irwin King The Chinese University of Hong Kong king@cse.cuhk.edu.hk!! 2012 All Rights Reserved. Outline Graphs Origins Definition Spectral Properties Type of
Basics of Network Analysis
 Basics of Network Analysis Hiroki Sayama sayama@binghamton.edu Graph = Network G(V, E): graph (network) V: vertices (nodes), E: edges (links) 1 Nodes = 1, 2, 3, 4, 5 2 3 Links = 12, 13, 15, 23,
CAIM: Cerca i Anàlisi d Informació Massiva
 1 / 72 CAIM: Cerca i Anàlisi d Informació Massiva FIB, Grau en Enginyeria Informàtica Slides by Marta Arias, José Balcázar, Ricard Gavaldá Department of Computer Science, UPC Fall 2016 http://www.cs.upc.edu/~caim
Complex-Network Modelling and Inference
 Complex-Network Modelling and Inference Lecture 8: Graph features (2) Matthew Roughan http://www.maths.adelaide.edu.au/matthew.roughan/notes/ Network_Modelling/ School
Constructing a G(N, p) Network
 Network") Random Graph Theory Dr. Natarajan Meghanathan Associate Professor Department of Computer Science Jackson State University, Jackson, MS E-mail: natarajan.meghanathan@jsums.edu Introduction At first inspection,
Random Graph Theory Dr. Natarajan Meghanathan Associate Professor Department of Computer Science Jackson State University, Jackson, MS E-mail: natarajan.meghanathan@jsums.edu Introduction At first inspection,
Constructing a G(N, p) Network
 Network") Random Graph Theory Dr. Natarajan Meghanathan Professor Department of Computer Science Jackson State University, Jackson, MS E-mail: natarajan.meghanathan@jsums.edu Introduction At first inspection, most
Random Graph Theory Dr. Natarajan Meghanathan Professor Department of Computer Science Jackson State University, Jackson, MS E-mail: natarajan.meghanathan@jsums.edu Introduction At first inspection, most
ECE 158A - Data Networks
 ECE 158A - Data Networks Homework 2 - due Tuesday Nov 5 in class Problem 1 - Clustering coefficient and diameter In this problem, we will compute the diameter and the clustering coefficient of a set of
Paths, Circuits, and Connected Graphs
 Paths, Circuits, and Connected Graphs Paths and Circuits Definition: Let G = (V, E) be an undirected graph, vertices u, v V A path of length n from u to v is a sequence of edges e i = {u i 1, u i} E for
Social Network Analysis
 Social Network Analysis Mathematics of Networks Manar Mohaisen Department of EEC Engineering Adjacency matrix Network types Edge list Adjacency list Graph representation 2 Adjacency matrix Adjacency matrix
M.E.J. Newman: Models of the Small World
 A Review Adaptive Informatics Research Centre Helsinki University of Technology November 7, 2007 Vocabulary N number of nodes of the graph l average distance between nodes D diameter of the graph d is
On Reshaping of Clustering Coefficients in Degreebased Topology Generators
 On Reshaping of Clustering Coefficients in Degreebased Topology Generators Xiafeng Li, Derek Leonard, and Dmitri Loguinov Texas A&M University Presented by Derek Leonard Agenda Motivation Statement of
1 Homophily and assortative mixing
 1 Homophily and assortative mixing Networks, and particularly social networks, often exhibit a property called homophily or assortative mixing, which simply means that the attributes of vertices correlate
Volume 2, Issue 11, November 2014 International Journal of Advance Research in Computer Science and Management Studies
 Volume 2, Issue 11, November 2014 International Journal of Advance Research in Computer Science and Management Studies Research Article / Survey Paper / Case Study Available online at: www.ijarcsms.com
Some Graph Theory for Network Analysis. CS 249B: Science of Networks Week 01: Thursday, 01/31/08 Daniel Bilar Wellesley College Spring 2008
 Some Graph Theory for Network Analysis CS 9B: Science of Networks Week 0: Thursday, 0//08 Daniel Bilar Wellesley College Spring 008 Goals this lecture Introduce you to some jargon what we call things in
Properties of Biological Networks
 Properties of Biological Networks presented by: Ola Hamud June 12, 2013 Supervisor: Prof. Ron Pinter Based on: NETWORK BIOLOGY: UNDERSTANDING THE CELL S FUNCTIONAL ORGANIZATION By Albert-László Barabási
Overlay (and P2P) Networks
 Networks") Overlay (and P2P) Networks Part II Recap (Small World, Erdös Rényi model, Duncan Watts Model) Graph Properties Scale Free Networks Preferential Attachment Evolving Copying Navigation in Small World Samu
Overlay (and P2P) Networks Part II Recap (Small World, Erdös Rényi model, Duncan Watts Model) Graph Properties Scale Free Networks Preferential Attachment Evolving Copying Navigation in Small World Samu
Social Networks. Slides by : I. Koutsopoulos (AUEB), Source:L. Adamic, SN Analysis, Coursera course
, Source:L. Adamic, SN Analysis, Coursera course") Social Networks Slides by : I. Koutsopoulos (AUEB), Source:L. Adamic, SN Analysis, Coursera course Introduction Political blogs Organizations Facebook networks Ingredient networks SN representation Networks
Social Networks Slides by : I. Koutsopoulos (AUEB), Source:L. Adamic, SN Analysis, Coursera course Introduction Political blogs Organizations Facebook networks Ingredient networks SN representation Networks
Homework 1 Networked Life (NETS 112) Fall 2016 Prof Michael Kearns
 Fall 2016 Prof Michael Kearns") Homework 1 Networked Life (NETS 112) Fall 2016 Prof Michael Kearns Posted September 20, 2016. Due in hard-copy format at the start of lecture on Thursday, September 29. Please don t forget to write your
Homework 1 Networked Life (NETS 112) Fall 2016 Prof Michael Kearns Posted September 20, 2016. Due in hard-copy format at the start of lecture on Thursday, September 29. Please don t forget to write your
Algorithmic and Economic Aspects of Networks. Nicole Immorlica
 Algorithmic and Economic Aspects of Networks Nicole Immorlica Syllabus 1. Jan. 8 th (today): Graph theory, network structure 2. Jan. 15 th : Random graphs, probabilistic network formation 3. Jan. 20 th
(Social) Networks Analysis III. Prof. Dr. Daning Hu Department of Informatics University of Zurich
 Networks Analysis III. Prof. Dr. Daning Hu Department of Informatics University of Zurich") (Social) Networks Analysis III Prof. Dr. Daning Hu Department of Informatics University of Zurich Outline Network Topological Analysis Network Models Random Networks Small-World Networks Scale-Free Networks
(Social) Networks Analysis III Prof. Dr. Daning Hu Department of Informatics University of Zurich Outline Network Topological Analysis Network Models Random Networks Small-World Networks Scale-Free Networks
Supplementary text S6 Comparison studies on simulated data
 Supplementary text S Comparison studies on simulated data Peter Langfelder, Rui Luo, Michael C. Oldham, and Steve Horvath Corresponding author: shorvath@mednet.ucla.edu Overview In this document we illustrate
A Generating Function Approach to Analyze Random Graphs
 A Generating Function Approach to Analyze Random Graphs Presented by - Vilas Veeraraghavan Advisor - Dr. Steven Weber Department of Electrical and Computer Engineering Drexel University April 8, 2005 Presentation
Heuristics for the Critical Node Detection Problem in Large Complex Networks
 Heuristics for the Critical Node Detection Problem in Large Complex Networks Mahmood Edalatmanesh Department of Computer Science Submitted in partial fulfilment of the requirements for the degree of Master
The Network Analysis Five-Number Summary
 Chapter 2 The Network Analysis Five-Number Summary There is nothing like looking, if you want to find something. You certainly usually find something, if you look, but it is not always quite the something
Epidemic spreading on networks
 Epidemic spreading on networks Due date: Sunday October 25th, 2015, at 23:59. Always show all the steps which you made to arrive at your solution. Make sure you answer all parts of each question. Always
Graph Theory for Network Science
 Graph Theory for Network Science Dr. Natarajan Meghanathan Professor Department of Computer Science Jackson State University, Jackson, MS E-mail: natarajan.meghanathan@jsums.edu Networks or Graphs We typically
Graph Theory. Graph Theory. COURSE: Introduction to Biological Networks. Euler s Solution LECTURE 1: INTRODUCTION TO NETWORKS.
 Graph Theory COURSE: Introduction to Biological Networks LECTURE 1: INTRODUCTION TO NETWORKS Arun Krishnan Koenigsberg, Russia Is it possible to walk with a route that crosses each bridge exactly once,
Centralities (4) By: Ralucca Gera, NPS. Excellence Through Knowledge
 By: Ralucca Gera, NPS. Excellence Through Knowledge") Centralities (4) By: Ralucca Gera, NPS Excellence Through Knowledge Some slide from last week that we didn t talk about in class: 2 PageRank algorithm Eigenvector centrality: i s Rank score is the sum
Centralities (4) By: Ralucca Gera, NPS Excellence Through Knowledge Some slide from last week that we didn t talk about in class: 2 PageRank algorithm Eigenvector centrality: i s Rank score is the sum
Non Overlapping Communities
 Non Overlapping Communities Davide Mottin, Konstantina Lazaridou HassoPlattner Institute Graph Mining course Winter Semester 2016 Acknowledgements Most of this lecture is taken from: http://web.stanford.edu/class/cs224w/slides
Models of Network Formation. Networked Life NETS 112 Fall 2017 Prof. Michael Kearns
 Models of Network Formation Networked Life NETS 112 Fall 2017 Prof. Michael Kearns Roadmap Recently: typical large-scale social and other networks exhibit: giant component with small diameter sparsity
Topology Enhancement in Wireless Multihop Networks: A Top-down Approach
 Topology Enhancement in Wireless Multihop Networks: A Top-down Approach Symeon Papavassiliou (joint work with Eleni Stai and Vasileios Karyotis) National Technical University of Athens (NTUA) School of
1 Random Graph Models for Networks
 Lecture Notes: Social Networks: Models, Algorithms, and Applications Lecture : Jan 6, 0 Scribes: Geoffrey Fairchild and Jason Fries Random Graph Models for Networks. Graph Modeling A random graph is a
Small World Properties Generated by a New Algorithm Under Same Degree of All Nodes
 Commun. Theor. Phys. (Beijing, China) 45 (2006) pp. 950 954 c International Academic Publishers Vol. 45, No. 5, May 15, 2006 Small World Properties Generated by a New Algorithm Under Same Degree of All
E6885 Network Science Lecture 5: Network Estimation and Modeling
 E 6885 Topics in Signal Processing -- Network Science E6885 Network Science Lecture 5: Network Estimation and Modeling Ching-Yung Lin, Dept. of Electrical Engineering, Columbia University October 7th,
Algorithms and Applications in Social Networks. 2017/2018, Semester B Slava Novgorodov
 Algorithms and Applications in Social Networks 2017/2018, Semester B Slava Novgorodov 1 Lesson #1 Administrative questions Course overview Introduction to Social Networks Basic definitions Network properties
Graph Theory. Network Science: Graph theory. Graph theory Terminology and notation. Graph theory Graph visualization
 Network Science: Graph Theory Ozalp abaoglu ipartimento di Informatica Scienza e Ingegneria Università di ologna www.cs.unibo.it/babaoglu/ ranch of mathematics for the study of structures called graphs
Similar Triangles. Triangles are similar if corresponding angles are equal. Now take a look at the sides of the two triangles shown in Figure 3.
 Imagine you are having a picnic at the lake. You look out across the lake and see a sailboat off in the distance the sail is a tiny triangle to the naked eye. For a closer look, you pick up the binoculars
How Do Real Networks Look? Networked Life NETS 112 Fall 2014 Prof. Michael Kearns
 How Do Real Networks Look? Networked Life NETS 112 Fall 2014 Prof. Michael Kearns Roadmap Next several lectures: universal structural properties of networks Each large-scale network is unique microscopically,
Network Data Sampling and Estimation
 Network Data Sampling and Estimation Hui Yang and Yanan Jia September 25, 2014 Yang, Jia September 25, 2014 1 / 33 Outline 1 Introduction 2 Network Sampling Designs Induced and Incident Subgraph Sampling
Decreasing the Diameter of Bounded Degree Graphs
 Decreasing the Diameter of Bounded Degree Graphs Noga Alon András Gyárfás Miklós Ruszinkó February, 00 To the memory of Paul Erdős Abstract Let f d (G) denote the minimum number of edges that have to be
Edge-minimal graphs of exponent 2
 JID:LAA AID:14042 /FLA [m1l; v1.204; Prn:24/02/2017; 12:28] P.1 (1-18) Linear Algebra and its Applications ( ) Contents lists available at ScienceDirect Linear Algebra and its Applications www.elsevier.com/locate/laa
CS249: SPECIAL TOPICS MINING INFORMATION/SOCIAL NETWORKS
 CS249: SPECIAL TOPICS MINING INFORMATION/SOCIAL NETWORKS Overview of Networks Instructor: Yizhou Sun yzsun@cs.ucla.edu January 10, 2017 Overview of Information Network Analysis Network Representation Network
Introduction to Graphs
 Introduction to Graphs CSE21 Winter 2017, Day 10 (B00), Day 6-7 (A00) February 1, 2017 http://vlsicad.ucsd.edu/courses/cse21-w17 What is a graph? A (directed) graph G is A nonempty set of vertices V, also
arxiv: v1 [cs.si] 11 Jan 2019
![arxiv: v1 [cs.si] 11 Jan 2019](/thumbs/93/113881109.jpg "arxiv: v1 [cs.si] 11 Jan 2019") A Community-aware Network Growth Model for Synthetic Social Network Generation Furkan Gursoy furkan.gursoy@boun.edu.tr Bertan Badur bertan.badur@boun.edu.tr arxiv:1901.03629v1 [cs.si] 11 Jan 2019 Dept.
A Community-aware Network Growth Model for Synthetic Social Network Generation Furkan Gursoy furkan.gursoy@boun.edu.tr Bertan Badur bertan.badur@boun.edu.tr arxiv:1901.03629v1 [cs.si] 11 Jan 2019 Dept.
Mathematical Foundations
 Mathematical Foundations Steve Borgatti Revised 7/04 in Colchester, U.K. Graphs Networks represented mathematically as graphs A graph G(V,E) consists of Set of nodes vertices V representing actors Set
SI Networks: Theory and Application, Fall 2008
 University of Michigan Deep Blue deepblue.lib.umich.edu 2008-09 SI 508 - Networks: Theory and Application, Fall 2008 Adamic, Lada Adamic, L. (2008, November 12). Networks: Theory and Application. Retrieved
Chapter 5: Probability and Statistics. Middle SchooI Assessments
 Chapter 5: Probability and Statistics Middle SchooI Assessments 264 Chapter 5: Probability and Statistics Perplexing Polygons grade 6 OVERARCHING PERPLEXING POLYGONS Cut along dotted lines In Mrs. Mac
Math.3336: Discrete Mathematics. Chapter 10 Graph Theory
 Math.3336: Discrete Mathematics Chapter 10 Graph Theory Instructor: Dr. Blerina Xhabli Department of Mathematics, University of Houston https://www.math.uh.edu/ blerina Email: blerina@math.uh.edu Fall
The Buss Reduction for the k-weighted Vertex Cover Problem
 The Buss Reduction for the k-weighted Vertex Cover Problem Hong Xu Xin-Zeng Wu Cheng Cheng Sven Koenig T. K. Satish Kumar University of Southern California, Los Angeles, California 90089, the United States
Social, Information, and Routing Networks: Models, Algorithms, and Strategic Behavior
 Social, Information, and Routing Networks: Models, Algorithms, and Strategic Behavior Who? Prof. Aris Anagnostopoulos Prof. Luciana S. Buriol Prof. Guido Schäfer What will We Cover? Topics: Network properties
Signal Processing for Big Data
 Signal Processing for Big Data Sergio Barbarossa 1 Summary 1. Networks 2.Algebraic graph theory 3. Random graph models 4. OperaGons on graphs 2 Networks The simplest way to represent the interaction between
CSE 190 Lecture 16. Data Mining and Predictive Analytics. Small-world phenomena
 CSE 190 Lecture 16 Data Mining and Predictive Analytics Small-world phenomena Another famous study Stanley Milgram wanted to test the (already popular) hypothesis that people in social networks are separated
Disclaimer. Lect 2: empirical analyses of graphs
 462 Page 1 Lect 2: empirical analyses of graphs Tuesday, September 11, 2007 8:30 AM Disclaimer These are my personal notes from this lecture. They may be wrong or inaccurate, and have not carefully been
Optimizing Random Walk Search Algorithms in P2P Networks
 Optimizing Random Walk Search Algorithms in P2P Networks Nabhendra Bisnik Rensselaer Polytechnic Institute Troy, New York bisnin@rpi.edu Alhussein A. Abouzeid Rensselaer Polytechnic Institute Troy, New
Introduction to Graphs
 Introduction to Graphs Russell Impagliazzo and Miles Jones Thanks to Janine Tiefenbruck http://cseweb.ucsd.edu/classes/sp16/cse21-bd/ April 18, 2016 1 What is a graph? A (directed) graph G is A nonempty
An Evolving Network Model With Local-World Structure
 The Eighth International Symposium on Operations Research and Its Applications (ISORA 09) Zhangjiajie, China, September 20 22, 2009 Copyright 2009 ORSC & APORC, pp. 47 423 An Evolving Network odel With
Network Mathematics - Why is it a Small World? Oskar Sandberg
 Network Mathematics - Why is it a Small World? Oskar Sandberg 1 Networks Formally, a network is a collection of points and connections between them. 2 Networks Formally, a network is a collection of points
Introduction to the Special Issue on AI & Networks
 Introduction to the Special Issue on AI & Networks Marie desjardins, Matthew E. Gaston, and Dragomir Radev March 16, 2008 As networks have permeated our world, the economy has come to resemble an ecology
Example for calculation of clustering coefficient Node N 1 has 8 neighbors (red arrows) There are 12 connectivities among neighbors (blue arrows)
 There are 12 connectivities among neighbors (blue arrows)") Example for calculation of clustering coefficient Node N 1 has 8 neighbors (red arrows) There are 12 connectivities among neighbors (blue arrows) Average clustering coefficient of a graph Overall measure
Example for calculation of clustering coefficient Node N 1 has 8 neighbors (red arrows) There are 12 connectivities among neighbors (blue arrows) Average clustering coefficient of a graph Overall measure
Network Theory: Social, Mythological and Fictional Networks. Math 485, Spring 2018 (Midterm Report) Christina West, Taylor Martins, Yihe Hao
 Christina West, Taylor Martins, Yihe Hao") Network Theory: Social, Mythological and Fictional Networks Math 485, Spring 2018 (Midterm Report) Christina West, Taylor Martins, Yihe Hao Abstract: Comparative mythology is a largely qualitative and
Network Theory: Social, Mythological and Fictional Networks Math 485, Spring 2018 (Midterm Report) Christina West, Taylor Martins, Yihe Hao Abstract: Comparative mythology is a largely qualitative and
15 Graph Theory Counting the Number of Relations. 2. onto (surjective).
.") 2. onto (surjective). You should convince yourself that if these two properties hold, then it is always going to be the case that f 1 is a function. In order to do this, you should remember the definition
2. onto (surjective). You should convince yourself that if these two properties hold, then it is always going to be the case that f 1 is a function. In order to do this, you should remember the definition
3.1 Basic Definitions and Applications
 Chapter 3 Graphs Slides by Kevin Wayne. Copyright 2005 Pearson-Addison Wesley. All rights reserved. 1 3.1 Basic Definitions and Applications Undirected Graphs Undirected graph. G = (V, E) V = nodes. E
Grades 7 & 8, Math Circles 31 October/1/2 November, Graph Theory
 Faculty of Mathematics Waterloo, Ontario N2L 3G1 Centre for Education in Mathematics and Computing Grades 7 & 8, Math Circles 31 October/1/2 November, 2017 Graph Theory Introduction Graph Theory is the
Importance of IP Alias Resolution in Sampling Internet Topologies
 Importance of IP Alias Resolution in Sampling Internet Topologies Mehmet H. Gunes and Kamil Sarac Global Internet Symposium 007, Anchorage, AK Introduction: Internet Mapping Topology measurement studies
Mining and Analyzing Online Social Networks
 The 5th EuroSys Doctoral Workshop (EuroDW 2011) Salzburg, Austria, Sunday 10 April 2011 Mining and Analyzing Online Social Networks Emilio Ferrara eferrara@unime.it Advisor: Prof. Giacomo Fiumara PhD School
UNIVERSITA DEGLI STUDI DI CATANIA FACOLTA DI INGEGNERIA
 UNIVERSITA DEGLI STUDI DI CATANIA FACOLTA DI INGEGNERIA PhD course in Electronics, Automation and Complex Systems Control-XXIV Cycle DIPARTIMENTO DI INGEGNERIA ELETTRICA ELETTRONICA E DEI SISTEMI ing.
Chapter 1. Social Media and Social Computing. October 2012 Youn-Hee Han
 Chapter 1. Social Media and Social Computing October 2012 Youn-Hee Han http://link.koreatech.ac.kr 1.1 Social Media A rapid development and change of the Web and the Internet Participatory web application
SELF-HEALING NETWORKS: REDUNDANCY AND STRUCTURE
 SELF-HEALING NETWORKS: REDUNDANCY AND STRUCTURE Guido Caldarelli IMT, CNR-ISC and LIMS, London UK DTRA Grant HDTRA1-11-1-0048 INTRODUCTION The robustness and the shape Baran, P. On distributed Communications
Wednesday, March 8, Complex Networks. Presenter: Jirakhom Ruttanavakul. CS 790R, University of Nevada, Reno
 Wednesday, March 8, 2006 Complex Networks Presenter: Jirakhom Ruttanavakul CS 790R, University of Nevada, Reno Presented Papers Emergence of scaling in random networks, Barabási & Bonabeau (2003) Scale-free
Unit 2: Graphs and Matrices. ICPSR University of Michigan, Ann Arbor Summer 2015 Instructor: Ann McCranie
 Unit 2: Graphs and Matrices ICPSR University of Michigan, Ann Arbor Summer 2015 Instructor: Ann McCranie Four main ways to notate a social network There are a variety of ways to mathematize a social network,
Graph Structure Over Time
 Graph Structure Over Time Observing how time alters the structure of the IEEE data set Priti Kumar Computer Science Rensselaer Polytechnic Institute Troy, NY Kumarp3@rpi.edu Abstract This paper examines
Response Network Emerging from Simple Perturbation
 Journal of the Korean Physical Society, Vol 44, No 3, March 2004, pp 628 632 Response Network Emerging from Simple Perturbation S-W Son, D-H Kim, Y-Y Ahn and H Jeong Department of Physics, Korea Advanced
An introduction to the physics of complex networks
 An introduction to the physics of complex networks Alain Barrat CPT, Marseille, France ISI, Turin, Italy http://www.cpt.univ-mrs.fr/~barrat http://www.cxnets.org http://www.sociopatterns.org REVIEWS: Statistical
Exercise set #2 (29 pts)
") (29 pts) The deadline for handing in your solutions is Nov 16th 2015 07:00. Return your solutions (one.pdf le and one.zip le containing Python code) via e- mail to Becs-114.4150@aalto.fi. Additionally,
(29 pts) The deadline for handing in your solutions is Nov 16th 2015 07:00. Return your solutions (one.pdf le and one.zip le containing Python code) via e- mail to Becs-114.4150@aalto.fi. Additionally,
Chapter 3. Graphs. Slides by Kevin Wayne. Copyright 2005 Pearson-Addison Wesley. All rights reserved.
 Chapter 3 Graphs Slides by Kevin Wayne. Copyright 2005 Pearson-Addison Wesley. All rights reserved. 1 3.1 Basic Definitions and Applications Undirected Graphs Undirected graph. G = (V, E) V = nodes. E
Graph Theory for Network Science
 Graph Theory for Network Science Dr. Natarajan Meghanathan Professor Department of Computer Science Jackson State University, Jackson, MS E-mail: natarajan.meghanathan@jsums.edu Networks or Graphs We typically
1 Introduction. Counting with Cubes. Barringer Winter MathCamp, 2016
 1 Introduction Consider a large cube made from unit cubes 1 Suppose our cube is n n n Look at the cube from a corner so that you can see three faces How many unit cubes are in your line of vision? Build
Example 1: An algorithmic view of the small world phenomenon
 Lecture Notes: Social Networks: Models, Algorithms, and Applications Lecture 1: Jan 17, 2012 Scribes: Preethi Ambati and Azar Aliyev Example 1: An algorithmic view of the small world phenomenon The story
Instructor: Paul Zeitz, University of San Francisco
 Berkeley Math Circle Graph Theory and Ramsey Theory Instructor: Paul Zeitz, University of San Francisco (zeitz@usfca.edu) Definitions 1 A graph is a pair (V,E), where V is a finite set and E is a set of
Advanced Algorithms and Models for Computational Biology -- a machine learning approach
 Advanced Algorithms and Models for Computational Biology -- a machine learning approach Biological Networks & Network Evolution Eric Xing Lecture 22, April 10, 2006 Reading: Molecular Networks Interaction
Instant Insanity Instructor s Guide Make-it and Take-it Kit for AMTNYS 2006
 Instant Insanity Instructor s Guide Make-it and Take-it Kit for AMTNYS 2006 THE KIT: This kit contains materials for two Instant Insanity games, a student activity sheet with answer key and this instructor
Graph Theory and Network Measurment
 Graph Theory and Network Measurment Social and Economic Networks MohammadAmin Fazli Social and Economic Networks 1 ToC Network Representation Basic Graph Theory Definitions (SE) Network Statistics and
1 More configuration model
 1 More configuration model In the last lecture, we explored the definition of the configuration model, a simple method for drawing networks from the ensemble, and derived some of its mathematical properties.
TELCOM2125: Network Science and Analysis
 School of Information Sciences University of Pittsburgh TELCOM2125: Network Science and Analysis Konstantinos Pelechrinis Spring 2015 Figures are taken from: M.E.J. Newman, Networks: An Introduction 2
Network Thinking. Complexity: A Guided Tour, Chapters 15-16
 Network Thinking Complexity: A Guided Tour, Chapters 15-16 Neural Network (C. Elegans) http://gephi.org/wp-content/uploads/2008/12/screenshot-celegans.png Food Web http://1.bp.blogspot.com/_vifbm3t8bou/sbhzqbchiei/aaaaaaaaaxk/rsc-pj45avc/
An Exploratory Journey Into Network Analysis A Gentle Introduction to Network Science and Graph Visualization
 An Exploratory Journey Into Network Analysis A Gentle Introduction to Network Science and Graph Visualization Pedro Ribeiro (DCC/FCUP & CRACS/INESC-TEC) Part 1 Motivation and emergence of Network Science
Lecture 1: Networks: A brief introduction
 Lecture 1: Networks: A brief introduction Sudipta Sarangi Virginia Tech Networks Network: Defines the interaction structure between agents through the set of ties between them. Agents: individuals, organizations,
1. Performance Comparison of Interdependent and Isolated Systems
 Supplementary Information for: Fu, G., Dawson, R., Khoury, M., & Bullock, S. (2014) Interdependent networks: Vulnerability analysis and strategies to limit cascading failure, European Physical Journal
CTI, November 19, 2015
 Consider a large cube made from unit cubes 1 Suppose our cube is n n n Look at the cube from a corner so that you can see three faces How many unit cubes are in your line of vision? Build a table that
The Establishment Game. Motivation
 Motivation Motivation The network models so far neglect the attributes, traits of the nodes. A node can represent anything, people, web pages, computers, etc. Motivation The network models so far neglect
MCL. (and other clustering algorithms) 858L
 858L") MCL (and other clustering algorithms) 858L Comparing Clustering Algorithms Brohee and van Helden (2006) compared 4 graph clustering algorithms for the task of finding protein complexes: MCODE RNSC Restricted
MCL (and other clustering algorithms) 858L Comparing Clustering Algorithms Brohee and van Helden (2006) compared 4 graph clustering algorithms for the task of finding protein complexes: MCODE RNSC Restricted
Lesson 1. Unit 2 Practice Problems. Problem 2. Problem 1. Solution 1, 4, 5. Solution. Problem 3
 Unit 2 Practice Problems Lesson 1 Problem 1 Rectangle measures 12 cm by 3 cm. Rectangle is a scaled copy of Rectangle. Select all of the measurement pairs that could be the dimensions of Rectangle. 1.
NETWORK ANALYSIS. Duygu Tosun-Turgut, Ph.D. Center for Imaging of Neurodegenerative Diseases Department of Radiology and Biomedical Imaging
 NETWORK ANALYSIS Duygu Tosun-Turgut, Ph.D. Center for Imaging of Neurodegenerative Diseases Department of Radiology and Biomedical Imaging duygu.tosun@ucsf.edu What is a network? - Complex web-like structures
Graph Sampling Approach for Reducing. Computational Complexity of. Large-Scale Social Network
 Journal of Innovative Technology and Education, Vol. 3, 216, no. 1, 131-137 HIKARI Ltd, www.m-hikari.com http://dx.doi.org/1.12988/jite.216.6828 Graph Sampling Approach for Reducing Computational Complexity
Majority and Friendship Paradoxes
 Majority and Friendship Paradoxes Majority Paradox Example: Small town is considering a bond initiative in an upcoming election. Some residents are in favor, some are against. Consider a poll asking the
Graph theory and GIS
 Geoinformatics FCE CTU 2009 Workshop 18th september 2009 Contents Graph as such Definition Alternative definition Undirected graphs Graphs as a model of reality Contents Graph as such Definition Alternative