Lecture 21 - Chapter 8 (Raster Analysis, part2)
|
|
|
- Rudolph Ball
- 5 years ago
- Views:
Transcription
1 GEOL 452/552 - GIS for Geoscientists I Lecture 21 - Chapter 8 (Raster Analysis, part2) Today: Digital Elevation Models (DEMs), Topographic functions (surface analysis): slope, aspect hillshade, viewshed, contours, profiles USGS Seamless raster data server Ch 8 Tut no new HW (HW 12: Ch 8 ex. 1,2, 5, due Nov. 12) 1
 Aspect")
 Slope (degrees or percent)")

2 Common surface analysis methods Hillshade (typically as semi-transparent overlay) Aspect (8 main directions only) Contour (lines of equal elevation) Slope (degrees or percent) Viewshed (which cells are visible from a viewpoint?) Profile (horizontal cut through DEM along a line) 2
 (10 m = 1/9 arc second, 30 m = 1/3 arc sec., 90 m = 1 arc sec.")
3 Digital Elevation Model (DEM) also: Digital Terrain Model (DTM) topography: Elevation (ft. or meter, sometimes: elevation in feet, but horizontal distances in meters!) (10 m = 1/9 arc second, 30 m = 1/3 arc sec., 90 m = 1 arc sec.) Data (US Geological Survey) National Elevation Dataset (NED): 10 m, 30 m, 90 m Shuttle Radar Topography Mission (SRTM): 90 m LiDAR data (for Iowa in progress): <1 m horizontal, ~ 20 cm vertical Elevation (Z-direction) in feet or meters? (important for slope, hillshade, viewshed) Many surface analysis technique also apply for other types of Elevation : Depth (to bedrock), pollution, distance, etc. - 3
4 Class exercise (Re?-)enable Spatial Analyst extension and toolbar data is in data\follow along\8b_class_ex (copy folder) load ArcMap document 8B_class_ex.mxd always use dem_float.img (elevation in meters) as input for surface analysis functions all surface derived rasters are in 8B_class_ex\surface rasters (backup only, do your own!) All functions are under Spatial Analyst - Surface analysis 4

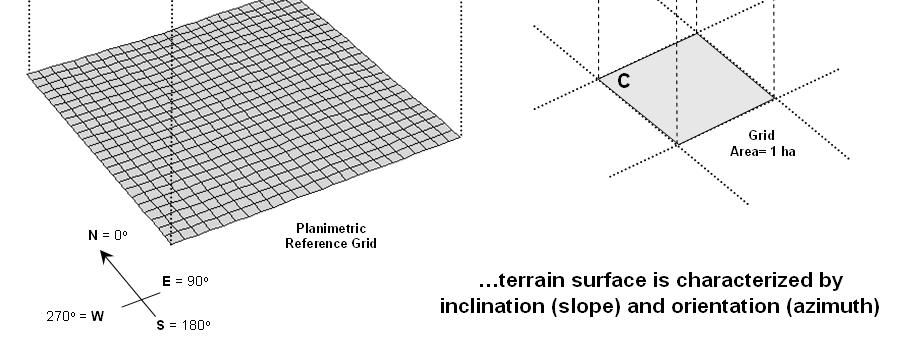
5 Slope & Azimuth 5
 is in feet Solution: multiply elevation by 3.280 (Z-factor) Spatial Analyst -> Surface Analysis or ArcToolbox - Spatial Analyst tools (not TIN slope!")
6 Slope Based on elevation difference of cell to elevation of surrounding cells (next slide) Gradient at cell (center) Perfectly flat: Slope = 0 Problem: X/Y in meters, but elevation (Z) is in feet Solution: multiply elevation by (Z-factor) Spatial Analyst -> Surface Analysis or ArcToolbox - Spatial Analyst tools (not TIN slope!) 6
 here: center-center distance ( = run) always")

7 Simple Slope Method (here: %) Elevation Differences Center to each of the 8 surrounding cell centers (= rise) here: center-center distance ( = run) always 100 (m) use average of these 8 slope values More complex method (used by ArcGIS) fit plane through 9 points calculate tilt vs horizontal See Desktop Help How Slope works 7
 in degrees (0-360) from North, circular data type flat areas (no slope): encoded as -1 typical: show as 8 directions (colors) Looks like 3D slopes (similar to hill shading) Spatial")
8 Aspect cell center s direction, when looking down towards max. (!) slope (think: which compass heading would water run?) in degrees (0-360) from North, circular data type flat areas (no slope): encoded as -1 typical: show as 8 directions (colors) Looks like 3D slopes (similar to hill shading) Spatial Analyst - Surface Analysis, ArctoolBox - Spatial Analysis Tools(!)- Aspect 8
 Simulate Sun from direction (0-360) and angle (0-90), creates grey scale map best color ramp: black = no sunlight, white = max.")
 Similar to Slope (also a gradient ), good in combination with other layers Make10% - 50% transparent, drape over other layer")
9 Hillshading Trick to fool our eyes to see elevation as 3D relief (Think: how do artists draw a sphere via pencil shading?) Simulate Sun from direction (0-360) and angle (0-90), creates grey scale map best color ramp: black = no sunlight, white = max. sunlight, Gotcha: Sun must be in the North (270-90), otherwise relief looks inverted (human evolution - sun from above?) Smoothing of grayscale raster: Display - Resample... - Bilinear or Cubic (Also: Contrast 10% - 30%) Similar to Slope (also a gradient ), good in combination with other layers Make10% - 50% transparent, drape over other layer (DEM, slope, etc.) and/or contour lines Spatial Analyst - Surface Analysis, ArctoolBox - Spatial Analysis Tools(!) 9
10 Viewshed needs DEM + shapefile with points Which cells can be seen from these points? (red = no, green = yes) Shoots rays from point to each cell, check for intersect with terrain Can also use lines (visible from road, river, etc.?) Observer points tool: which points can see other points? Spatial Analyst - Surface Analysis, ArctoolBox - Spatial Analysis Tools(!) 10
 Not Visible : means no")


11 VALUE attribute: number of viewpoints visible (number of hits from rays) Not Visible : means no hits, Visible : mean one or more hits VALUE: total number of hits, but you don t know which viewpoints hit a certain cell! Also works for line ( can you see #2 from the bridge? ) Not Visible Visible 11
 Save as line features as contours_100m.")
12 Contours Lines of equal Elevation traditionally: shown on a topomap (USGS) Make sure to use the elevation data set! Let s create 100 m contours (starting at 0, a line every 100 m) Save as line features as contours_100m.shp 12


13 Labels: - use CONTOU attribute - placement properties: Parallel, On line, Halo (?) - for gaps around labels see WebCT - GIS material - Creating_Advanced_cartographic_effects.pdf 13
14 Profiles Activate 3D Analyst extension and tool Set 3D Analyst layer to dem_float.img Click on Interpolate Line tool Click first profile point 2x click to finish line (2. profile point) Click Profile Tool Works on selected graphics or line features If Profile tool is greyed-out: need to select graphic (via Black arrow) or line feature Profile tool Interpolate line Tool This is a graphics line only! 14

 Display = preview in Browser (not all")
 Request download area: interactive")

15 Seamless.usgs.gov Web based raster download (can be clunky!) Display = preview in Browser (not all types of data are available everywhere!) Request download area: interactive rectangle or extent (lat/long) Download data or modify Data request (wait for refresh) If possible get geotifs, warning: data can be large, don t download multiple files! 15
16 Wrap up Next lecture: zonal statistics ( Polygons ), interpolation, set-up (mask, resolution), Effects toolbar Lab: Ch 8 Tutorial no new HW (HW 12: Ch 8 ex. 1,2, 5, due Nov. 12) 16
Final project: Lecture 21 - Chapter 8 (Raster Analysis, part2) GEOL 452/552 - GIS for Geoscientists I
 GEOL 452/552 - GIS for Geoscientists I") GEOL 452/552 - GIS for Geoscientists I Lecture 21 - Chapter 8 (Raster Analysis, part2) Talk about class project (copy follow_along_data\ch8a_class_ex into U:\ArcGIS\ if needed) Catch up with lecture 20
GEOL 452/552 - GIS for Geoscientists I Lecture 21 - Chapter 8 (Raster Analysis, part2) Talk about class project (copy follow_along_data\ch8a_class_ex into U:\ArcGIS\ if needed) Catch up with lecture 20
Lecture 22 - Chapter 8 (Raster Analysis, part 3)
") GEOL 452/552 - GIS for Geoscientists I Lecture 22 - Chapter 8 (Raster Analysis, part 3) Today: Zonal Analysis (statistics) for polygons, lines, points, interpolation (IDW), Effects Toolbar, analysis masks
GEOL 452/552 - GIS for Geoscientists I Lecture 22 - Chapter 8 (Raster Analysis, part 3) Today: Zonal Analysis (statistics) for polygons, lines, points, interpolation (IDW), Effects Toolbar, analysis masks
Lecture 20 - Chapter 8 (Raster Analysis, part1)
") GEOL 452/552 - GIS for Geoscientists I Lecture 20 - Chapter 8 (Raster Analysis, part) 4 lectures on rasters - but won t cover everything (Raster GIS course: Geol 588: GIS II (Spring 20) Today: Raster data,
GEOL 452/552 - GIS for Geoscientists I Lecture 20 - Chapter 8 (Raster Analysis, part) 4 lectures on rasters - but won t cover everything (Raster GIS course: Geol 588: GIS II (Spring 20) Today: Raster data,
Tutorial 1: Downloading elevation data
 Tutorial 1: Downloading elevation data Objectives In this exercise you will learn how to acquire elevation data from the website OpenTopography.org, project the dataset into a UTM coordinate system, and
Applied Cartography and Introduction to GIS GEOG 2017 EL. Lecture-7 Chapters 13 and 14
 Applied Cartography and Introduction to GIS GEOG 2017 EL Lecture-7 Chapters 13 and 14 Data for Terrain Mapping and Analysis DEM (digital elevation model) and TIN (triangulated irregular network) are two
Tutorial 18: 3D and Spatial Analyst - Creating a TIN and Visual Analysis
 Tutorial 18: 3D and Spatial Analyst - Creating a TIN and Visual Analysis Module content 18.1. Creating a TIN 18.2. Spatial Analyst Viewsheds, Slopes, Hillshades and Density. 18.1 Creating a TIN Sometimes
GEOGRAPHIC INFORMATION SYSTEMS Lecture 25: 3D Analyst
 GEOGRAPHIC INFORMATION SYSTEMS Lecture 25: 3D Analyst 3D Analyst - 3D Analyst is an ArcGIS extension designed to work with TIN data (triangulated irregular network) - many of the tools in 3D Analyst also
I CALCULATIONS WITHIN AN ATTRIBUTE TABLE
 Geology & Geophysics REU GPS/GIS 1-day workshop handout #4: Working with data in ArcGIS You will create a raster DEM by interpolating contour data, create a shaded relief image, and pull data out of the
Lecture 23 - LiDAR. GEOL 452/552 - GIS for Geoscientists I. Scanning Lidar. 30 m DEM. Lidar representations:
 GEOL 452/552 - GIS for Geoscientists I Lecture 23 - LiDAR LiDAR - some background (thanks to Chris Kahle, DNR) Converting Lidar point data to a raster Look at online lidar data for Iowa (1m hillshaded)
In this lab, you will create two maps. One map will show two different projections of the same data.
 Projection Exercise Part 2 of 1.963 Lab for 9/27/04 Introduction In this exercise, you will work with projections, by re-projecting a grid dataset from one projection into another. You will create a map
Lab 18c: Spatial Analysis III: Clip a raster file using a Polygon Shapefile
 Environmental GIS Prepared by Dr. Zhi Wang, CSUF EES Department Lab 18c: Spatial Analysis III: Clip a raster file using a Polygon Shapefile These instructions enable you to clip a raster layer in ArcMap
Terrain Analysis. Using QGIS and SAGA
 Terrain Analysis Using QGIS and SAGA Tutorial ID: IGET_RS_010 This tutorial has been developed by BVIEER as part of the IGET web portal intended to provide easy access to geospatial education. This tutorial
Copyright The McGraw-Hill Companies, Inc. Permission required for reproduction or display.
 Chapter 13. TERRAIN MAPPING AND ANALYSIS 13.1 Data for Terrain Mapping and Analysis 13.1.1 DEM 13.1.2 TIN Box 13.1 Terrain Data Format 13.2 Terrain Mapping 13.2.1 Contouring 13.2.2 Vertical Profiling 13.2.3
A Second Look at DEM s
 A Second Look at DEM s Overview Detailed topographic data is available for the U.S. from several sources and in several formats. Perhaps the most readily available and easy to use is the National Elevation
Introduction to GIS 2011
 Introduction to GIS 2011 Digital Elevation Models CREATING A TIN SURFACE FROM CONTOUR LINES 1. Start ArcCatalog from either Desktop or Start Menu. 2. In ArcCatalog, create a new folder dem under your c:\introgis_2011
CRC Website and Online Book Materials Page 1 of 16
 Page 1 of 16 Appendix 2.3 Terrain Analysis with USGS DEMs OBJECTIVES The objectives of this exercise are to teach readers to: Calculate terrain attributes and create hillshade maps and contour maps. use,
Local Elevation Surface Modeling using GPS Derived Point Clouds. John G. Whitman, Jr.
 Local Elevation Surface Modeling using GPS Derived Point Clouds WhitmanJ2@myfairpoint.net Study Area Overview Topographic Background NAIP with Roads and Streams Public DEM Models of Study Area National
Overview. Review. GEOL 452/552 - GIS for Geoscientists I. Lecture 4. what is a feature class? What is georeferenced Data? what are layers?
 GEOL 452/552 - GIS for Geoscientists I Lecture 4 Overview Tutorial and HW 1 went OK? Today Review of concepts from last lecture Scales Labels ArcMap follow-along tour More material about ArcMap in WebCT
George Mason University Department of Civil, Environmental and Infrastructure Engineering
 George Mason University Department of Civil, Environmental and Infrastructure Engineering Dr. Celso Ferreira Prepared by Lora Baumgartner December 2015 Revised by Brian Ross July 2016 Exercise Topic: GIS
CONTENTS 1 INTRODUCTION 3 ARCGIS 5 START ARCMAP 11 IMPORT 1: MAP DATA 12 ADD WIND FARM DATA 21 CREATE A MAP TO INSERT IN A REPORT 32
 CONTENTS CONTENTS 1 INTRODUCTION 3 SCENARIO 3 WHAT WILL I LEARN? 3 WHAT DATA DO I HAVE? 4 ARCGIS 5 ARCMAP 6 ARCCATALOG 8 ARCTOOLBOX 9 START ARCMAP 11 IMPORT 1:250000 MAP DATA 12 CREATE A GROUP LAYER 16
Lab 11: Terrain Analyses
 Lab 11: Terrain Analyses What You ll Learn: Basic terrain analysis functions, including watershed, viewshed, and profile processing. There is a mix of old and new functions used in this lab. We ll explain
Lab 11: Terrain Analyses
 Lab 11: Terrain Analyses What You ll Learn: Basic terrain analysis functions, including watershed, viewshed, and profile processing. There is a mix of old and new functions used in this lab. We ll explain
Digital Elevation Model & Surface Analysis
 Topics: Digital Elevation Model & Surface Analysis 1. Introduction 2. Create raster DEM 3. Examine Lidar DEM 4. Deriving secondary surface products 5. Mapping contours 6. Viewshed Analysis 7. Extract elevation
LAB #7 Creating TIN and 3D scenes (ArcScene) GISC, UNIVERSITY OF CALIFORNIA BERKELEY
 GISC, UNIVERSITY OF CALIFORNIA BERKELEY") LAB #7 Creating TIN and 3D scenes (ArcScene) GISC, UNIVERSITY OF CALIFORNIA BERKELEY The purpose of this laboratory is to introduce and explore surface data analysis using a vector data model: TIN. We
LAB #7 Creating TIN and 3D scenes (ArcScene) GISC, UNIVERSITY OF CALIFORNIA BERKELEY The purpose of this laboratory is to introduce and explore surface data analysis using a vector data model: TIN. We
Digital Elevation Models (DEM)
") Digital Elevation Models (DEM) Digital representation of the terrain surface also referred to as Digital Terrain Models (DTM) Digital Elevation Models (DEM) How has relief depiction changed with digital
Digital Elevation Models (DEM) Digital representation of the terrain surface also referred to as Digital Terrain Models (DTM) Digital Elevation Models (DEM) How has relief depiction changed with digital
Using GIS to Site Minimal Excavation Helicopter Landings
 Using GIS to Site Minimal Excavation Helicopter Landings The objective of this analysis is to develop a suitability map for aid in locating helicopter landings in mountainous terrain. The tutorial uses
I. An Intro to ArcMap Version 9.3 and 10. 1) Arc Map is basically a build your own Google map
 Arc Map is basically a build your own Google map") I. An Intro to ArcMap Version 9.3 and 10 What is Arc Map? 1) Arc Map is basically a build your own Google map a. Display and manage geo-spatial data (maps, images, points that have a geographic location)
I. An Intro to ArcMap Version 9.3 and 10 What is Arc Map? 1) Arc Map is basically a build your own Google map a. Display and manage geo-spatial data (maps, images, points that have a geographic location)
Lab 1: Introduction to ArcGIS
 Lab 1: Introduction to ArcGIS Objectives In this lab you will: 1) Learn the basics of the software package we will be using for the remainder of the semester, and 2) Discover the role that climate and
GIS LAB 8. Raster Data Applications Watershed Delineation
 GIS LAB 8 Raster Data Applications Watershed Delineation This lab will require you to further your familiarity with raster data structures and the Spatial Analyst. The data for this lab are drawn from
The 3D Analyst extension extends ArcGIS to support surface modeling and 3- dimensional visualization. 3D Shape Files
 NRM 435 Spring 2016 ArcGIS 3D Analyst Page#1 of 9 0B3D Analyst Extension The 3D Analyst extension extends ArcGIS to support surface modeling and 3- dimensional visualization. 3D Shape Files Analogous to
Lab 10: Raster Analyses
 Lab 10: Raster Analyses What You ll Learn: Spatial analysis and modeling with raster data. You will estimate the access costs for all points on a landscape, based on slope and distance to roads. You ll
GEOGRAPHIC INFORMATION SYSTEMS Lecture 24: Spatial Analyst Continued
 GEOGRAPHIC INFORMATION SYSTEMS Lecture 24: Spatial Analyst Continued Spatial Analyst - Spatial Analyst is an ArcGIS extension designed to work with raster data - in lecture I went through a series of demonstrations
Watershed Sciences 4930 & 6920 GEOGRAPHIC INFORMATION SYSTEMS
 HOUSEKEEPING Watershed Sciences 4930 & 6920 GEOGRAPHIC INFORMATION SYSTEMS CONTOURS! Self-Paced Lab Due Friday! WEEK SIX Lecture RASTER ANALYSES Joe Wheaton YOUR EXCERCISE Integer Elevations Rounded up
Lab 7: Bedrock rivers and the relief structure of mountain ranges
 Lab 7: Bedrock rivers and the relief structure of mountain ranges Objectives In this lab, you will analyze the relief structure of the San Gabriel Mountains in southern California and how it relates to
COPYRIGHTED MATERIAL. Introduction to 3D Data: Modeling with ArcGIS 3D Analyst and Google Earth CHAPTER 1
 CHAPTER 1 Introduction to 3D Data: Modeling with ArcGIS 3D Analyst and Google Earth Introduction to 3D Data is a self - study tutorial workbook that teaches you how to create data and maps with ESRI s
ROCKY FORK TRACT: VIEWSHED ANALYSIS REPORT
 ROCKY FORK TRACT: VIEWSHED ANALYSIS REPORT Prepared for: The Conservation Fund Prepared by: A Carroll GIS 3711 Skylark Trail Chattanoga, TN 37416 INTRODUCTION This report documents methods and results
Spatial Analysis Exercise GIS in Water Resources Fall 2011
 Spatial Analysis Exercise GIS in Water Resources Fall 2011 Prepared by David G. Tarboton and David R. Maidment Goal The goal of this exercise is to serve as an introduction to Spatial Analysis with ArcGIS.
Working with Elevation Data URPL 969 Applied GIS Workshop: Rethinking New Orleans After Hurricane Katrina Spring 2006
 Working with Elevation Data URPL 969 Applied GIS Workshop: Rethinking New Orleans After Hurricane Katrina Spring 2006 This GIS lab exercise will explore Light Detection And Ranging (LiDAR) data for New
Digital Elevation Models
 Digital Elevation Models National Elevation Dataset 1 Data Sets US DEM series 7.5, 30, 1 o for conterminous US 7.5, 15 for Alaska US National Elevation Data (NED) GTOPO30 Global Land One-kilometer Base
Contents of Lecture. Surface (Terrain) Data Models. Terrain Surface Representation. Sampling in Surface Model DEM
 Data Models. Terrain Surface Representation. Sampling in Surface Model DEM") Lecture 13: Advanced Data Models: Terrain mapping and Analysis Contents of Lecture Surface Data Models DEM GRID Model TIN Model Visibility Analysis Geography 373 Spring, 2006 Changjoo Kim 11/29/2006 1
Lecture 13: Advanced Data Models: Terrain mapping and Analysis Contents of Lecture Surface Data Models DEM GRID Model TIN Model Visibility Analysis Geography 373 Spring, 2006 Changjoo Kim 11/29/2006 1
Basics of Using LiDAR Data
 Conservation Applications of LiDAR Basics of Using LiDAR Data Exercise #2: Raster Processing 2013 Joel Nelson, University of Minnesota Department of Soil, Water, and Climate This exercise was developed
GY461 GIS 1: Environmental Campus Topography Project with ArcGIS 9.x
 I. Introduction GY461 GIS 1: Environmental In this project you will use data from a topographic survey of the USA campus to generate 2 separate maps: 1. A color-coded 2-dimensional topographic contour
Field-Scale Watershed Analysis
 Conservation Applications of LiDAR Field-Scale Watershed Analysis A Supplemental Exercise for the Hydrologic Applications Module Andy Jenks, University of Minnesota Department of Forest Resources 2013
Learn how to delineate a watershed using the hydrologic modeling wizard
 v. 11.0 WMS 11.0 Tutorial Learn how to delineate a watershed using the hydrologic modeling wizard Objectives Import a digital elevation model, compute flow directions, and delineate a watershed and sub-basins
GEO 465/565 - Lab 7 Working with GTOPO30 Data in ArcGIS 9
 GEO 465/565 - Lab 7 Working with GTOPO30 Data in ArcGIS 9 This lab explains how work with a Global 30-Arc-Second (GTOPO30) digital elevation model (DEM) from the U.S. Geological Survey. This dataset can
University of West Hungary, Faculty of Geoinformatics. Béla Márkus. Spatial Analysis 5. module SAN5. 3D analysis
 University of West Hungary, Faculty of Geoinformatics Béla Márkus Spatial Analysis 5. module SAN5 3D analysis SZÉKESFEHÉRVÁR 2010 The right to this intellectual property is protected by the 1999/LXXVI
Steps for Modeling a Proposed New Reservoir in GIS
 Steps for Modeling a Proposed New Reservoir in GIS Requirements: ArcGIS ArcMap, ArcScene, Spatial Analyst, and 3D Analyst There s a new reservoir proposed for Right Hand Fork in Logan Canyon. I wanted
BRIEF EXAMPLES OF PRACTICAL USES OF LIDAR
 BRIEF EXAMPLES OF PRACTICAL USES OF LIDAR PURDUE ROAD SCHOOL - 3/9/2016 CHRIS MORSE USDA-NRCS, STATE GIS COORDINATOR LIDAR/DEM SOURCE DATES LiDAR and its derivatives (DEMs) have a collection date for data
Learn how to delineate a watershed using the hydrologic modeling wizard
 v. 10.1 WMS 10.1 Tutorial Learn how to delineate a watershed using the hydrologic modeling wizard Objectives Import a digital elevation model, compute flow directions, and delineate a watershed and sub-basins
Lab 12: Sampling and Interpolation
 Lab 12: Sampling and Interpolation What You ll Learn: -Systematic and random sampling -Majority filtering -Stratified sampling -A few basic interpolation methods Data for the exercise are in the L12 subdirectory.
START>PROGRAMS>ARCGIS>
 Department of Urban Studies and Planning Spring 2006 Department of Architecture Site and Urban Systems Planning 11.304J / 4.255J GIS EXERCISE 2 Objectives: To generate the following maps using ArcGIS Software:
GeoEarthScope NoCAL San Andreas System LiDAR pre computed DEM tutorial
 GeoEarthScope NoCAL San Andreas System LiDAR pre computed DEM tutorial J Ramón Arrowsmith Chris Crosby School of Earth and Space Exploration Arizona State University ramon.arrowsmith@asu.edu http://lidar.asu.edu
I.1. Digitize landslide region and micro-topography using satellite image
 I. Data Preparation At this part, it will be shown the stages of process on preparing all types of data which required in making of landslide potential and banjir bandang hazard map. I.1. Digitize landslide
RASTER ANALYSIS S H A W N L. P E N M A N E A R T H D A T A A N A LY S I S C E N T E R U N I V E R S I T Y O F N E W M E X I C O
 RASTER ANALYSIS S H A W N L. P E N M A N E A R T H D A T A A N A LY S I S C E N T E R U N I V E R S I T Y O F N E W M E X I C O TOPICS COVERED Spatial Analyst basics Raster / Vector conversion Raster data
Image Services for Elevation Data
 Image Services for Elevation Data Peter Becker Need for Elevation Using Image Services for Elevation Data sources Creating Elevation Service Requirement: GIS and Imagery, Integrated and Accessible Field
Lab 10: Raster Analyses
 Lab 10: Raster Analyses What You ll Learn: Spatial analysis and modeling with raster data. You will estimate the access costs for all points on a landscape, based on slope and distance to roads. You ll
L7 Raster Algorithms
 L7 Raster Algorithms NGEN6(TEK23) Algorithms in Geographical Information Systems by: Abdulghani Hasan, updated Nov 216 by Per-Ola Olsson Background Store and analyze the geographic information: Raster
UNDERSTAND HOW TO SET UP AND RUN A HYDRAULIC MODEL IN HEC-RAS CREATE A FLOOD INUNDATION MAP IN ARCGIS.
 CE 412/512, Spring 2017 HW9: Introduction to HEC-RAS and Floodplain Mapping Due: end of class, print and hand in. HEC-RAS is a Hydrologic Modeling System that is designed to describe the physical properties
Mapping the Thickness of the Rocky Flats Alluvium and Reconstructing the Pleistocene Rocky Flats Paleogeography (with Spatial Analyst).
.") Exercise 8 Mapping the Thickness of the Rocky Flats Alluvium and Reconstructing the Pleistocene Rocky Flats Paleogeography (with Spatial Analyst). Due: Thursday, February 15, 2018 Goal: Creating Rasters
Exercise 8 Mapping the Thickness of the Rocky Flats Alluvium and Reconstructing the Pleistocene Rocky Flats Paleogeography (with Spatial Analyst). Due: Thursday, February 15, 2018 Goal: Creating Rasters
STUDENT PAGES GIS Tutorial Treasure in the Treasure State
 STUDENT PAGES GIS Tutorial Treasure in the Treasure State Copyright 2015 Bear Trust International GIS Tutorial 1 Exercise 1: Make a Hand Drawn Map of the School Yard and Playground Your teacher will provide
Engineering Geology. Engineering Geology is backbone of civil engineering. Topographic Maps. Eng. Iqbal Marie
 Engineering Geology Engineering Geology is backbone of civil engineering Topographic Maps Eng. Iqbal Marie Maps: are a two dimensional representation, of an area or region. There are many types of maps,
The Volume and Extent of the Lake Created by the Bridge of the Gods, Colombia River
 Rachel Markoff 12/1/2011 GEO 327G/386G Term Project The Volume and Extent of the Lake Created by the Bridge of the Gods, Colombia River 1. Introduction The Bonneville Landslide occurred on the Colombia
Spatial Analysis Exercise GIS in Water Resources Fall 2012
 Spatial Analysis Exercise GIS in Water Resources Fall 2012 Prepared by David G. Tarboton and David R. Maidment Goal The goal of this exercise is to serve as an introduction to Spatial Analysis with ArcGIS.
Introduction to GIS A Journey Through Gale Crater
 Introduction to GIS A Journey Through Gale Crater In this lab you will be learning how to use ArcMap, one of the most common commercial software packages for GIS (Geographic Information System). Throughout
Import, view, edit, convert, and digitize triangulated irregular networks
 v. 10.1 WMS 10.1 Tutorial Import, view, edit, convert, and digitize triangulated irregular networks Objectives Import survey data in an XYZ format. Digitize elevation points using contour imagery. Edit
INTRODUCTION TO GIS WORKSHOP EXERCISE
 111 Mulford Hall, College of Natural Resources, UC Berkeley (510) 643-4539 INTRODUCTION TO GIS WORKSHOP EXERCISE This exercise is a survey of some GIS and spatial analysis tools for ecological and natural
Tricks and Tips of Creating a Layered, Geo-Enabled Adobe PDF Map
 Tricks and Tips of Creating a Layered, Geo-Enabled Adobe PDF Map John M. Bocan GIS Programmer/Analyst West Virginia Geological and Economic Survey (WVGES) Digital Mapping Techniques Williamsburg, VA. May
Lab 1: Landuse and Hydrology, learning ArcGIS
 Lab 1: Landuse and Hydrology, learning ArcGIS The following lab exercises are designed to give you experience using ArcMap in order to visualize and analyze datasets that are relevant to important geomorphological/
Delineating Watersheds from a Digital Elevation Model (DEM)
") Delineating Watersheds from a Digital Elevation Model (DEM) (Using example from the ESRI virtual campus found at http://training.esri.com/courses/natres/index.cfm?c=153) Download locations for additional
Delineating Watersheds from a Digital Elevation Model (DEM) (Using example from the ESRI virtual campus found at http://training.esri.com/courses/natres/index.cfm?c=153) Download locations for additional
Purpose: To explore the raster grid and vector map element concepts in GIS.
 GIS INTRODUCTION TO RASTER GRIDS AND VECTOR MAP ELEMENTS c:wou:nssi:vecrasex.wpd Purpose: To explore the raster grid and vector map element concepts in GIS. PART A. RASTER GRID NETWORKS Task A- Examine
Exercise # 6: Using the NHDPlus Raster Data Sets Last Updated 3/28/2006
 Exercise # 6: Using the NHDPlus Raster Data Sets Last Updated 3/28/2006 The NHDPlus includes several raster (grid) data sets. Several of these are primarily used in analytical processes that are beyond
DEM Artifacts: Layering or pancake effects
 Outcomes DEM Artifacts: Stream networks & watersheds derived using ArcGIS s HYDROLOGY routines are only as good as the DEMs used. - Both DEM examples below have problems - Lidar and SRTM DEM products are
Data Assembly, Part II. GIS Cyberinfrastructure Module Day 4
 Data Assembly, Part II GIS Cyberinfrastructure Module Day 4 Objectives Continuation of effective troubleshooting Create shapefiles for analysis with buffers, union, and dissolve functions Calculate polygon
Stream network delineation and scaling issues with high resolution data
 Stream network delineation and scaling issues with high resolution data Roman DiBiase, Arizona State University, May 1, 2008 Abstract: In this tutorial, we will go through the process of extracting a stream
RiparianZone = buffer( River, 100 Feet )
") GIS Analysts perform spatial analysis when they need to derive new data from existing data. In GIS I, for example, you used the vector approach to derive a riparian buffer feature (output polygon) around
GIS Analysts perform spatial analysis when they need to derive new data from existing data. In GIS I, for example, you used the vector approach to derive a riparian buffer feature (output polygon) around
Tools. (figure 3A) 3) Shaded Relief Derivative. c. HydroSHED DS DEM
 3) Shaded Relief Derivative. c. HydroSHED DS DEM") Topographic Modeling Tools Available Tools (figure 3A) 1) Dataa Extraction 2) Aspect Derivative 3) Shaded Relief Derivative 4) Color Shaded Relief 5) Slope Derivativee 6) Slope Classification Derivative
Topographic Modeling Tools Available Tools (figure 3A) 1) Dataa Extraction 2) Aspect Derivative 3) Shaded Relief Derivative 4) Color Shaded Relief 5) Slope Derivativee 6) Slope Classification Derivative
GEO 465/565 Lab 6: Modeling Landslide Susceptibility
 1 GEO 465/565 Lab 6: Modeling Landslide Susceptibility This lab will give you more practice in understanding and building a GIS analysis model. Recall from class lecture that a GIS analysis model is a
Raster: The Other GIS Data
 Raster_The_Other_GIS_Data.Docx Page 1 of 11 Raster: The Other GIS Data Objectives Understand the raster format and how it is used to model continuous geographic phenomena. Understand how projections &
Lab 9. Raster Analyses. Tomislav Sapic GIS Technologist Faculty of Natural Resources Management Lakehead University
 Lab 9 Raster Analyses Tomislav Sapic GIS Technologist Faculty of Natural Resources Management Lakehead University How to Interpolate Surface Turn on the Spatial Analyst extension: Tools > Extensions >
v SMS Tutorials Working with Rasters Prerequisites Requirements Time Objectives
 v. 12.2 SMS 12.2 Tutorial Objectives Learn how to import a Raster, view elevations at individual points, change display options for multiple views of the data, show the 2D profile plots, and interpolate
Using LIDAR to Design Embankments in ArcGIS. Written by Scott Ralston U.S. Fish & Wildlife Service Windom Wetland Management District
 Using LIDAR to Design Embankments in ArcGIS Written by Scott Ralston U.S. Fish & Wildlife Service Windom Wetland Management District This tutorial covers the basics of how to design a dike, embankment
NEXTMap World 30 Digital Surface Model
 NEXTMap World 30 Digital Surface Model Intermap Technologies, Inc. 8310 South Valley Highway, Suite 400 Englewood, CO 80112 083013v3 NEXTMap World 30 (top) provides an improvement in vertical accuracy
Creating a Custom DEM and Measuring Bathymetric Change for the Multnomah Channel & Willamette River Confluence
 Creating a Custom DEM and Measuring Bathymetric Change for the Multnomah Channel & Willamette River Confluence Meara Butler Josh Schane GEOG 593 Fall 2012 Multnomah Channel begins three miles upstream
Exercise 3: Spatial Analysis GIS in Water Resources Fall 2013
 Exercise 3: Spatial Analysis GIS in Water Resources Fall 2013 Prepared by David G. Tarboton and David R. Maidment Goal The goal of this exercise is to serve as an introduction to Spatial Analysis with
Channel Conditions in the Onion Creek Watershed. Integrating High Resolution Elevation Data in Flood Forecasting
 Channel Conditions in the Onion Creek Watershed Integrating High Resolution Elevation Data in Flood Forecasting Lukas Godbout GIS in Water Resources CE394K Fall 2016 Introduction Motivation Flooding is
GIS IN ECOLOGY: MORE RASTER ANALYSES
 GIS IN ECOLOGY: MORE RASTER ANALYSES Contents Introduction... 2 More Raster Application Functions... 2 Data Sources... 3 Tasks... 4 Raster Recap... 4 Viewshed Determining Visibility... 5 Hydrology Modeling
Improved Applications with SAMB Derived 3 meter DTMs
 Improved Applications with SAMB Derived 3 meter DTMs Evan J Fedorko West Virginia GIS Technical Center 20 April 2005 This report sums up the processes used to create several products from the Lorado 7
Raster GIS. Raster GIS 11/1/2015. The early years of GIS involved much debate on raster versus vector - advantages and disadvantages
 Raster GIS Google Earth image (raster) with roads overlain (vector) Raster GIS The early years of GIS involved much debate on raster versus vector - advantages and disadvantages 1 Feb 21, 2010 MODIS satellite
Live (2.5D) DEM Editing Geomatica 2015 Tutorial
 DEM Editing Geomatica 2015 Tutorial") Live (2.5D) DEM Editing Geomatica 2015 Tutorial The DEM Editing tool is a quick and easy tool created to smooth out irregularities and create a more accurate model, and in turn, generate more accurate
Live (2.5D) DEM Editing Geomatica 2015 Tutorial The DEM Editing tool is a quick and easy tool created to smooth out irregularities and create a more accurate model, and in turn, generate more accurate
THE HONG KONG POLYTECHNIC UNIVERSITY DEPARTMENT OF LAND SURVEYING & GEO-INFORMATICS LSGI521 PRINCIPLES OF GIS
 THE HONG KONG POLYTECHNIC UNIVERSITY DEPARTMENT OF LAND SURVEYING & GEO-INFORMATICS LSGI521 PRINCIPLES OF GIS Student name: Student ID: Table of Content Working with files, folders, various software and
Lab 10: Raster Analyses
 Lab 10: Raster Analyses What You ll Learn: Spatial analysis and modeling with raster data. You will estimate the access costs for all points on a landscape, based on slope and distance to roads. You ll
Geol 588. GIS for Geoscientists II. Zonal functions. Feb 22, Zonal statistics. Interpolation. Zonal statistics Sp. Analyst Tools - Zonal.
 Zonal functions Geol 588 GIS for Geoscientists II Feb 22, 2011 Zonal statistics Interpolation Zonal statistics Sp. Analyst Tools - Zonal Choose correct attribute for zones (usually: must be unique ID for
GISC9312- Geospatial Visualization
 GISC9312- Geospatial Visualization Assignment#D1 Ibeabuchi Nkemakolam April 17, 2013 Janet Finlay BA,.BSc. GIS-GM Program Professor Niagara College 135 Taylor Road Niagara-On-The-Lake, ON L0S 1J0 Dear
Vector Data Analysis Working with Topographic Data. Vector data analysis working with topographic data.
 Vector Data Analysis Working with Topographic Data Vector data analysis working with topographic data. 1 Triangulated Irregular Network Triangulated Irregular Network 2 Triangulated Irregular Networks
Dijkstra's Algorithm
 Shortest Path Algorithm Dijkstra's Algorithm To find the shortest path from the origin node to the destination node No matrix calculation Floyd s Algorithm To find all the shortest paths from the nodes
WMS 9.1 Tutorial Watershed Modeling DEM Delineation Learn how to delineate a watershed using the hydrologic modeling wizard
 v. 9.1 WMS 9.1 Tutorial Learn how to delineate a watershed using the hydrologic modeling wizard Objectives Read a digital elevation model, compute flow directions, and delineate a watershed and sub-basins
Workflows for Managing and Serving Elevation (and Lidar) Data. Cody Benkelman
 Data. Cody Benkelman") Workflows for Managing and Serving Elevation (and Lidar) Data Cody Benkelman Outline Usage Modes Data Management - Architecture - Workflow Automation for Repeatability & Scalability A few options re: Cloud,
Workflows for Managing and Serving Elevation (and Lidar) Data Cody Benkelman Outline Usage Modes Data Management - Architecture - Workflow Automation for Repeatability & Scalability A few options re: Cloud,
GIS IN ECOLOGY: VISUALIZING IN 3D
 GIS IN ECOLOGY: VISUALIZING IN 3D Contents Introduction... 2 3D Analyst and ArcScene... 2 3D Data... 2 Course Data Sources... 3 Instructions for Copying the Course Dataset... 4 Tasks... 4 Visualizing and
Files Used in this Tutorial
 Generate Point Clouds and DSM Tutorial This tutorial shows how to generate point clouds and a digital surface model (DSM) from IKONOS satellite stereo imagery. You will view the resulting point clouds
Creating Contours using ArcMap
 Creating Contours with ArcMap and ArcScene Digital elevation models (DEMs) are geospatial datasets that contain elevation values sampled according to a regularly spaced rectangular grid. They can be used