SYMBOLISATION. Generalisation: which / how many features we display.. Symbolisation: how to display them?
|
|
|
- Henry Harold Bell
- 6 years ago
- Views:
Transcription

1 Generalisation: which / how many features we display.. Symbolisation: how to display them? SYMBOLISATION General Goal: easy and effective communication based on design principles and common sense as much as rules

2 Symbolisation in Infographics

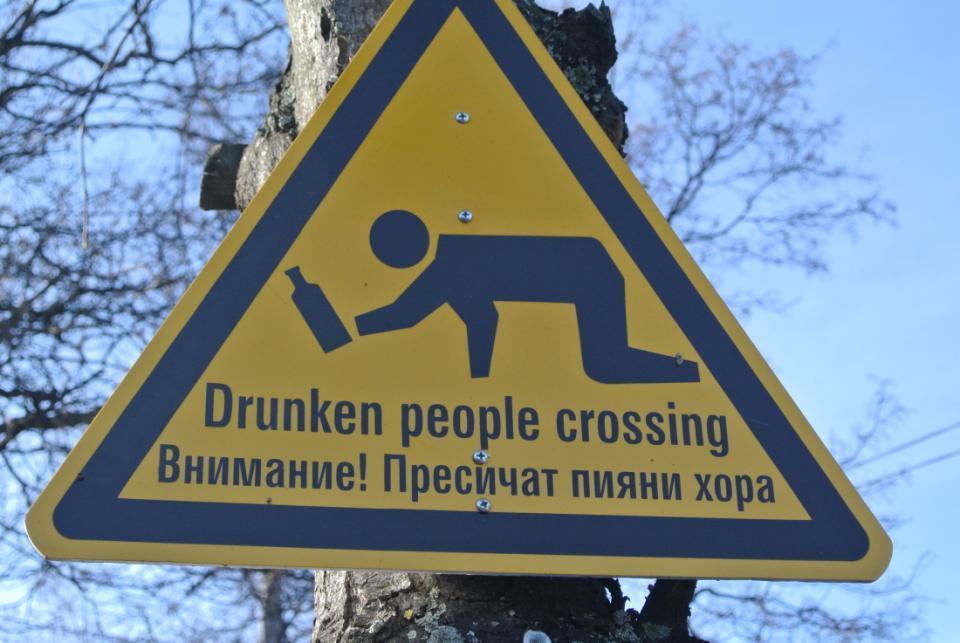
3 Symbolisation in Traffic Signs
4
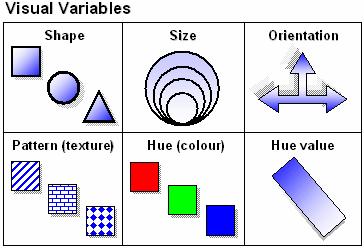
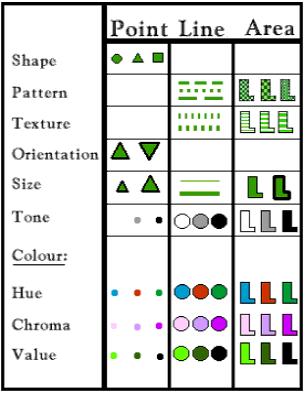
5 Visual Design Variables Shape: the detail or outline of a point Pattern: regular repetition of shapes Texture: variation of tones or lines Orientation: direction of symbol element Size: size of a point, or width of a line (or area boundary line) Tone: shades of gray (% black)
6
7 Visual Design Variables Colour: Has three 'dimensions' hue (wavelength): "the visual sensations from different wavelengths of light " e.g. red, blue chroma (saturation): saturation or intensity = tints, e.g. pale v solid blue value (intensity): purity or lightness = shades, e.g. blue v blue/black
8


 are")
9 The electro-magnetic colour spectrum the longest wavelengths of light (red) are the least refracted

10 Chroma / saturation and value / intensity
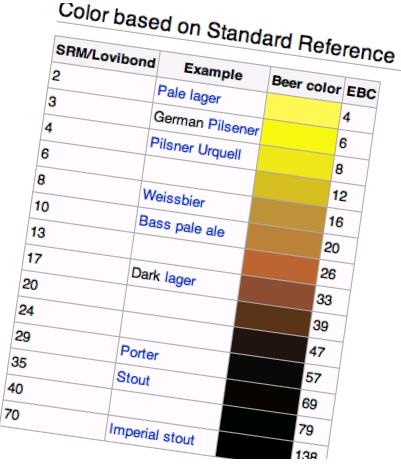
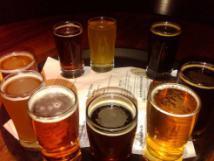
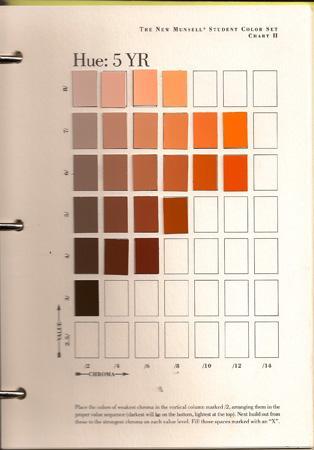
11 Munsell color chart (hue-saturation-intensity) for soils - and also used for beers Albert Munsell, Saturation ->

12 hue - basic colour we see, eg 12 step wheel value intensity lightness or darkness. Can be hard to perceive variations in value Chroma - saturation purity compared to a neutral gray
13 Design criteria: 1. Association Symbols should be 'associated' with their features, physically or by function Vegetation green Contours brown (except on ice ) Battlefield Winter sports Camping Railway line

14 Shape: Iconic and abstract symbols Iconic (pictorial) - Not too fancy Abstract (choice may depend on map purpose and space available)
15
16 Association Letters are not normally used except for: H Hospital P Parking i Information (why the 'lower case' 'i'?)
17 Association Points (ArcMap)
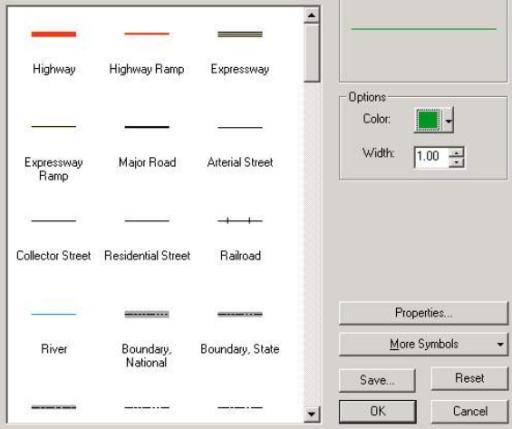
18 Association - Lines
19 Association - Lines 'permanent' physical features are shown as solid. e.g. rivers, roads Less certain features are shown in broken lines. e.g. intermittent streams, trails Administrative boundaries use a dot-dash pattern
20 Polygons / areas Colour or pattern fill? Outline colour? Both? Fill Transparency (0-100%)?
 Outline?")
21 Areas output design Fill colour, pattern Colours should be associative Avoid solid colours (except for small areas) Outline? colour, width - No polygon outline for uncertain boundaries

22 Areas - patterns Visual contrast Simple patterns if used Patterns may conflict with points * for small polygons use colours Avoid ugly tie stripes!
23 Polygons / areas Use of fill v outline v both depends on: meaning / significance of area edge Rivers and lakes: outline (+ colour fill) Park boundary: outline / no fill? Forest /vegetation: fill only (no outline) Size: small - fill (+outline) large - outline only

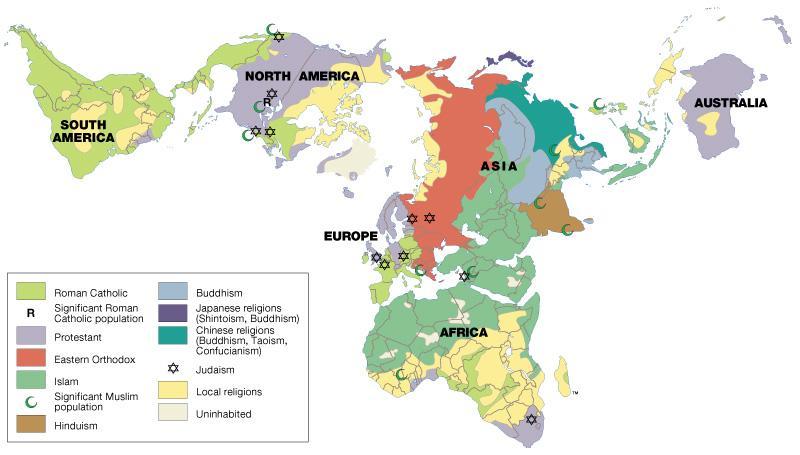
24 Example 1 Note: No polygon outlines for vegetation, outlines only for regions

25 Example 2: PGmap use of area transparency but outline only might be better Note: No polygon outlines for vegetation, outlines only for regions
 ; Blue water, calm, cool etc.. Red heat, danger, blood? Green vegetation, parks, recycling, envy?.. http://visual.")
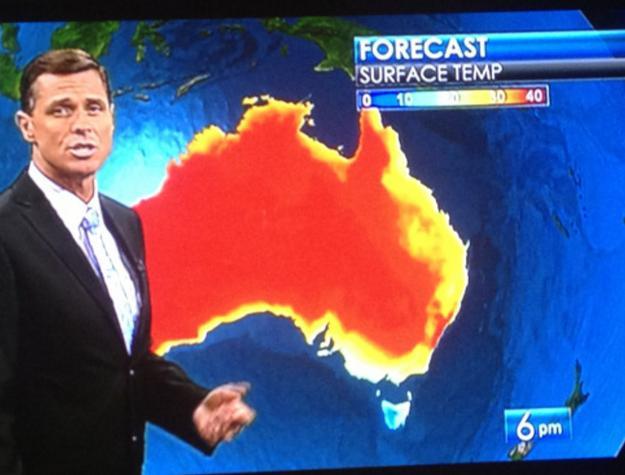
26 Design criteria: Colour association Colour associations: physical and psychological Yellow sun, bright (cheery..) ; Blue water, calm, cool etc.. Red heat, danger, blood? Green vegetation, parks, recycling, envy?..
27

28 Association size larger / more important features e.g. road width
29 Using visual variables ensure good contrast GIS software applies colours by attribute sometimes too many categories or values (group them) Example: Unsuccessful forest classification (primary species) colours: too many similar tints/shades of the same hue

30 1b. Conventional symbols e.g. topographic mapping based on association principles

31 Canada NTS conventions Green forest vegetation Red main roads Orange - minor roads Black buildings Urban pink (why pink?)

32 Venice, satellite image
33 2. Qualitative versus quantitative - data association Qualitative: [nominal / categorical] HUE *, shape, pattern e.g. soil types, schools versus churches * see upcoming slides Quantitative: [interval / ordinal] SIZE, tone, chroma, value e.g. population densities, city sizes

")
34 RED is reserved for importance due to its visual impact - as it has the longest wavelength and advances (blue retreats) ** Red implies importance: / danger (roads) Universal STOP sign


35 Yellow is next to red in the colour spectrum
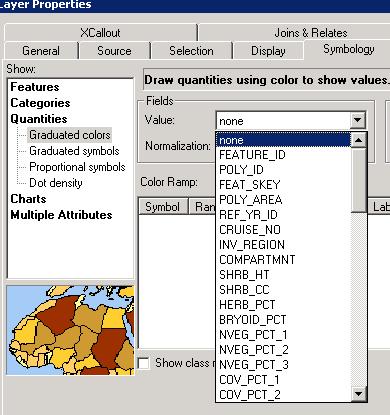
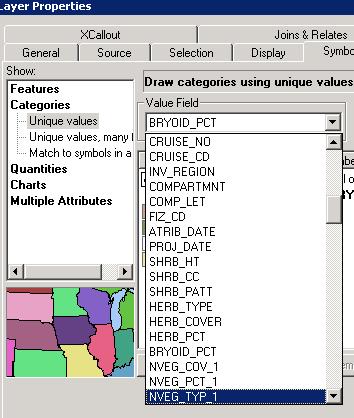
36 ArcMap categories v quantities menus
37 Qualitative (nominal/categorical) data

38 Quantitative (interval) data ->? Poor colour scheme

39 Colour ramp for quantitative data (good example)

40 Poor use of colours and size

41 3. Other factors: map purpose e.g. parks / road map what features are more important in each case

42 4. Other factors: cost and media Colour costs v Monochrome: - In this case, colour could be avoided if need be online no + cost photocopy 10x publication 1000x Don t always use colour, just because you can but in 2017, you usually can

43 More on colour. colour blindness. 7% of men and 1% of women
44 Summary on symbol design Symbols design variables: Qualitative shape, pattern, colour - hue (red?) Quantitative size, tone colour chroma / value Symbols use of design variables: 1. Association 2.Qualitative or quantitative data 3.Output purpose, cost and media Much of this is intuitive common sense..
SYMBOLISATION. Generalisation: which / how many features we display.. Symbolisation: how to display them?
 Generalisation: which / how many features we display.. Symbolisation: how to display them? SYMBOLISATION General Goal: easy and effective communication based on design principles and common sense as much
Lecture 2 Map design. Dr. Zhang Spring, 2017
 Lecture 2 Map design Dr. Zhang Spring, 2017 Model of the course Using and making maps Navigating GIS maps Map design Working with spatial data Geoprocessing Spatial data infrastructure Digitizing File
Key Terms. Symbology. Categorical attributes. Style. Layer file
 Key Terms Symbology Categorical attributes Style Layer file Review Questions POP-RANGE is a string field of the Cities feature class with the following entries: 0-9,999, 10,000-49,999, 50,000-99,000 This
Cartographic symbolization
 Symbology Cartographic symbolization Cartographic symbolization is based on a systematic approach for selecting the graphic symbols to use on a map Symbolization is the process of creating graphic symbols
Session 3: Cartography in ArcGIS. Mapping population data
 Exercise 3: Cartography in ArcGIS Mapping population data Background GIS is well known for its ability to produce high quality maps. ArcGIS provides useful tools that allow you to do this. It is important
Digital Elevation Models (DEM)
") Digital Elevation Models (DEM) Digital representation of the terrain surface also referred to as Digital Terrain Models (DTM) Digital Elevation Models (DEM) How has relief depiction changed with digital
Digital Elevation Models (DEM) Digital representation of the terrain surface also referred to as Digital Terrain Models (DTM) Digital Elevation Models (DEM) How has relief depiction changed with digital
Add to the ArcMap layout the Census dataset which are located in your Census folder.
 Building Your Map To begin building your map, open ArcMap. Add to the ArcMap layout the Census dataset which are located in your Census folder. Right Click on the Labour_Occupation_Education shapefile
Spell out your full name (first, middle and last)
") Spell out your full name (first, middle and last) Be ready to share the following counts: Number of letters in your full name. Number of vowels Number of consonants Section 2-1 Organizing Data After completing
Spell out your full name (first, middle and last) Be ready to share the following counts: Number of letters in your full name. Number of vowels Number of consonants Section 2-1 Organizing Data After completing
Geography 281 Map Making with GIS Project Three: Viewing Data Spatially
 Geography 281 Map Making with GIS Project Three: Viewing Data Spatially This activity introduces three of the most common thematic maps: Choropleth maps Dot density maps Graduated symbol maps You will
Approaches to Visual Mappings
 Approaches to Visual Mappings CMPT 467/767 Visualization Torsten Möller Weiskopf/Machiraju/Möller Overview Effectiveness of mappings Mapping to positional quantities Mapping to shape Mapping to color Mapping
Design Elements. Advanced Higher Graphic Presentation. Professional Graphic Presentations by kind permission of
 Design Elements Advanced Higher Graphic Presentation Professional Graphic Presentations by kind permission of Lines can Design Element:- Line Convey a mood or an emotion. Organise the design. Establish
Preview from Notesale.co.uk Page 2 of 61
 Modify a table Applying styles to tables; banding rows and columns; inserting total rows; removing styles from tables Filter and sort a table Filtering records; sorting data on multiple columns; changing
City of La Crosse Online Mapping Website Help Document
 City of La Crosse Online Mapping Website Help Document This document was created to assist in using the new City of La Crosse online mapping sites. When the website is first opened, a map showing the City
Getting Started with GIS using ArcGIS 10.6 What is GIS? and - Module 1 Creating a map document
 Getting Started with GIS using ArcGIS 10.6 What is GIS? and - Module 1 Creating a map document Marcel Fortin Map & Data Library mdl@library.utoronto.ca 2018 http://mdl.library.utoronto.ca This workshop
Chapter 9. Attribute joins
 Chapter 9 Spatial Joins 9-1 Copyright McGraw-Hill Education. Permission required for reproduction or display. Attribute joins Recall that Attribute joins: involve combining two attribute tables together
Texture Mapping. Images from 3D Creative Magazine
 Texture Mapping Images from 3D Creative Magazine Contents Introduction Definitions Light And Colour Surface Attributes Surface Attributes: Colour Surface Attributes: Shininess Surface Attributes: Specularity
Geography 222 Quantitative Color for GIS Mike Pesses, Antelope Valley College
 Geography 222 Quantitative Color for GIS Mike Pesses, Antelope Valley College Introduction Building off of the previous color theory work, a cartographer must also understand how to tell a story with data
GEOGRAPHIC INFORMATION SYSTEMS Lecture 18: Spatial Modeling
 Spatial Analysis in GIS (cont d) GEOGRAPHIC INFORMATION SYSTEMS Lecture 18: Spatial Modeling - the basic types of analysis that can be accomplished with a GIS are outlined in The Esri Guide to GIS Analysis
Making Topographic Maps
 T O P O Applications N Making Topographic Maps M A P S Making Topographic Maps with TNTmips page 1 Before Getting Started TNTmips provides a variety of tools for working with map data and making topographic
Creating a Data Dictionary in GPS Pathfinder Office
 Overview Data dictionaries define the types of features that you can collect in the field. The types of features are point, line, and polygon. Attributes are the information about the feature that need
Alaska Department of Transportation Roads to Resources Project LiDAR & Imagery Quality Assurance Report Juneau Access South Corridor
 Alaska Department of Transportation Roads to Resources Project LiDAR & Imagery Quality Assurance Report Juneau Access South Corridor Written by Rick Guritz Alaska Satellite Facility Nov. 24, 2015 Contents
Step by Step GIS. Section 1
 Step by Step GIS Section 1 Contact the web page given below for the data required to do the exercises (http://www.pasda.psu.edu/default.asp) Before beginning the tutorials please visit the Preparation
GIS Data Models. 4/9/ GIS Data Models
 GIS Data Models 1 Conceptual models of the real world The real world can be described using two conceptually different models: 1. As discrete objects, possible to represent as points, lines or polygons.
Colour Reading: Chapter 6. Black body radiators
 Colour Reading: Chapter 6 Light is produced in different amounts at different wavelengths by each light source Light is differentially reflected at each wavelength, which gives objects their natural colours
Draft FPC Hatchery Release Data Mapping Application
 Draft FPC Hatchery Release Data Mapping Application 1 Table of Contents To open the Hatchery Release Data Mapping Query 4 Quick Reference Instructions to Search for Hatchery Release Data 5 Notes about
1. Start ArcMap by going to the Start menu > All Programs > ArcGIS > ArcMap.
 Learning ArcGIS: Introduction to ArcMap 10.1 The Map Document Feature Manipulation Navigating ArcMap Map Documents, Layers, and Features Shapes, Location, and Attribute Data Symbology Zoom, Pan and Map
CS 445 HW#6 Solutions
 CS 445 HW#6 Solutions Text problem 6.1 From the figure, x = 0.43 and y = 0.4. Since x + y + z = 1, it follows that z = 0.17. These are the trichromatic coefficients. We are interested in tristimulus values
Geographical Information Systems Institute. Center for Geographic Analysis, Harvard University. LAB EXERCISE 1: Basic Mapping in ArcMap
 Harvard University Introduction to ArcMap Geographical Information Systems Institute Center for Geographic Analysis, Harvard University LAB EXERCISE 1: Basic Mapping in ArcMap Individual files (lab instructions,
Graphic Design Starter Pack
 Graphic Design Starter Pack Graphic Design Contact Us// E-mail: graphic.design@shawacademy.com www.shawacademy.com Hello This Starter Pack aims to give you a better understanding of what Graphic Design
2.1: Frequency Distributions
 2.1: Frequency Distributions Frequency Distribution: organization of data into groups called. A: Categorical Frequency Distribution used for and level qualitative data that can be put into categories.
Map Preparation. Using QGIS
 Map Preparation Using QGIS Tutorial ID: IGET_GIS_006 This tutorial has been developed by BVIEER as part of the IGET web portal intended to provide easy access to geospatial education. This tutorial is
Class VIII Chapter 10 Visualising Solid Shapes Maths
 Exercise 10.1 Question 1: For each of the given solid, the two views are given. Match for each solid the corresponding top and front views. The given solids, matched to their respective side view and top
(Refer Slide Time: 0:51)
") Introduction to Remote Sensing Dr. Arun K Saraf Department of Earth Sciences Indian Institute of Technology Roorkee Lecture 16 Image Classification Techniques Hello everyone welcome to 16th lecture in
Introduction to Remote Sensing Dr. Arun K Saraf Department of Earth Sciences Indian Institute of Technology Roorkee Lecture 16 Image Classification Techniques Hello everyone welcome to 16th lecture in
From Data to Map in 30 Minutes. Aileen Buckley, PhD
 From Data to Map in 30 Minutes Aileen Buckley, PhD This session Crater Lake online map From NPS: https://www.nps.gov/carto/hfc/carto/media/crlamap1.pdf Download Crater Lake map packages here: ArcGIS Pro
Geography 281 Map Making with GIS Project Two: Map Design Issues in ArcMap
 Geography 281 Map Making with GIS Project Two: Map Design Issues in ArcMap This activity provides an introduction to the map design process. It takes you through a typical sequence from the initial decision
Beautifying GIS: A Refresher on Cartography. Christopher Morgan
 Beautifying GIS: A Refresher on Cartography Christopher Morgan Outline Message Audience Medium THEN Labels Symbology Colors Visual Hierarchy Your Message Reflect on what you re trying to convey Consider
L2 VoterMapping - Display Options
 L2 VoterMapping - Display Options In L2 VoterMapping, there are six ways to control the display of voter data and each can provide you with valuable information for visual analysis: Map Type, Boundaries,
Modern Tools for NTDs Control Programmes
 Modern Tools for NTDs Control Programmes www.thiswormyworld.org Practical 1 Becoming familiar with QGIS interface and GIS features www.thiswormyworld.org 2 Aim of practical This first practical aims to
Introduction to the Google Earth Engine Workshop
 Introduction to the Google Earth Engine Workshop This workshop will introduce the user to the Graphical User Interface (GUI) version of the Google Earth Engine. It assumes the user has a basic understanding
InfoVis: a semiotic perspective
 InfoVis: a semiotic perspective p based on Semiology of Graphics by J. Bertin Infovis is composed of Representation a mapping from raw data to a visible representation Presentation organizing this visible
C101-E137 TALK LETTER. Vol. 14
 C101-E137 TALK LETTER Vol. 14 Diffuse Reflectance Measurement of Powder Samples and Kubelka-Munk Transformation ------- 02 Application: Measuring Food Color ------- 08 Q&A: What effect does the scan speed
Work with Shapes. Concepts CHAPTER. Concepts, page 3-1 Procedures, page 3-5
 3 CHAPTER Revised: November 15, 2011 Concepts, page 3-1, page 3-5 Concepts The Shapes Tool is Versatile, page 3-2 Guidelines for Shapes, page 3-2 Visual Density Transparent, Translucent, or Opaque?, page
Visual Representation from Semiology of Graphics by J. Bertin
 Visual Representation from Semiology of Graphics by J. Bertin From a communication perspective Communication is too often taken for granted when it should be taken to pieces. (Fiske 91) Two basic schools
DIGITAL IMAGE ANALYSIS. Image Classification: Object-based Classification
 DIGITAL IMAGE ANALYSIS Image Classification: Object-based Classification Image classification Quantitative analysis used to automate the identification of features Spectral pattern recognition Unsupervised
Aardobservatie en Data-analyse Image processing
 Aardobservatie en Data-analyse Image processing 1 Image processing: Processing of digital images aiming at: - image correction (geometry, dropped lines, etc) - image calibration: DN into radiance or into
4. Basic Mapping Techniques
 4. Basic Mapping Techniques Mapping from (filtered) data to renderable representation Most important part of visualization Possible visual representations: Position Size Orientation Shape Brightness Color
Welcome to NR402 GIS Applications in Natural Resources. This course consists of 9 lessons, including Power point presentations, demonstrations,
 Welcome to NR402 GIS Applications in Natural Resources. This course consists of 9 lessons, including Power point presentations, demonstrations, readings, and hands on GIS lab exercises. Following the last
Attribute Accuracy. Quantitative accuracy refers to the level of bias in estimating the values assigned such as estimated values of ph in a soil map.
 Attribute Accuracy Objectives (Entry) This basic concept of attribute accuracy has been introduced in the unit of quality and coverage. This unit will teach a basic technique to quantify the attribute
Slide 1. Advanced Cartography in ArcGIS. Robert Jensen Edie Punt. Technical Workshops
 Slide 1 Technical Workshops Advanced Cartography in ArcGIS Robert Jensen Edie Punt Slide 2 Overview Using representations to manage symbology Solving graphic conflicts Geoprocessing for cartography in
Example Videos. Administrative 1/28/2014. UNC-CH Comp/Phys/Apsc 715. Vis 2006: ritter.avi. Vis2006: krueger.avi
 UNC-CH Comp/Phys/Apsc 715 2D Scalar: Color, Contour, Height Fields, (Glyphs), Textures, and Transparency 2D Visualization Comp/Phys/Apsc 715 Taylor 1 Example Videos Vis 2006: ritter.avi Displaying vascular
Example Videos. Administrative 1/26/2012. UNC-CH Comp/Phys/Mtsc 715. Vis 2006: ritter.avi. Vis2006: krueger.avi. Vis2011: Palke: ttg s.
 UNC-CH Comp/Phys/Mtsc 715 2D Scalar: Color, Contour, Height Fields, (Glyphs), Textures, and Transparency 2D Visualization Comp/Phys/Mtsc 715 Taylor 1 Example Videos Vis 2006: ritter.avi Displaying vascular
User Interface Design Principles
 User Interface Design Principles CS 470 User Interface Design At first we ll focus on website design, but most of the same concepts apply to standalone applications too What makes a good web site? Similar
I. An Intro to ArcMap Version 9.3 and 10. 1) Arc Map is basically a build your own Google map
 Arc Map is basically a build your own Google map") I. An Intro to ArcMap Version 9.3 and 10 What is Arc Map? 1) Arc Map is basically a build your own Google map a. Display and manage geo-spatial data (maps, images, points that have a geographic location)
I. An Intro to ArcMap Version 9.3 and 10 What is Arc Map? 1) Arc Map is basically a build your own Google map a. Display and manage geo-spatial data (maps, images, points that have a geographic location)
Purpose: To explore the raster grid and vector map element concepts in GIS.
 GIS INTRODUCTION TO RASTER GRIDS AND VECTOR MAP ELEMENTS c:wou:nssi:vecrasex.wpd Purpose: To explore the raster grid and vector map element concepts in GIS. PART A. RASTER GRID NETWORKS Task A- Examine
Using Spatial Data in a Desktop GIS; QGIS 2.8 Practical 2
 Using Spatial Data in a Desktop GIS; QGIS 2.8 Practical 2 Practical 2 Learning objectives: To work with a vector base map within a GIS and overlay point data. To practise using Ordnance Survey mapping
Adding Art to Office Documents
 Adding Art to Office Documents Introduction What You ll Do Although well-illustrated documents can t make up for a lack Locate and Insert an Online Picture of content, you can capture your audiences attention
Exercise 6: Symbolizing your data
 The Scenario After your presentation of the school age students in the county based on the results of your map created in the previous exercise, the county would like to see all of the major schools also
Neighbourhood Operations Specific Theory
 Neighbourhood Operations Specific Theory Neighbourhood operations are a method of analysing data in a GIS environment. They are especially important when a situation requires the analysis of relationships
Aerial photography: Principles. Visual interpretation of aerial imagery
 Aerial photography: Principles Visual interpretation of aerial imagery Overview Introduction Benefits of aerial imagery Image interpretation Elements Tasks Strategies Keys Accuracy assessment Benefits
MODULE 1 BASIC LIDAR TECHNIQUES
 MODULE SCENARIO One of the first tasks a geographic information systems (GIS) department using lidar data should perform is to check the quality of the data delivered by the data provider. The department
Geography 281 Map Making with GIS Project Six: Labeling Map Features
 Geography 281 Map Making with GIS Project Six: Labeling Map Features In this activity, you will explore techniques for adding text to maps. As discussed in lecture, there are two aspects to using text
Class #2. Data Models: maps as models of reality, geographical and attribute measurement & vector and raster (and other) data structures
 data structures") Class #2 Data Models: maps as models of reality, geographical and attribute measurement & vector and raster (and other) data structures Role of a Data Model Levels of Data Model Abstraction GIS as Digital
Class #2 Data Models: maps as models of reality, geographical and attribute measurement & vector and raster (and other) data structures Role of a Data Model Levels of Data Model Abstraction GIS as Digital
Lecture 11. Color. UW CSE vision faculty
 Lecture 11 Color UW CSE vision faculty Starting Point: What is light? Electromagnetic radiation (EMR) moving along rays in space R(λ) is EMR, measured in units of power (watts) λ is wavelength Perceiving
INTEGRATION OF TREE DATABASE DERIVED FROM SATELLITE IMAGERY AND LIDAR POINT CLOUD DATA
 INTEGRATION OF TREE DATABASE DERIVED FROM SATELLITE IMAGERY AND LIDAR POINT CLOUD DATA S. C. Liew 1, X. Huang 1, E. S. Lin 2, C. Shi 1, A. T. K. Yee 2, A. Tandon 2 1 Centre for Remote Imaging, Sensing
NOTES TO CONSIDER BEFORE ATTEMPTING EX 1A TYPES OF DATA
 NOTES TO CONSIDER BEFORE ATTEMPTING EX 1A TYPES OF DATA Statistics is concerned with scientific methods of collecting, recording, organising, summarising, presenting and analysing data from which future
Surpac Google Earth Tools
 Surpac Google Earth Tools Google Earth is a free software program that lets you fly anywhere on Earth to view satellite imagery, maps, terrain and 3D buildings. When used in conjunction with SURPAC, it
C L A S S 2 T Y P O G R A P H Y. FOUNDATIONS OF GRAPHIC DESIGN MW 8 a.m.
 C L A S S 2 T Y P O G R A P H Y FOUNDATIONS OF GRAPHIC DESIGN MW 8 a.m. Typography Typography separates graphic design from visual art. In every piece of type you see, somebody has considered how the letters,
Color and Shading. Color. Shapiro and Stockman, Chapter 6. Color and Machine Vision. Color and Perception
 Color and Shading Color Shapiro and Stockman, Chapter 6 Color is an important factor for for human perception for object and material identification, even time of day. Color perception depends upon both
CS635 Spring Department of Computer Science Purdue University
 Color and Perception CS635 Spring 2010 Daniel G Aliaga Daniel G. Aliaga Department of Computer Science Purdue University Elements of Color Perception 2 Elements of Color Physics: Illumination Electromagnetic
Rare Event Detection Algorithm. User s Guide
 Rare Event Detection Algorithm User s Guide Copyright 2008 Aperio Technologies, Inc. Part Number/Revision: MAN 0123, Revision A Date: September 2, 2008 This document applies to software versions Release
Using ArcGIS 9.x: Quickstart Tutorial
 Centre de recherche géographique Walter Hitschfeld Geographic Information Centre Using ArcGIS 9.x: Quickstart Tutorial ArcGIS is a program which allows the user to view and manipulate spatial data. It
The Reference Library Generating Low Confidence Polygons
 GeoCue Support Team In the new ASPRS Positional Accuracy Standards for Digital Geospatial Data, low confidence areas within LIDAR data are defined to be where the bare earth model might not meet the overall
Color Issues for Accessible Game Development
 Color Issues for Accessible Game Development This document is intended to provide guidance for the proper use of color in the development of accessible games. The information herein has been abridged from
STUDENT PAGES GIS Tutorial Treasure in the Treasure State
 STUDENT PAGES GIS Tutorial Treasure in the Treasure State Copyright 2015 Bear Trust International GIS Tutorial 1 Exercise 1: Make a Hand Drawn Map of the School Yard and Playground Your teacher will provide
Visual Perception. Basics
 Visual Perception Basics Please refer to Colin Ware s s Book Some materials are from Profs. Colin Ware, University of New Hampshire Klaus Mueller, SUNY Stony Brook Jürgen Döllner, University of Potsdam
After completing each task, be sure to save the file in the My Documents folder on your computer using the suggested name.
 PowerPoint Basic PPT2K13B Final Assignment This is the final assignment for the PowerPoint Basic course. Before attempting to complete this evaluation, you should have completed all Lessons Presentations,
EnvSci360 Computer and Analytical Cartography
 EnvSci360 Computer and Analytical Cartography Lecture 5 Working with Type and Labels Key Points Labels are text that locate and identify features on a map Important for readability & communication EnvSci
Reading. 2. Color. Emission spectra. The radiant energy spectrum. Watt, Chapter 15.
 Reading Watt, Chapter 15. Brian Wandell. Foundations of Vision. Chapter 4. Sinauer Associates, Sunderland, MA, pp. 69-97, 1995. 2. Color 1 2 The radiant energy spectrum We can think of light as waves,
Project 2 Logos. Project overview. Project objectives. Timing: 4 to 7 hours
 Project 2 Logos Timing: 4 to 7 hours Project overview Logos can evoke immediate associations with companies or specific products. Organizations and corporations use logos to identify themselves and set
Digital Elevation Models (DEMs)
") Digital Elevation Models (DEM) - Terrain Models (DTM) How has relief depiction on maps and online changed with digital mapping/ GIS?.. Perhaps more than the other map elements / layers Digital Elevation
Digital Elevation Models (DEM) - Terrain Models (DTM) How has relief depiction on maps and online changed with digital mapping/ GIS?.. Perhaps more than the other map elements / layers Digital Elevation
GIS Virtual Workshop: Buffering
 This workshop will teach the different methods of buffering data. They will include: Basic buffering of data Merging buffering zones Clipping the buffer Concentric rings around the object You will find
Full Search Map Tab Overview
 FlexMLS Map Server Full Search Map Tab Overview The Full Search Map tab is a need to know module. It is accessible when you use Full Search under Search in the Main Menu tree of FlexMLS. This map can
fraction of Nyquist
 differentiator 4 2.1.2.3.4.5.6.7.8.9 1 1 1/integrator 5.1.2.3.4.5.6.7.8.9 1 1 gain.5.1.2.3.4.5.6.7.8.9 1 fraction of Nyquist Figure 1. (top) Transfer functions of differential operators (dotted ideal derivative,
Frequency Distributions
 Displaying Data Frequency Distributions After collecting data, the first task for a researcher is to organize and summarize the data so that it is possible to get a general overview of the results. Remember,
Find Closed Lines. Put an on the lines that are not closed. Circle the closed lines. Who wins:,, or nobody?
 Find Closed Lines Put an on the lines that are not closed. Circle the closed lines. Who wins:,, or nobody? Blackline Master Geometry Teacher s Guide for Workbook 2.1 1 Crossword Polygons Fill in the names
How to Make a Poster Using PowerPoint
 How to Make a Poster Using PowerPoint 1997 2010 Start PowerPoint: Make a New presentation a blank one. When asked for a Layout, choose a blank one one without anything even a title. Choose the Size of
Lecture 12 Color model and color image processing
 Lecture 12 Color model and color image processing Color fundamentals Color models Pseudo color image Full color image processing Color fundamental The color that humans perceived in an object are determined
TDWI strives to provide course books that are contentrich and that serve as useful reference documents after a class has ended.
 Previews of TDWI course books offer an opportunity to see the quality of our material and help you to select the courses that best fit your needs. The previews cannot be printed. TDWI strives to provide
Chpt 2. Frequency Distributions and Graphs. 2-4 Pareto chart, time series graph, Pie chart / 35
 Chpt 2 Frequency Distributions and Graphs 2-4 Pareto chart, time series graph, Pie chart 1 Chpt 2 2-4 Read pages 63-77 p76 Applying the Concepts p77 1, 7, 9, 11, 13, 14, 15 Homework 2 Chpt 2 Objectives
Step 10 Visualisation Carlos Moura
 Step 10 Visualisation Carlos Moura COIN 2017-15th JRC Annual Training on Composite Indicators & Scoreboards 06-08/11/2017, Ispra (IT) Effective communication through visualization Why investing on visual
This is a sample of what you get after it is processed. The yellow colors in this view come from the Classify Vegetation Height.tif background map.
 This is a sample of what you get after it is processed. The yellow colors in this view come from the Classify Vegetation Height.tif background map. Yellow indicates places where the first and second return
Frame based kernel methods for hyperspectral imagery data
 Frame based kernel methods for hyperspectral imagery data Norbert Wiener Center Department of Mathematics University of Maryland, College Park Recent Advances in Harmonic Analysis and Elliptic Partial
Digital Image Processing COSC 6380/4393. Lecture 19 Mar 26 th, 2019 Pranav Mantini
 Digital Image Processing COSC 6380/4393 Lecture 19 Mar 26 th, 2019 Pranav Mantini What is color? Color is a psychological property of our visual experiences when we look at objects and lights, not a physical
6 COLOR AND PAINTING. Lesson overview
 6 COLOR AND PAINTING Lesson overview In this lesson, you ll learn how to do the following: Use color modes and color controls. Create, edit, and paint with colors using the Control panel and shortcuts.
The Display pipeline. The fast forward version. The Display Pipeline The order may vary somewhat. The Graphics Pipeline. To draw images.
 View volume The fast forward version The Display pipeline Computer Graphics 1, Fall 2004 Lecture 3 Chapter 1.4, 1.8, 2.5, 8.2, 8.13 Lightsource Hidden surface 3D Projection View plane 2D Rasterization
Data Assembling Topics:
 Topics: 1. GPX to Shape file 2. Data conversion with FME 3. Create a polygon feature 4. Merging /Appending data into a new dataset 5. Reproject data from one coordinate system to another 6. Data clipping
Exercise 1: Introduction to MapInfo
 Geog 578 Exercise 1: Introduction to MapInfo Page: 1/22 Geog 578: GIS Applications Exercise 1: Introduction to MapInfo Assigned on January 25 th, 2006 Due on February 1 st, 2006 Total Points: 10 0. Convention
CS 111: Digital Image Processing Fall 2016 Midterm Exam: Nov 23, Pledge: I neither received nor gave any help from or to anyone in this exam.
 CS 111: Digital Image Processing Fall 2016 Midterm Exam: Nov 23, 2016 Time: 3:30pm-4:50pm Total Points: 80 points Name: Number: Pledge: I neither received nor gave any help from or to anyone in this exam.
Operations. What Do I Need? Scan Filter
 Smooth Anomalous Values in a DEM Reduce Noise and Speckling in a Satellite Image Smooth Anomalous Values in Ordinal Data (Nearest Neighbour Interpolation) Smooth Anomalous Values in Nominal Data (Nearest
HBS Training - IT Solutions. PlanWeb. Intermediate
 HBS Training - IT Solutions PlanWeb Intermediate CONTENTS Logging on to the system...3 The PlanWeb Window...5 The Tool Bar...6 The Status Bar...6 The Map Window...6 The Information Window...7 Changing