C a t p h a n 604 M a n u a l
|
|
|
- Morgan Sharp
- 6 years ago
- Views:
Transcription
1 T h e P h a n t o m L a b o r a t o r y 1 C a t p h a n 604 M a n u a l Copyright 2015 WARRANTY THE PHANTOM LABORATORY INCORPORATED ( Seller ) warrants that this product shall remain in good working order and free of all material defects for a period of one (1) year following the date of purchase. If, prior to the expiration of the one (1) year warranty period, the product becomes defective, Buyer shall return the product to the Seller at: By Truck By Mail The Phantom Laboratory, Incorporated The Phantom Laboratory, Incorporated 2727 State Route 29 PO Box 511 Greenwich, NY12834 Salem, NY Seller shall, at Seller s sole option, repair or replace the defective product. The Warranty does not cover damage to the product resulting from accident or misuse. IF THE PRODUCT IS NOT IN GOOD WORKING ORDER AS WARRANTED, THE SOLE AND EXCLUSIVE REMEDY SHALL BE REPAIR OR REPLACEMENT, AT SELLER S OPTION. IN NO EVENT SHALL SELLER BE LIABLE FOR ANY DAMAGES IN EXCESS OF THE PURCHASE PRICE OF THE PRODUCT. THIS LIMITATION APPLIES TO DAMAGES OF ANY KIND, INCLUDING, BUT NOT LIMITED TO, DIRECT OR INDIRECT DAMAGES, LOST PROFITS, OR OTHER SPECIAL, INCIDENTAL, OR CONSEQUENTIAL DAMAGES, WHETHER FOR BREACH OF CONTRACT, TORT OR OTHERWISE, OR WHETHER ARISING OUT OF THE USE OF OR INABILITY TO USE THE PRODUCT. ALL OTHER EXPRESS OR IMPLIED WARRANTIES, INCLUDING, BUT NOT LIMITED TO, THE IMPLIED WARRANTY OF MERCHANT ABILITY AND FITNESS FOR PARTICULAR PURPOSE, ARE HEREBY DISCLAIMED. WARNING This product has an FH3-4 mm/min flame rating and is considered to be flammable. It is advised not to expose this product to open flame or high temperature (over 125 Celsius or 250 Fahrenheit) heating elements. 9//23/15 CTP604
2 2
3 T h e P h a n t o m L a b o r a t o r y 3 Catphan 604 Manual Contents Warranty 1 Introduction 5 Comparison of Catphan 604 to Catphan 504 models 6 Initial phantom positioning 7 Illustration of Catphan 604 model 8 Phantom position verification 9 Scan section 2: Slice width, sensitometry, pixel size and MTF 10 Patient alignment system check 11 Scan slice geometry (slice width) 12 Scan incrementation 13 Circular symmetry 14 Spatial linearity of pixel size verification 14 CT or Hounsfield Numbers by David Goodenough, Ph.D. 15 Sensitometry (CT number linearity) 16 Point spread function and MTF from bead and wire point sources 18 Use of automated scanner MTF programs 19 5 angled 50μ diameter tungsten MTF wire 20 Bead point source for slice sensitivity profile 22 Scan section 1: High resolution with 1 to 15 line pair per cm gauge 23 Scan section 3: CTP730 Low contrast module 24 Scan section 4: Image uniformity section 26 Optional phantom annuli 28 Dose Phantoms 29 Sample quality assurance program 30 Automated computer analysis program 31 Bibliography 32
4 4
5 Introduction 5 The Catphan 604 phantom configuration has been selected by Varian Medical Systems. This manual is intended to supplement the Varian CBCT Procedures and Manuals by offering additional details regarding the use of the Catphan 604 phantom. The Phantom Laboratory and physicist David J. Goodenough, Ph.D., are continually developing and researching new tests and modifications for the Catphan phantoms. The test objects that make up the current Catphan models embody more than a quarter century of scientific evaluation and field experience. This manual outlines the applications of each module contained in the Catphan 604 phantom. We do not make specific recommendations on the content of your quality assurance program, because each medical imaging facility has its own unique set of requirements. A sample program is provided to give you ideas for possible program content. We suggest a review of local governing regulations, manufacturers specifications and the needs of your radiologists and physicists before developing your CT quality assurance program. If you would like a pdf version of this manual it can be downloaded from our website: phantomlab.com If you have any additional questions please contact The Phantom Laboratory at: Phone: or Fax: sales@phantomlab.com Additional product information is available at:

6 6 Comparison of Catphan 604 to Catphan 504 models This manual is to be used with the Catphan 604 phantom. If you are working with a Catphan 504 phantom you should use the Catphan 504 manual. Both of these manuals are available from our website: phantomlab.com The Catphan 604 and Catphan 504 have many similarities, however they are manufactured using some different approaches and there are some differences in test objects. Tests Catphan 504 Catphan 604 Slice geometry 23 wire ramps 23 wire ramps Alignment light Exterior alignment dots Exterior alignment dots verification require offset relate to wire ramps Sensitometry 7 materials including air 9 materials including 2 calcium bone formulations and air Pixel verification X and Y targets 5cm spacing X and Y targets 5cm spacing High resolution test 1-21 line pair gauge and 1-15 line pair gauge,.28mm MTF bead.18mm MTF bead and.05mm steel MTF wire Low contrast 1%, 0.5% and 0.3% contrast 1%, 0.5% and 0.3% contrast targets and 1% sub-slice targets targets Uniformity Solid cast 15cm diameter Solid cast 20cm diameter
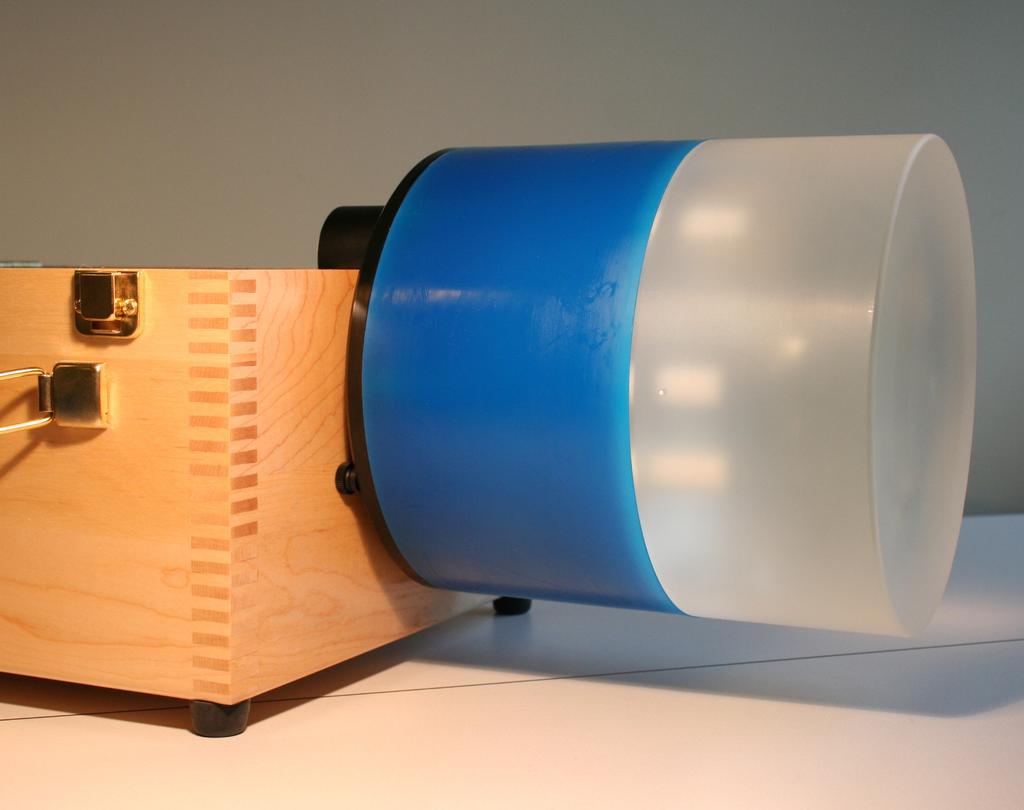
7 Initial phantom positioning 7 The Catphan phantom is positioned in the CT scanner by mounting it on the case. Place the phantom case on the gantry end of the table with the box hinges away from the gantry. It is best to place the box directly on the table and not on the table pads. Open the box, rotating the lid back 180. CAUTION: if you are using an annulus, additional weight will need to be placed in the box to counterweigh the phantom. The patient straps can be used for additional stability. See the Optional phantom annuli section of this manual for additional information. Remove the phantom from the box and hang the Catphan from the gantry end of the box. Make sure the box is stable with the weight of the phantom and is adequately counterweighed to prevent tipping. Use the level and adjusting thumb screws to level the Catphan. Once the phantom is level, slide the phantom along the end of the box to align the section center dots on the top of the phantom with the x axis alignment light. Use the table height and indexing drives to center the phantom on the first center dot and lateral height dots. From here you can drive the table into the gantry to position the phantom for the different test modules. See the next page for module location information. The z axis scan alignment position can be selected from the localizer scan, by centering the slice at the intersection of the crossed wire image created by the slice width ramps. Scan Section 2 to check the image for proper alignment as illustrated in the Phantom position verification section.

8 8 Illustration of Catphan 604 model Incremental scan section positioning The Catphan 604 phantom is designed so all test sections can be located by precisely indexing the table from the center of scan section 2 to the center of the other test sections and low contrast module. The indexing distances from the center of scan section 2 are listed below. Phantom position and alignment verification is described on the next page. Catphan 604 test module locations: Module Distance from the center of scan section 2 Scan section 1, 15 line pair high resolution section -40mm Scan section 3 CTP730, Low contrast module 40mm Scan section 4, Solid image uniformity section 80mm
9 Phantom position verification 9 By evaluating an image of scan section 2, the phantom s position and alignment can be verified. This section contains 4 wire ramps which rise at 23 angles from the base to the top of the module. The schematic sketches below indicate how the ramp images change if the scan center is above or below the z axis center of the test module. The use of the scanner s grid image function may assist in evaluation of phantom position. If misalignment is indicated by the scan image, the phantom should be repositioned to obtain proper alignment and then rescanned. If the images of the repositioned phantom duplicate the original misalignment indications, the scanner s alignment lights may require adjustment (contact your local service engineer). Once correct alignment has been established, you can proceed with the tests.
10 10 Scan section 2 with slice width, sensitometry, pixel size, MTF bead, and angled wire point source
11 Patient alignment system check 11 The laser, optical, and mechanical patient alignment system can be checked for accuracy. Align the white dots on the phantoms scan section 2, with the alignment lights as discussed in Initial phantom positioning. The scanned image should show good alignment as discussed in Phantom position verification. For measuring the z axis alignment accuracy, measure from the center of the ramp image to the part of the ramp which aligns with the center of the phantom and sensitometry samples. Multiply the distance A by 0.42 to determine the z axis alignment light accuracy. To evaluate x and y accuracy, measure from the center of the phantom to the center of the scan field by use of the grid function or knowledge of the central pixel location. The accuracy of the localizer, pilot or scout view can be checked. To check this function perform a localization scan of the phantom. Align an axial scan at the crossing point of the wire ramps. Scan this axial cut and check the misalignment as discussed above.
12 12 Scan slice geometry (slice width) Scan section 2 has two pairs of 23 wire ramps: one pair is oriented parallel to the x axis; the other pair to the y axis. These wire ramps are used to estimate slice width measurements and misalignment errors as previously discussed. The 23 wire ramp angle is chosen to improve measurement precision through the trigonometric enlargement of 2.38 in the x-y image plane. To evaluate the slice width (Zmm), measure the Full Width at Half Maximum (FWHM) length of any of the four wire ramps and multiply the length by 0.42: (Zmm) = FWHM * 0.42 To find the FWHM of the wire from the scan image, you need to determine the CT number values for the peak of the wire and for the background. To calculate the CT number value for the maximum of the wire, close down the CT window opening to 1 or the minimum setting. Move the CT scanner level to the point where the ramp image just totally disappears. The CT number of the level at this position is your peak or maximum value. To calculate the value for the background, use the region of interest function to identify the mean CT number value of the area adjacent to the ramp. Using the above CT values, determine the half maximum: First calculate the net peak... (CT # peak - background = net peak CT #) Calculate the 50% net peak... (net peak CT # 2 = 50% net peak CT #) Calculate the half maximum CT number... (50% net peak CT # + background CT # = half maximum CT #)
13 Now that the half maximum CT number has been determined, measure the full width at half maximum of the ramp. Set the CT scanner level at the half maximum CT value and set your window width at 1. Measure the length of the wire image to determine the FWHM. Multiply the FWHM by 0.42 to determine the slice width. 13 Schematic illustration of two sequential 5mm scans superimposed. L1 is the center point on the 23 ramp in the first scan image and L2 is the center point on the 23 ramp on the second image. Scan incrementation Use the wire ramps to test for proper scanner incrementation between slices, and for table movement. Scan section 1 using a given slice width, (e.g. 5mm). Increment the table one slice width (e.g. 5mm) and make a second scan. Establish the x and y coordinates for the center of each ramp image. Calculate the distance between these points and multiply by the 23 ramp angle correction factor of (L1 - L2) = scan incrementation This test can also be used to test table increment accuracy. Scan the section and increment the table 30mm in and out of the gantry and scan again. The ramp centers should be the same on both images. 0.42(L1 - L2) = 0
14 14 Circular symmetry of display system The circular phantom sections are used to test for circular symmetry of the CT image, including calibration of the CT display system. If an elliptical image is produced, the x-y balance of the image display system should be adjusted. Measuring spatial linearity in x and y axes. Spatial linearity of pixel size verification Scan section 2 has four holes. These 3mm diameter holes are positioned 50mm apart on center. By measuring from center to center the spatial linearity of the CT scanner can be verified. Another use is to count the number of pixels between the hole centers, and by knowing the distance (50mm) and number of pixels, the pixel size can be verified.
15 CT or Hounsfield Numbers by David Goodenough, Ph.D. 15 Users of CT systems are often surprised when the CT number (HU) of a given tissue or substance is different from what they expect from previous experience. These differences do not usually indicate problems of a given CT scanner, but more likely arise from the fact that CT numbers are not universal. They vary depending on the particular energy, filtration, object size and calibration schemes used in a given scanner. One of the problems is that we are all taught that the CT number is given by the equation: CT# = k(µ - µ w )/µ w, where k is the weighting constant (1000 is for Hounsfield Scale), µ is the linear attenuation coefficient of the substance of interest, and µ w is the linear attenuation coefficient of water. Close review of the physics reveals that although the above equation is true to first order, it is not totally correct for a practical CT scanner. In practice, µ and µ w are functions of energy, typical x-ray spectra are not monoenergetic but polychromatic, and a given spectrum emitted by the tube is hardened as it is transmitted (passes) through filter(s) and the object, finally reaching the detector. More accurately, µ=µ(e), a function of energy. Therefore: CT#(E) = k(µ(e) - µ w (E))/µ w (E) Because the spectrum is polychromatic we can at best assign some effective energy Ê to the beam (typically some 50% to 60% of the peak kv or kvp). Additionally, the CT detector will have some energy dependence, and the scatter contribution (dependent on beam width and scanned object size, shape, and composition) may further complicate matters. Although the CT scanner has a built in calibration scheme that tries to correct for beam hardening and other factors, this is based on models and calibration phantoms that are usually round and uniformly filled with water, and will not generally match the body habitus (size, shape, etc.). The situation is really so complicated that it is remarkable that tissue CT numbers are in some first order ways portable! In light of the above we can examine a parameter of CT performance, the linearity scale, as required by the FDA for CT manufacturer s performance specifications. The linearity scale is the best fit relationship between the CT numbers and the corresponding µ values at the effective energy Ê of the x-ray beam. The effective energy Ê is determined by minimizing the residuals in a best-fit straight line relationship between CT numbers and the corresponding µ values. In review, we will encounter considerable inter and intra scanner CT number variability. CT numbers can easily vary by 10 or more based on kvp, slice thickness, and object size, shape, and composition. There is some possibility of the use of iterative techniques and/ or dual energy approaches that might lessen these effects, but certainly CT numbers are not strictly portable and vary according to the factors listed above. More complete scientific references are contained in the bibliography. In particular, references 2, 13, 14, and 20 are recommended for those with greater interest in the topic.
16 16 Sensitometry (CT number linearity) Scan section 2 has sensitometry targets made from Teflon, Bone 50%, Delrin, Bone 20%, acrylic, Polystyrene and low density polyethylene (LDPE), polymethylpentene (PMP), Lung foam #7112 and air. The module is also equipped with a small removable vial which can be filled with water or other material and inserted into the CTP682 module. These targets range from approximately HU to HU. A table with the linear attenuation coefficient µ [units cm -1 ] can be downloaded from our web site. The monitoring of sensitometry target values over time can provide valuable information, indicating changes in scanner performance. Note: values can change depending on local temperature and pressure. Nominal material formulation and specific gravity Material Formula Z 1 eff Specific Gravity 2 HU range 3 Air.78N,.21O,.01Ar : -986 PMP [C6H12(CH2)] : -172 LDPE [C2H4] : -87 Polystyrene [C8H8] : -29 Acrylic [C5H8O2] : 137 Bone 20%.51C,.06Ca,.06H, : N,.30O,.03P Delrin Proprietary : 387 Bone 50%.35C,.14Ca,.04H, : N,.34O,.06P Teflon [CF2] : 1060 Electron density and relative electron density Material Electron Density Electron Density Relative Electron (10 23 e/g) (10 23 e/cm 3 ) Density 4 Air PMP LDPE Polystyrene Acrylic Bone 20% Delrin Bone 50% Teflon Z eff, the efective atomic number, is calculated using a power law approximation. 2 For standard material sensitometry inserts The Phantom Laboratory purchases a multiple year supply of material from a single batch. Samples of the purchased material are then measured to determine the actual specific gravity. The specific gravity of air is taken to be.0013 at standard temperature and pressure. 3 These are maximum and minimum measured values from a sample of 94 scans using different scanners and protocols typically at 120 kvp. HU can vary dramatically between scanners and imaging protocols and numbers outside of this range are not unusual. 4 Relative Electron Density is the electron density of the material in e/cm 3 divided by the electron density of water (H2O) in e/cm 3. 5 Polymethylpentene 6 Low Density Polyethylene
17 An excel file with the linear attenuation coefficient µ [units cm -1 ] for the sensitometry materials can be downloaded from our web site. 17 Mass attenuation coefficients An excel file with the mass attenuation coefficients [units cm 2 /g} and densities for the sensitometry materials can be downloaded from our website phantomlab.com. Contrast Scale Contrast Scale (CS) is formally defined as CS = µm (E) - µw (E) CTm (E) CTw (E) where m is reference medium, and w is water, and E is the effective energy of the CT beam. Alternatively, CS = µ1 (E) - µ2 (E) CT1 (E) CT2 (E) where 1,2 are two materials with low z effective, similar to water (eg. acrylic & air). Linear attenuation coefficient µ [units cm -1 ]
18 18 Point spread function and MTF from bead and wire point sources The impulse sources (.18mm bead or 5 angled 50 micron wire) are used to measure the point source response function of the CT system. The tungsten carbide bead has a diameter of 0.18mm. Because the bead is subpixel sized it is not usually necessary to compensate for its size. However, some MTF programs are designed to compensate for its size. The FWHM of the point spread function is determined from the best-fit curve of the point spread function numerical data. The average of several different arrays of impulse response functions is calculated to obtain the average point spread function of the system. These numerical values are used in conjunction with the Fourier transform to provide an estimate of the two-dimensional spatial frequency response characteristics of the CT system (MTF). The above illustration shows how by summing the columns (y axis) of numbers in the point spread function (PSF) the line spread function (LSF) for the x axis is obtained.
19 Average MTF Cycles/cm 50% % % MTF Spatial Frequency (1/cm) The MTF curve results from the Fourier transform of the LSF data. Generally, it is easiest to use automated software for this operation. Some CT scanners are supplied with software which can calculate the MTF from the Catphan bead images. Independent software is listed in the Current automated programs available section of the manual. Use of automated scanner MTF programs Because the bead is cast into a urethane background, which has a different density than water, the any automated software must compensate for the background. Some software may require point size of.18mm must also be selected. While a sphere does produce a different density profile than a cross section of a wire or cylinder, the actual difference is not usually significant in the determination of the MTF in current CT scanners.


20 20 5 angled 50µ diameter tungsten MTF wire The tungsten wire and the.18mm bead are used as point sources for the calculation of the Modulation Transfer Function (MTF). Traditionally the MTF wire is positioned parallel with the z axis. However, in this phantom the 50µ wire has a 5 angle to the z axis offering some advantages and limitations in volume acquisition. When simple point spread plots from a given slice are used in calculating the MTF, the position of the wire ramp overlapping two or more pixels can cause distorted results. Ilustration of 4 slices with voxels on the left and pixel view on the right. In slice 2 and 3 the wire is within the pixel and on slices 1 and 4 it is also in neighboring pixels. When the angled wire is used, it moves across voxel columns as it passes through slices as shown in the illustration above. In some slices, it will be in multiple voxels and in others a single voxel. For this reason when calculating the MTF from the angled wire, several slices need to be used and the lower frequency measurements need to be eliminated. The lower measurments probably result from the pixel cross over of the wire. The remaining higher frequency results should give a good indication of the resolution. To the right of the 3-D illustration are axial views of the wire location within a pixel. The oval shape illustrates how the wire moves through pixels as it moves through the slices. If thicker slices are used, the length of the oval will extend and the measurement will deteriorate as shown in the illustration on the next page. For this reason we recommend the use of the bead for calculating the MTF in thicker slices. However, determining the largest acceptable slice thickness is dependent on the actual scanner x-y resolution (including the pixel size). Therefore, with higher resolution thinner slices will be required for accurate measurements when using the 5 wire.
21 21 Ilustration of 2 thicker slices on the left and pixel view on the right. In these thicker slices the wire is not contained within any of the pixels. In advanced MTF calculations, as used by the Image Owl Catphan QA service, multiaxis mathematical considerations are included in the MTF calculation, minimizing the effects created when the MTF wire or bead is located in multiple pixels in a slice. However, this may not compensate entirely for the angled MTF wire when used with thicker slices.
22 22 Bead point source for slice sensitivity profile The bead in this module can be used to calculate the slice sensitivity profile (SSP). Z Z Z Z SSP(z) X Y SSP(z) X Y 3mm Spiral 10mm Spiral The above image illustrates how the bead will produce an ovoid object in a 3 dimensional reconstruction. The length of the object at the Full Width at Half Maximum signal indicates the SSP. This measurement can be easily obtained on some systems, by making a sagittal or coronal reconstruction through the bead. The bead image in these reconstructions will appear as a small line. By setting the FWHM (use the same technique described in the Scan slice geometry section) measuring the z axis length of the bead image to obtain the SSP. If the scanner does not have the ability to measure z axis lengths in the sagittal or coronal planes, a SSP can be made by incrementing or spiraling the slice through the bead and reconstructing images in positive and negative table directions from the bead (using the smallest available increments) and plotting the peak CT number of the bead image in each slice. The FWHM measurement can then be made from the plotted CT values of the bead as a function of z axis table position. CT# FWHM z axis position in millimeters
23 Scan section 1 with 15 Line pair per centimeter high resolution gauge 23 This section has a 1 through 15 line pair per centimeter high resolution test gauge. The 15 line pair/cm gauge has resolution tests for visual evaluation of high resolution ranging from 1 through 15 line pair/cm. The gauge accuracy is ± 0.5 line pair at the 15 line pair test and even better at lower line pair tests. The gauge is cut from 2mm thick aluminum sheets and cast into the urethane background. Depending on the choice of slice thickness, the contrast levels will vary due to volume averaging. Gap
24 24 Scan section 3 with CTP730 low contrast module The low contrast targets have the following diameters and contrasts: The low contrast target rods are 40mm long and have the following diameters: 2.0mm 3.0mm 4.0mm 5.0mm 6.0mm 7.0mm 8.0mm 9.0mm 15.0mm Nominal target contrast levels.3%.5% 1.0% Since the target contrasts are nominal, the actual target contrasts need to be determined before testing specific contrast performance specifications. The actual contrast levels are measured by making region of interest measurements over the larger target, and in the local background area. To determine actual contrast levels, average the measurements made from several scans. It is important to measure the background area adjacent to the measured target because cupping and capping effects cause variation of CT numbers from one scan region to another. Position the region of interest to avoid the target edges. The region of interest should be at least 4 x 4 pixels in diameter. Because low contrast measurements are noisy it is advisable to calculate the average of the multiple measurements made from several scans. Carefully monitor the mas setting because the photon flux will improve with increased x-ray exposure. Use the size of the targets visualized under various noise levels to estimate information on contrast detail curves.
25 25 All of the targets in each contrast group are cast from a single mix to assure that the contrast levels will be the same for all targets. The equation below can be used to convert the measured contrasts and diameters to other specified contrasts and diameters. (Measured Contrast) * (smallest diameter discernible) Constant example: 5mm 0.3% 3mm 0.5%
26 26 Scan section 4, Image uniformity The image uniformity section is cast from a uniform material. The material s CT number is designed to be within 2% (20H) of water s density at standard scanning protocols. The typically recorded CT numbers range from 5H to 18H. This module is used for measurements of spatial uniformity, mean CT number and noise value and certain types of artifacts. The precision of a CT system is evaluated by the measurement of the mean value and the corresponding standard deviations in CT numbers within a region of interest (ROI). These measurements are taken from different locations within the scan field. The mean CT number and standard deviation of a large number of points, (say 1000 for example) in a given ROI of the scan, is determined for central and peripheral locations within the scan image for each type of scanning protocol. Inspect the data for changes from previous scans and for correlation between neighboring slices.
27 27 Measure spatial uniformity by scanning the uniformity section. Observe the trends above and below the central mean value of a CT number profile for one or several rows or columns of pixels as shown above. Select a profile which runs from one side of the uniformity module to the opposite side. Due to scanner boundary effects, typical profiles start 1 to 2cm from the edge of the phantom or test module. Integral uniformity may be measured by determining the minimum and maximum CT values along the profile and by using the following equation : Integral Non-Uniformity = CTmax - CTmin CTmax + CTmin The phenomenon of cupping or capping of the CT number may indicate the need for recalibration. This type of non-uniformity may be considered as an artifact if it exceeds several Hounsfield units. Another type of artifact can present as one or more circles or circular bands. This may need to be monitored and possibly corrected if the amplitude or level of the circles and bands might obscure or distract from clinical data. Note: This module does not gererate other types of artifacts such as streaking or comet tails that are created by high contrast items contained in other sections.
28 28 Optional phantom annuli Warning Before mounting a Catphan phantom with an annulus onto the Catphan case, the case must be secured to the table by use of the patient restraint straps or additional weight. If the case is not secured to the table when the phantom is mounted, the case, phantom and annulus could fall off the edge of the table. Additionally the snap lock connection between the clear section and blue section of the phantom could release when excessive pressure is placed on it. The Phantom Laboratory offers a variety of oval and round annuli sizes for use with the Catphan phantoms. Please contact the company for information on available sizes and prices. The annuli are designed to slide over the 20cm Catphan housing as illustrated above. Because the housing material and the uniformity annuli lack lubricity, the annuli may not slide easily. By adding water based lubricant the resistance can be reduced.
29 Dose Phantoms 29 The CTP553 and CTP554 dose phantoms are designed to the Food and Drug Administration s Center for Devices and Radiological Health specification, listed in The dose phantoms may be mounted on the Catphan case following the same procedures and precautions used in Initial phantom positioning. The holes will accept a 1/2 or 13mm diameter dose probe. 32cm 14cm CTP553 1cm Ø 1.31cm 16cm 14cm CTP554 1cm Ø 1.31cm Warning Make sure the Catphan case is secure. Additional counterweight may be required before mounting 32cm dose module onto case.
30 30 Sample quality assurance program The following shows a sample QA program. Review the local governing requirements, and the needs of your physicians and physicists when developing a QA program for your institution. This program should only be considered as a sample. All tests should be conducted at initial acceptance and after major repairs such as a tube replacement. Perform the weekly tests after each preventative maintenance. Suggested frequency of tests: Daily Weekly Monthly* Positional verification Circular symmetry Scan slice geometry Impulse response function Resolution Low contrast Contrast Sensitivity Uniformity, noise characteristics and artifacts *or following preventative maintenance
31 31 Automated computer analysis To assist our customers, The Phantom Laboratory has worked with Image Owl, Inc. to develop an automated QA cloud-based service. The Image Owl Catphan QA service offers detailed CT performance testing and reports with the versatility of internet access. This service can be used with Catphan 500, 503, 504, 600, 604, and 700 models. Along with automated image processing and reporting, Image Owl offers additional advanced tools and services, including longitudinal history, with a subscription to the service. Test reports include: TG142 summary Spatial resolution (modulation transfer function) Noise and image uniformity Slice width and pixel size Sensitometry (CT# linearity, input - output relationship) Contrast detectability (C-D model) Please contact Image Owl for information on the services available. imageowl.com info@imageowl.com Commercial automated software There are now several commercial companies which offer stand-alone software, or incorporate the ability to analyze Catphan images as a part of their software package.
32 32 Bibliography 1. AAPM Report No. 39 Specification and Acceptance Testing of Computed Tomography Scanners Report of Task Group 2 Diagnostic X-Ray Imaging Committee. Published for the American Association of Physicists in Medicine by the American Institute of Physics. May M. J. Berger, J. H. Hubbell, S. M. Seltzer, J. Chang, J. S. Coursey, R. Sukumar, and D. S. Zucker, Feb. 2009, XCOM: Photon Cross Sections Database, NIST Standard Reference Database 8 (XGAM), (July 7, 2010). 3. Brooks and DiChiro Principles of Computer Assisted Tomography (CAT) in Radiographic and Radioisotopic Imaging Phys Med Biol 1976:21: Cohen and DiBanca The Use of Contrast-Detail-Dose Evaluation of Image Quality in a Computed Tomographic Scanner Comput. Assist. Tomogr. 3, Goodenough Assessment of Image Quality of Diagnostic Imaging Systems In: Gray GA (ed). Medical images: formation, perception and measurements. Proceedings of the 7th L.H.Gray Conference, New York: John Wiley & Sons, 1976: Goodenough Automated Quality Assurance for CT Scanners (Chapter): Radiology ICR 749, Editors Silver, Abecasis and Veiga-Pires. Excerpta Medica Press, Amsterdam Goodenough Psychophysical Perception of Computed Tomography Images In: Newton and Potts (eds). Radiology of the skull and brain: technical aspects of computed tomography. Vol 5, St. Louis: CV Mosby, 1981: Goodenough and Atkins Theoretical and Practical Aspects of Automated Quality Assurance Approaches, Particularly for CT Proceedings of the ICR 89, Excerpta Medica Press, Amsterdam Goodenough and Weaver Factors Related to Low Contrast Resolution in CT Scanners Computerized Radiology Vol. 8 No, Goodenough, Weaver, and Davis Development of a Phantom for Evaluation and Assurance of Image Quality in CT Scanning The Proceedings of the Application of Optical Instrumentation in Medicine V meeting sponsored by The Society of Photo-Optical Instrumentation Engineers and The Society of Photographic Scientists and Engineers, September 16-19, 1976, Washington DC; and, Optical Engineering, January Goodenough, Weaver, and Davis Potential Artifacts Associated with the Scanning Pattern of the EMI Scanner Radiology 117: , December 1975
33 Goodenough, Weaver, and Davis Physical Measurement of the EMI Imaging System In: Ter-Pogossian, Phelps, Brownell, Cos Jr., Davis and Evens (eds). Reconstruction tomography in diagnostic radiology and nuclear medicine. Baltimore: University Park Press, 1977: John M. Boone and J. Anthony Seibert, 1997, An accurate method for computergenerating tungsten anode x-ray spectra from 30 to 140 kv, Medical Physics, v. 24, No. 11, p R. J. Kriz and Keith J.Strauss, 1985, An investigation of computed tomography (CT) linearity, Medical Imaging and Instrumentation, v. 555, p McCullough Photon Attenuation in Computed Tomography Medical Physics, 2: , Nov/Dec McCullough, Baker, Hattery, Sheedy, Stephens and Payne Performance Evaluation and Quality Assurance of Computed Tomography (CT) Equipment with Illustrative Data for ACTA, Delta, and EMI Scanners Radiology 120: , July McCullough, Baker, Houser, and Reese An Evaluation of the Quantitative and Radiation Features of Scanning X-ray Transverse Axial Tomography: the EMI Scanner Radiology 111: , June Phelps, Hoffmar-Pogossian Attenuation Coefficients of Various Body Tissues, Fluids and Lesions at Photon Energies of 18 to 136 kev Radiology 117: , December Rossmann Point Spread Function, Line Spread Function and Modulation Transfer Function: Tools for the Study of Imaging Systems Radiology 1969:93: T. R. Fewell, R. E. Shuping, and K. E. Healy, 1981, Handbook of Computed Tomography X-ray Spectra, HHS Publication (FDA) (U.S. Government Printing Office, Washington D.C.). 21. Weaver, Goodenough, and Briefel Sensitometry in Computerized Tomography Proceedings of SPIE, Medicine VI. 1977:127: Yester and Barnes Geometrical Limitations of Computed Tomography (CT) Scanner Resolution Optical instrumentation in Medicine VI. SPIE, 1977:127: International Commission on Radiatin Units and Measurements Tissue Substitutes in Radiation Dosimetry and Measurement ICRU Report 44
34 Klein, Hanley, Bayouth, Yin, Simon, Dresser, Serago, Aguirre, Ma, Arjomandy, Liu, Sandin and Holms Quality Assurance of Medical Accelerators AAPM Task Group 142 report 25. Hatton, McCurdy and Greer Cone beam computerized tomography: the effect of calibration of the Hounsfield unit number to electron density on dose calculation accuracy for adaptive radiation therapy Physics in Medicine and Biology August Thomas Relative electron density calibration of CT scanners for radiotherapy treatment planning British Journal of Radiology 72(860):781-6, August 1999
C a t p h a n 500 and 600 M a n u a l
 T h e P h a n t o m L a b o r a t o r y 1 C a t p h a n 500 and 600 M a n u a l Copyright 2015 WARRANTY THE PHANTOM LABORATORY INCORPORATED ( Seller ) warrants that this product shall remain in good working
C a t p h a n 700 M a n u a l
 T h e P h a n t o m L a b o r a t o r y 1 C a t p h a n 700 M a n u a l Copyright 2016 WARRANTY THE PHANTOM LABORATORY INCORPORATED ( Seller ) warrants that this product shall remain in good working order
C a t p h a n / T h e P h a n t o m L a b o r a t o r y
 C a t p h a n 5 0 0 / 6 0 0 T h e P h a n t o m L a b o r a t o r y C a t p h a n 5 0 0 / 6 0 0 Internationally recognized for measuring the maximum obtainable performance of axial, spiral and multi-slice
MEDICAL EQUIPMENT: COMPUTED TOMOGRAPHY. Prof. Yasser Mostafa Kadah
 MEDICAL EQUIPMENT: COMPUTED TOMOGRAPHY Prof. Yasser Mostafa Kadah www.k-space.org Recommended Textbook X-Ray Computed Tomography in Biomedical Engineering, by Robert Cierniak, Springer, 211 Computed Tomography
Scatter Correction for Dual source Cone beam CT Using the Pre patient Grid. Yingxuan Chen. Graduate Program in Medical Physics Duke University
 Scatter Correction for Dual source Cone beam CT Using the Pre patient Grid by Yingxuan Chen Graduate Program in Medical Physics Duke University Date: Approved: Lei Ren, Supervisor Fang Fang Yin, Chair
Spiral CT. Protocol Optimization & Quality Assurance. Ge Wang, Ph.D. Department of Radiology University of Iowa Iowa City, Iowa 52242, USA
 Spiral CT Protocol Optimization & Quality Assurance Ge Wang, Ph.D. Department of Radiology University of Iowa Iowa City, Iowa 52242, USA Spiral CT Protocol Optimization & Quality Assurance Protocol optimization
Effects of the difference in tube voltage of the CT scanner on. dose calculation
 Effects of the difference in tube voltage of the CT scanner on dose calculation Dong Joo Rhee, Sung-woo Kim, Dong Hyeok Jeong Medical and Radiological Physics Laboratory, Dongnam Institute of Radiological
Automated Image Analysis Software for Quality Assurance of a Radiotherapy CT Simulator
 Automated Image Analysis Software for Quality Assurance of a Radiotherapy CT Simulator Andrew J Reilly Imaging Physicist Oncology Physics Edinburgh Cancer Centre Western General Hospital EDINBURGH EH4
S. Guru Prasad, Ph.D., DABR
 PURPOSE S. Guru Prasad, Ph.D., DABR Director of Medical Physics IAEA Consultant NorthShore University Health System and University of Chicago, Pritzker School of Medicine Current TPS utilize more information
Ch. 4 Physical Principles of CT
 Ch. 4 Physical Principles of CT CLRS 408: Intro to CT Department of Radiation Sciences Review: Why CT? Solution for radiography/tomography limitations Superimposition of structures Distinguishing between
Introduction to Biomedical Imaging
 Alejandro Frangi, PhD Computational Imaging Lab Department of Information & Communication Technology Pompeu Fabra University www.cilab.upf.edu X-ray Projection Imaging Computed Tomography Digital X-ray
Design and development of a phantom for tomosynthesis with potential for automated analysis via the cloud
 Received: 21 August 2017 Revised: 25 October 2017 Accepted: 7 January 2018 DOI: 10.1002/acm2.12297 MEDICAL IMAGING Design and development of a phantom for tomosynthesis with potential for automated analysis
Spectral analysis of non-stationary CT noise
 Spectral analysis of non-stationary CT noise Kenneth M. Hanson Los Alamos Scientific Laboratory Int. Symposium and Course on Computed Tomography, Las Vegas, April 7-11, 1980 This presentation available
Empirical cupping correction: A first-order raw data precorrection for cone-beam computed tomography
 Empirical cupping correction: A first-order raw data precorrection for cone-beam computed tomography Marc Kachelrieß, a Katia Sourbelle, and Willi A. Kalender Institute of Medical Physics, University of
ImPACT. Information Leaflet No. 1: CT Scanner Acceptance Testing
 ImPACT Information Leaflet No. 1: CT Scanner Acceptance Testing Version 1.02, 18/05/01 CONTENTS: 1. SCOPE OF LEAFLET 2. GENERAL PRINCIPLES OF ACCEPTANCE AND COMMISSIONING 2.1 PHANTOMS 2.2 EXPOSURE AND
Quality control phantoms and protocol for a tomography system
 Quality control phantoms and protocol for a tomography system Lucía Franco 1 1 CT AIMEN, C/Relva 27A O Porriño Pontevedra, Spain, lfranco@aimen.es Abstract Tomography systems for non-destructive testing
Shadow casting. What is the problem? Cone Beam Computed Tomography THE OBJECTIVES OF DIAGNOSTIC IMAGING IDEAL DIAGNOSTIC IMAGING STUDY LIMITATIONS
 Cone Beam Computed Tomography THE OBJECTIVES OF DIAGNOSTIC IMAGING Reveal pathology Reveal the anatomic truth Steven R. Singer, DDS srs2@columbia.edu IDEAL DIAGNOSTIC IMAGING STUDY Provides desired diagnostic
DUE to beam polychromacity in CT and the energy dependence
 1 Empirical Water Precorrection for Cone-Beam Computed Tomography Katia Sourbelle, Marc Kachelrieß, Member, IEEE, and Willi A. Kalender Abstract We propose an algorithm to correct for the cupping artifact
Radiology. Marta Anguiano Millán. Departamento de Física Atómica, Molecular y Nuclear Facultad de Ciencias. Universidad de Granada
 Departamento de Física Atómica, Molecular y Nuclear Facultad de Ciencias. Universidad de Granada Overview Introduction Overview Introduction Tecniques of imaging in Overview Introduction Tecniques of imaging
Image Acquisition Systems
 Image Acquisition Systems Goals and Terminology Conventional Radiography Axial Tomography Computer Axial Tomography (CAT) Magnetic Resonance Imaging (MRI) PET, SPECT Ultrasound Microscopy Imaging ITCS
A study on image quality provided by a kilovoltage cone-beam computed tomography
 JOURNAL OF APPLIED CLINICAL MEDICAL PHYSICS, VOLUME 14, NUMBER 1, 2013 A study on image quality provided by a kilovoltage cone-beam computed tomography Julia Garayoa a and Pablo Castro Servicio de Radiofísica,
DUAL energy X-ray radiography [1] can be used to separate
![DUAL energy X-ray radiography [1] can be used to separate](/thumbs/91/106229592.jpg "DUAL energy X-ray radiography [1] can be used to separate") IEEE TRANSACTIONS ON NUCLEAR SCIENCE, VOL. 53, NO. 1, FEBRUARY 2006 133 A Scatter Correction Using Thickness Iteration in Dual-Energy Radiography S. K. Ahn, G. Cho, and H. Jeon Abstract In dual-energy
IEEE TRANSACTIONS ON NUCLEAR SCIENCE, VOL. 53, NO. 1, FEBRUARY 2006 133 A Scatter Correction Using Thickness Iteration in Dual-Energy Radiography S. K. Ahn, G. Cho, and H. Jeon Abstract In dual-energy
CT vs. VolumeScope: image quality and dose comparison
 CT vs. VolumeScope: image quality and dose comparison V.N. Vasiliev *a, A.F. Gamaliy **b, M.Yu. Zaytsev b, K.V. Zaytseva ***b a Russian Sci. Center of Roentgenology & Radiology, 86, Profsoyuznaya, Moscow,
Financial disclosure. Onboard imaging modality for IGRT
 Tetrahedron Beam Computed Tomography Based On Multi-Pixel X- Ray Source and Its Application in Image Guided Radiotherapy Tiezhi Zhang, Ph.D. Advanced X-ray imaging Lab Financial disclosure Patent royalty
Assessment of 3D performance metrics. X-ray based Volumetric imaging systems: Fourier-based imaging metrics. The MTF in CT
 Assessment of 3D performance metrics D and 3D Metrics of Performance Towards Quality Index: Volumetric imaging systems X-ray based Volumetric imaging systems: CBCT/CT Tomosynthesis Samuel Richard and Ehsan
Background. Outline. Radiographic Tomosynthesis: Image Quality and Artifacts Reduction 1 / GE /
 Radiographic Tomosynthesis: Image Quality and Artifacts Reduction Baojun Li, Ph.D Department of Radiology Boston University Medical Center 2012 AAPM Annual Meeting Background Linear Trajectory Tomosynthesis
DEVELOPMENT OF CONE BEAM TOMOGRAPHIC RECONSTRUCTION SOFTWARE MODULE
 Rajesh et al. : Proceedings of the National Seminar & Exhibition on Non-Destructive Evaluation DEVELOPMENT OF CONE BEAM TOMOGRAPHIC RECONSTRUCTION SOFTWARE MODULE Rajesh V Acharya, Umesh Kumar, Gursharan
Optimization of CT Simulation Imaging. Ingrid Reiser Dept. of Radiology The University of Chicago
 Optimization of CT Simulation Imaging Ingrid Reiser Dept. of Radiology The University of Chicago Optimization of CT imaging Goal: Achieve image quality that allows to perform the task at hand (diagnostic
Simulation of Mammograms & Tomosynthesis imaging with Cone Beam Breast CT images
 Simulation of Mammograms & Tomosynthesis imaging with Cone Beam Breast CT images Tao Han, Chris C. Shaw, Lingyun Chen, Chao-jen Lai, Xinming Liu, Tianpeng Wang Digital Imaging Research Laboratory (DIRL),
CALIBRATIONS FOR ANALYZING INDUSTRIAL SAMPLES ON MEDICAL CT SCANNERS
 CALIBRATIONS FOR ANALYZING INDUSTRIAL SAMPLES ON MEDICAL CT SCANNERS INTRODUCTION Patricia K. Hunt, Philip Engler, and William D. Friedman BP American Research and Development 4440 Warrensville Center
Enhanced material contrast by dual-energy microct imaging
 Enhanced material contrast by dual-energy microct imaging Method note Page 1 of 12 2 Method note: Dual-energy microct analysis 1. Introduction 1.1. The basis for dual energy imaging Micro-computed tomography
Metal Artifact Reduction CT Techniques. Tobias Dietrich University Hospital Balgrist University of Zurich Switzerland
 Metal Artifact Reduction CT Techniques R S S S Tobias Dietrich University Hospital Balgrist University of Zurich Switzerland N. 1 v o 4 1 0 2. Postoperative CT Metal Implants CT is accurate for assessment
CT Protocol Review: Practical Tips for the Imaging Physicist Physicist
 CT Protocol Review: Practical Tips for the Imaging Physicist Physicist Dianna Cody, Ph.D., DABR, FAAPM U.T.M.D. Anderson Cancer Center August 8, 2013 AAPM Annual Meeting Goals Understand purpose and importance
CLASS HOURS: 4 CREDIT HOURS: 4 LABORATORY HOURS: 0
 Revised 10/10 COURSE SYLLABUS TM 220 COMPUTED TOMOGRAPHY PHYSICS CLASS HOURS: 4 CREDIT HOURS: 4 LABORATORY HOURS: 0 CATALOG COURSE DESCRIPTION: This course is one of a three course set in whole body Computed
Artifact Mitigation in High Energy CT via Monte Carlo Simulation
 PIERS ONLINE, VOL. 7, NO. 8, 11 791 Artifact Mitigation in High Energy CT via Monte Carlo Simulation Xuemin Jin and Robert Y. Levine Spectral Sciences, Inc., USA Abstract The high energy (< 15 MeV) incident
Basics of treatment planning II
 Basics of treatment planning II Sastry Vedam PhD DABR Introduction to Medical Physics III: Therapy Spring 2015 Dose calculation algorithms! Correction based! Model based 1 Dose calculation algorithms!
Multi-Purpose Body Phantom
 Multi-Purpose Body Phantom Legal & Copyright Notice Information in this manual is subject to change without notice. Permission is granted to Owners of the to reproduce the Worksheets included in this manual
CT NOISE POWER SPECTRUM FOR FILTERED BACKPROJECTION AND ITERATIVE RECONSTRUCTION
 CT NOISE POWER SPECTRUM FOR FILTERED BACKPROJECTION AND ITERATIVE RECONSTRUCTION Frank Dong, PhD, DABR Diagnostic Physicist, Imaging Institute Cleveland Clinic Foundation and Associate Professor of Radiology
SYSTEM LINEARITY LAB MANUAL: 2 Modifications for P551 Fall 2013 Medical Physics Laboratory
 SYSTEM LINEARITY LAB MANUAL: 2 Modifications for P551 Fall 2013 Medical Physics Laboratory Introduction In this lab exercise, you will investigate the linearity of the DeskCAT scanner by making measurements
1. Deployment of a framework for drawing a correspondence between simple figure of merits (FOM) and quantitative imaging performance in CT.
 and quantitative imaging performance in CT.") Progress report: Development of assessment and predictive metrics for quantitative imaging in chest CT Subaward No: HHSN6801000050C (4a) PI: Ehsan Samei Reporting Period: month 1-18 Deliverables: 1. Deployment
Progress report: Development of assessment and predictive metrics for quantitative imaging in chest CT Subaward No: HHSN6801000050C (4a) PI: Ehsan Samei Reporting Period: month 1-18 Deliverables: 1. Deployment
Micro-CT Methodology Hasan Alsaid, PhD
 Micro-CT Methodology Hasan Alsaid, PhD Preclinical & Translational Imaging LAS, PTS, GlaxoSmithKline 20 April 2015 Provide basic understanding of technical aspects of the micro-ct Statement: All procedures
8/7/2017. Disclosures. MECT Systems Overview and Quantitative Opportunities. Overview. Computed Tomography (CT) CT Numbers. Polyenergetic Acquisition
 CT Numbers. Polyenergetic Acquisition") Quantitative Multi-Energy Computed Tomography: Imaging and Therapy Advancements Disclosures MECT Systems Overview and Quantitative Opportunities The speaker receives research funding from GE Healthcare
Quantitative Multi-Energy Computed Tomography: Imaging and Therapy Advancements Disclosures MECT Systems Overview and Quantitative Opportunities The speaker receives research funding from GE Healthcare
Scatter Correction Methods in Dimensional CT
 Scatter Correction Methods in Dimensional CT Matthias Baer 1,2, Michael Hammer 3, Michael Knaup 1, Ingomar Schmidt 3, Ralf Christoph 3, Marc Kachelrieß 2 1 Institute of Medical Physics, Friedrich-Alexander-University
Tomographic Reconstruction
 Tomographic Reconstruction 3D Image Processing Torsten Möller Reading Gonzales + Woods, Chapter 5.11 2 Overview Physics History Reconstruction basic idea Radon transform Fourier-Slice theorem (Parallel-beam)
Multi-slice CT Image Reconstruction Jiang Hsieh, Ph.D.
 Multi-slice CT Image Reconstruction Jiang Hsieh, Ph.D. Applied Science Laboratory, GE Healthcare Technologies 1 Image Generation Reconstruction of images from projections. textbook reconstruction advanced
Digital Image Processing
 Digital Image Processing SPECIAL TOPICS CT IMAGES Hamid R. Rabiee Fall 2015 What is an image? 2 Are images only about visual concepts? We ve already seen that there are other kinds of image. In this lecture
DUAL energy CT (DECT) is a modality where one and. Empirical Dual Energy Calibration (EDEC) for Cone-Beam Computed Tomography
 is a modality where one and. Empirical Dual Energy Calibration (EDEC) for Cone-Beam Computed Tomography") Empirical Dual Energy Calibration (EDEC) for Cone-Beam Computed Tomography Marc Kachelrieß, Member, IEEE, Timo Berkus, Philip Stenner, Willi A. Kalender Abstract Material selective imaging using dual energy
Empirical Dual Energy Calibration (EDEC) for Cone-Beam Computed Tomography Marc Kachelrieß, Member, IEEE, Timo Berkus, Philip Stenner, Willi A. Kalender Abstract Material selective imaging using dual energy
RITtrend allows you to effectively manage all your physics QA data in one powerful and customizable package.
 So much is asked of medical physicists these days We Can Help Automated Radiation Therapy Phantom Analysis in Seconds QC for Therapy OBI s and CT simulators. Radia s Catphan/OBI module performs analysis
Developments in Dimensional Metrology in X-ray Computed Tomography at NPL
 Developments in Dimensional Metrology in X-ray Computed Tomography at NPL Wenjuan Sun and Stephen Brown 10 th May 2016 1 Possible factors influencing XCT measurements Components Influencing variables Possible
Evaluation of AutoQA Lite TM Image Quality Measurement Software
 Evaluation of AutoQA Lite TM Image Quality Measurement Software Andrew J Reilly Imaging Physicist Oncology Physics Edinburgh Cancer Centre Western General Hospital EDINBURGH EH4 2XU Phone: 0131 537 1161
Loma Linda University Medical Center Dept. of Radiation Medicine
 Loma Linda University Medical Center Dept. of Radiation Medicine and Northern Illinois University Dept. of Physics and Dept. of Computer Science Presented by George Coutrakon, PhD NIU Physics Dept. Collaborators
MULTI-PURPOSE 3D COMPUTED TOMOGRAPHY SYSTEM
 MULTI-PURPOSE 3D COMPUTED TOMOGRAPHY SYSTEM M. Simon, C. Sauerwein, I. Tiseanu, S. Burdairon Hans Wälischmiller GmbH Klingleweg 8, D-88709 Meersburg, Germany e-mail: ms@hwm.com ABSTRACT A new flexible
Applying Hounsfield unit density calibration in SkyScan CT-analyser
 1 Bruker-microCT Method note Applying Hounsfield unit density calibration in SkyScan CT-analyser Hounsfield units (HU) are a standard unit of x-ray CT density, in which air and water are ascribed values
MEDICAL IMAGING 2nd Part Computed Tomography
 MEDICAL IMAGING 2nd Part Computed Tomography Introduction 2 In the last 30 years X-ray Computed Tomography development produced a great change in the role of diagnostic imaging in medicine. In convetional
Slide 1. Technical Aspects of Quality Control in Magnetic Resonance Imaging. Slide 2. Annual Compliance Testing. of MRI Systems.
 Slide 1 Technical Aspects of Quality Control in Magnetic Resonance Imaging Slide 2 Compliance Testing of MRI Systems, Ph.D. Department of Radiology Henry Ford Hospital, Detroit, MI Slide 3 Compliance Testing
Design and performance characteristics of a Cone Beam CT system for Leksell Gamma Knife Icon
 Design and performance characteristics of a Cone Beam CT system for Leksell Gamma Knife Icon WHITE PAPER Introduction Introducing an image guidance system based on Cone Beam CT (CBCT) and a mask immobilization
SPECT QA and QC. Bruce McBride St. Vincent s Hospital Sydney.
 SPECT QA and QC Bruce McBride St. Vincent s Hospital Sydney. SPECT QA and QC What is needed? Why? How often? Who says? QA and QC in Nuclear Medicine QA - collective term for all the efforts made to produce
Corso di laurea in Fisica A.A Fisica Medica 4 TC
 Corso di laurea in Fisica A.A. 2007-2008 Fisica Medica 4 TC Computed Tomography Principles 1. Projection measurement 2. Scanner systems 3. Scanning modes Basic Tomographic Principle The internal structure
HIGH-SPEED THEE-DIMENSIONAL TOMOGRAPHIC IMAGING OF FRAGMENTS AND PRECISE STATISTICS FROM AN AUTOMATED ANALYSIS
 23 RD INTERNATIONAL SYMPOSIUM ON BALLISTICS TARRAGONA, SPAIN 16-20 APRIL 2007 HIGH-SPEED THEE-DIMENSIONAL TOMOGRAPHIC IMAGING OF FRAGMENTS AND PRECISE STATISTICS FROM AN AUTOMATED ANALYSIS P. Helberg 1,
TEP Hounsfield units. Related topics Attenuation coefficient, Hounsfield units
 Hounsfield units TEP Related topics Attenuation coefficient, Hounsfield units Principle Depending on the type of CT scanner and the settings, the result of a CT scan of the same material can be different
James R Halama, PhD Loyola University Medical Center
 James R Halama, PhD Loyola University Medical Center Conflicts of Interest Nuclear Medicine and PET physics reviewer for the ACR Accreditation program Learning Objectives Be familiar with the tests recommended
BME I5000: Biomedical Imaging
 1 Lucas Parra, CCNY BME I5000: Biomedical Imaging Lecture 4 Computed Tomography Lucas C. Parra, parra@ccny.cuny.edu some slides inspired by lecture notes of Andreas H. Hilscher at Columbia University.
Recognition and Measurement of Small Defects in ICT Testing
 19 th World Conference on Non-Destructive Testing 2016 Recognition and Measurement of Small Defects in ICT Testing Guo ZHIMIN, Ni PEIJUN, Zhang WEIGUO, Qi ZICHENG Inner Mongolia Metallic Materials Research
3/27/2012 WHY SPECT / CT? SPECT / CT Basic Principles. Advantages of SPECT. Advantages of CT. Dr John C. Dickson, Principal Physicist UCLH
 3/27/212 Advantages of SPECT SPECT / CT Basic Principles Dr John C. Dickson, Principal Physicist UCLH Institute of Nuclear Medicine, University College London Hospitals and University College London john.dickson@uclh.nhs.uk
Comparison between computerized tomography and ultrasound systems for treatment planning in RT
 Comparison between computerized tomography and ultrasound systems for treatment planning in RT Inês Henriques de Carvalho Pino, Physics Department, Instituto Superior Técnico, Universidade de Lisboa, Lisboa,
Evaluation of Spectrum Mismatching using Spectrum Binning Approach for Statistical Polychromatic Reconstruction in CT
 Evaluation of Spectrum Mismatching using Spectrum Binning Approach for Statistical Polychromatic Reconstruction in CT Qiao Yang 1,4, Meng Wu 2, Andreas Maier 1,3,4, Joachim Hornegger 1,3,4, Rebecca Fahrig
Unique Features of the GE Senoclaire Tomosynthesis System. Tyler Fisher, M.S., DABR Therapy Physics, Inc.
 Unique Features of the GE Senoclaire Tomosynthesis System Tyler Fisher, M.S., DABR Therapy Physics, Inc. Conflict of Interest Disclosure I have no conflicts to disclose. Learning Objectives Overview of
INTRODUCTION TO MEDICAL IMAGING- 3D LOCALIZATION LAB MANUAL 1. Modifications for P551 Fall 2013 Medical Physics Laboratory
 INTRODUCTION TO MEDICAL IMAGING- 3D LOCALIZATION LAB MANUAL 1 Modifications for P551 Fall 2013 Medical Physics Laboratory Introduction Following the introductory lab 0, this lab exercise the student through
Advanced Image Reconstruction Methods for Photoacoustic Tomography
 Advanced Image Reconstruction Methods for Photoacoustic Tomography Mark A. Anastasio, Kun Wang, and Robert Schoonover Department of Biomedical Engineering Washington University in St. Louis 1 Outline Photoacoustic/thermoacoustic
Clinical implementation of photon beam flatness measurements to verify beam quality
 JOURNAL OF APPLIED CLINICAL MEDICAL PHYSICS, VOLUME 16, NUMBER 6, 2015 Clinical implementation of photon beam flatness measurements to verify beam quality Simon Goodall, a Nicholas Harding, Jake Simpson,
INTERNATIONAL STANDARD
 INTERNATIONAL STANDARD IEC 60601-2-44 2001 AMENDMENT 1 2002-09 Amendment 1 Medical electrical equipment Part 2-44: Particular requirements for the safety of X-ray equipment for computed tomography Amendement
Cardiac Dual Energy CT: Technique
 RSNA 2013, VSCA51-01, Chicago, Dec. 5, 2013 Cardiac Radiology Series Cardiac Dual Energy CT: Technique Willi A. Kalender, Ph.D. Institute of Medical Physics University of Erlangen www.imp.uni-erlangen.de
Carestream s 2 nd Generation Metal Artifact Reduction Software (CMAR 2)
") Carestream s 2 nd Generation Metal Artifact Reduction Software (CMAR 2) Author: Levon Vogelsang Introduction Cone beam computed tomography (CBCT), or cone beam CT technology, offers considerable promise
Carestream s 2 nd Generation Metal Artifact Reduction Software (CMAR 2) Author: Levon Vogelsang Introduction Cone beam computed tomography (CBCT), or cone beam CT technology, offers considerable promise
Phase-Contrast Imaging and Tomography at 60 kev using a Conventional X-ray Tube
 Phase-Contrast Imaging and Tomography at 60 kev using a Conventional X-ray Tube T. Donath* a, F. Pfeiffer a,b, O. Bunk a, W. Groot a, M. Bednarzik a, C. Grünzweig a, E. Hempel c, S. Popescu c, M. Hoheisel
A closer look at CT scanning
 Vet Times The website for the veterinary profession https://www.vettimes.co.uk A closer look at CT scanning Author : Charissa Lee, Natalie Webster Categories : General, Vets Date : April 3, 2017 A basic
CBCT Equivalent Source Generation Using HVL and Beam Profile Measurements. Johnny Little PSM - Medical Physics Graduate Student University of Arizona
 CBCT Equivalent Source Generation Using HVL and Beam Profile Measurements. Johnny Little PSM - Medical Physics Graduate Student University of Arizona Introduction CBCT has become a routine procedure for
Conflicts of Interest Nuclear Medicine and PET physics reviewer for the ACR Accreditation program
 James R Halama, PhD Loyola University Medical Center Conflicts of Interest Nuclear Medicine and PET physics reviewer for the ACR Accreditation program Learning Objectives 1. Be familiar with recommendations
CT Basics Principles of Spiral CT Dose. Always Thinking Ahead.
 1 CT Basics Principles of Spiral CT Dose 2 Who invented CT? 1963 - Alan Cormack developed a mathematical method of reconstructing images from x-ray projections Sir Godfrey Hounsfield worked for the Central
7/13/2015 EVALUATION OF NONLINEAR RECONSTRUCTION METHODS. Outline. This is a decades-old challenge
 EVALUATION OF NONLINEAR RECONSTRUCTION METHODS Kyle J. Myers, Ph.D. Director, Division of Imaging, Diagnostics, and Software Reliability Office of Science and Engineering Laboratories, CDRH, FDA 2 Outline
Automated Quality Assurance for Image-Guided Radiation Therapy
 JOURNAL OF APPLIED CLINICAL MEDICAL PHYSICS, VOLUME 10, NUMBER 1, WINTER 2009 Automated Quality Assurance for Image-Guided Radiation Therapy Eduard Schreibmann, a Eric Elder, Tim Fox Department of Radiation
Using the ACR CT accreditation phantom for routine image quality assurance on both CT and CBCT imaging systems in a radiotherapy environment
 JOURNAL OF APPLIED CLINICAL MEDICAL PHYSICS, VOLUME 15, NUMBER 4, 2014 Using the ACR CT accreditation phantom for routine image quality assurance on both CT and CBCT imaging systems in a radiotherapy environment
CT: Physics Principles & Equipment Design
 CT: Physics Principles & Equipment Design James Kofler, Ph.D Radiology Mayo Clinic Rochester, MN June 27, 2012 Disclosures Nothing to disclose Learning Objectives Understand fundamental concepts of - CT
ISO ISO ISO OHSAS ISO
 ISO 9001 ISO 13485 ISO 14001 OHSAS 18001 ISO 27001 Pro-NM Performance 08-101 - standard version 08-103 - version with the PET Lid Phantom for NM and PET systems performance evaluation (collimator, artifacts,
Biomedical Imaging. Computed Tomography. Patrícia Figueiredo IST
 Biomedical Imaging Computed Tomography Patrícia Figueiredo IST 2013-2014 Overview Basic principles X ray attenuation projection Slice selection and line projections Projection reconstruction Instrumentation
PET-CT in Radiation Treatment Planning
 PET-CT in Radiation Treatment Planning TA van de Water, Radiotherapeutic Institute Friesland, Leeuwarden JA van Dalen, Isala, Zwolle ACKNOWLEDGEMENTS A. van der Schaaf (University of Groningen, University
Implementation and evaluation of a fully 3D OS-MLEM reconstruction algorithm accounting for the PSF of the PET imaging system
 Implementation and evaluation of a fully 3D OS-MLEM reconstruction algorithm accounting for the PSF of the PET imaging system 3 rd October 2008 11 th Topical Seminar on Innovative Particle and Radiation
UNCOMPROMISING QUALITY
 ION CHAMBERS UNCOMPROMISING QUALITY Designed with over 30 years of scientific integrity for a broad range of dosimetry measurements in diverse radiation beams Farmer-type Chambers For absolute dosimetry
HIGH RESOLUTION COMPUTED TOMOGRAPHY FOR METROLOGY
 HIGH RESOLUTION COMPUTED TOMOGRAPHY FOR METROLOGY David K. Lehmann 1, Kathleen Brockdorf 1 and Dirk Neuber 2 1 phoenix x-ray Systems + Services Inc. St. Petersburg, FL, USA 2 phoenix x-ray Systems + Services
Computer-Tomography II: Image reconstruction and applications
 Computer-Tomography II: Image reconstruction and applications Prof. Dr. U. Oelfke DKFZ Heidelberg Department of Medical Physics (E040) Im Neuenheimer Feld 280 69120 Heidelberg, Germany u.oelfke@dkfz.de
RADIOLOGY AND DIAGNOSTIC IMAGING
 Day 2 part 2 RADIOLOGY AND DIAGNOSTIC IMAGING Dr hab. Zbigniew Serafin, MD, PhD serafin@cm.umk.pl 2 3 4 5 CT technique CT technique 6 CT system Kanal K: RSNA/AAPM web module: CT Systems & CT Image Quality
8/2/2016. Measures the degradation/distortion of the acquired image (relative to an ideal image) using a quantitative figure-of-merit
 using a quantitative figure-of-merit") Ke Li Assistant Professor Department of Medical Physics and Department of Radiology School of Medicine and Public Health, University of Wisconsin-Madison This work is partially supported by an NIH Grant
Ke Li Assistant Professor Department of Medical Physics and Department of Radiology School of Medicine and Public Health, University of Wisconsin-Madison This work is partially supported by an NIH Grant
Measurement of Skin Dose
 Measurement of Skin Dose Sources of Uncertainty Kenneth A. Fetterly, Ph.D. William Pavlicek, Ph.D. Dan Bednarek, PhD 2014 AAPM Annual Meeting, Austin Texas 2013 MFMER slide-1 Purpose 1. Present a framework
Fits you like no other
 Fits you like no other BrightView X and XCT specifications The new BrightView X system is a fully featured variableangle camera that is field-upgradeable to BrightView XCT without any increase in room
Coordinate Measuring Machines with Computed Tomography
 Always a Step Ahead with Quality Coordinate Measuring Machines with Computed Tomography Multisensor Coordinate Measuring Machines with Computed Tomography Computed Tomography in Coordinate Measuring Machines
COMPREHENSIVE QUALITY CONTROL OF NMR TOMOGRAPHY USING 3D PRINTED PHANTOM
 COMPREHENSIVE QUALITY CONTROL OF NMR TOMOGRAPHY USING 3D PRINTED PHANTOM Mažena MACIUSOVIČ *, Marius BURKANAS *, Jonas VENIUS *, ** * Medical Physics Department, National Cancer Institute, Vilnius, Lithuania
Non-Stationary CT Image Noise Spectrum Analysis
 Non-Stationary CT Image Noise Spectrum Analysis Michael Balda, Björn J. Heismann,, Joachim Hornegger Pattern Recognition Lab, Friedrich-Alexander-Universität Erlangen Siemens Healthcare, Erlangen michael.balda@informatik.uni-erlangen.de
Proton dose calculation algorithms and configuration data
 Proton dose calculation algorithms and configuration data Barbara Schaffner PTCOG 46 Educational workshop in Wanjie, 20. May 2007 VARIAN Medical Systems Agenda Broad beam algorithms Concept of pencil beam
Evaluation of Computed Tomography Techniques for Material Identification in Low Level and Intermediate Level Waste
 Evaluation of Computed Tomography Techniques for Material Identification in Low Level and Intermediate Level Waste. 16648 Stephen Halliwell, VJ Technologies Inc, 89 Carlough Road, Bohemia, NY 11716, USA.
Fundamentals of CT imaging
 SECTION 1 Fundamentals of CT imaging I History In the early 1970s Sir Godfrey Hounsfield s research produced the first clinically useful CT scans. Original scanners took approximately 6 minutes to perform
Quick Reference Datasheet For All RIT113 Packages
 Quick Reference Datasheet For All RIT113 Packages For Rotational Therapies, IMRT & TG142 Highlights and selected product information only. A complete TG142 brochure is available. For more information on