Downloading and importing DEM data from ASTER or SRTM (~30m resolution) into ArcMap
|
|
|
- Nathaniel Wilson
- 6 years ago
- Views:
Transcription

1 Downloading and importing DEM data from ASTER or SRTM (~30m resolution) into ArcMap Step 1: ASTER or SRTM? There has been some concerns about the quality of ASTER data, nicely exemplified in the following paper: Burch Fisher, G., Bookhagen, B., and Amos, C.B., Channel planform geometry and slopes from freely available high-spatial resolution imagery and DEM fusion: Implications for channel width scalings, erosion proxies, and fluvial signatures in tectonically active landscapes, Geomorphology, 194, 46-56, Until recently, ASTER presented the advantage of greater resolution (~30 m compared to ~90 m for SRTM), for want of greater accuracy, but now SRTM data are available at ~30 m resolution for large parts of the world. I therefore present below how to get the data from SRTM or ASTER. SRTM (preferred): You can get data through the USGS EarthExplorer: I haven't had the time to explore much but basically, you enter your search criteria (mostly location: you can draw a polygon by double clicking on the map), then select the dataset (in the Data Sets tab select Digital Elevation SRTM 1 Arc-second global and void filled - not all data is available in the 1 Arc-second global) and click on results (select the dataset you want in the drop down menu). You can visualise the extent of each tile on the map by clicking the little footprint next to each tile. You can then download the tiles by logging in (you will have to create your account the first time). For some areas, the 1 Arc-second data (~30-m resolution) DEM do not seem to be available so you may have to deal with the 3 Arc-second (~90-m resolution - that is the "void filled") or ASTER. ASTER: WIST where the data used to be available has been replaced by Reverb in February To access Reverb, go to: You will have to create an account (if you had created one with WIST, then you won t need to do it again). The home page looks like:

.")
2 At the top right, specify that you are after ASTER tiles in the Search Term bar: type ASTER GDEM and the ASTER Global Digital Elevation Model V002 will appear in the Select Datasets window at the bottom. Then, select the zone of interest in the Spatial Search window: you can zoom in and out and use the mouse to draw a rectangle over the zone of interest, or you can click once on the bar next to Bounding Box and a window will appear in which you can enter the coordinates of the zone of interest (then close that window, see below). In the step 2 window below, select the ASTER option and click on Search for Granules at the bottom (the tiles are called Granules here). The results will appear in a new window. You can add the ones you re interested in to your cart one by one or you can click the button with All written above the little trolley, which will add all the tiles to your cart. You can check that the items are in the cart ( view items in cart ). If you want to download more tiles, you can use the return to links at the top left or just click on home at the top left which will take you to the home page and you will have to re-specify ASTER GDEM in the Search datasets bar. When you are finished, go to your shopping cart and place the order. Note: if you haven t logged on, the tiles will appear as not orderable. They will become orderable once you ve logged on. After clicking order, a page with your details will appear Proceed. A new page will appear with the list of tiles and a Set button next to each of them. Click on Set next to the top tile: a list of options will appear (see below).
 and tick the boxes to acknowledge that you have read: I agree to redistribute the ASTER GDEM *only* to individuals within my organization or project of intended use or in response to")
3 Select the relevant data usage (e.g. Water ) and tick the boxes to acknowledge that you have read: I agree to redistribute the ASTER GDEM *only* to individuals within my organization or project of intended use or in response to disasters in support of the GEO Disaster Theme. When presenting or publishing ASTER GDEM data, I agree to include "ASTER GDEM is a product of METI and NASA." If you let the little box at the bottom ticked, this will apply to all the tiles in your cart so you won t have to repeat the operation for each tile. Save, proceed to check out and submit your order. You should receive a confirmation shortly after. The instruction will follow within a couple of minutes-hours. To download the data using a Unix machine (example: adder.geos.ed.ac.uk), follow the instructions given in the - navigate to the folder where you will store the files. - ftp e4ftl01.cr.usgs.gov - enter login name anonymous and use your address as password. - bin (to set mode to binary). - cd /PullDir/ tZNqKb (name of directory given in ). - dir (to check that the files are there). - prompt off (so that the computer doesn t ask you every time if you want to download each file). - mget *.* (to download all the files,). The operation may take a bit of time if you have more than one tile but the process is usually fast (typically less than 10 seconds per tile). Then quit and logout. Step 2: getting the DEM into ArcMap If you have only one tile, just use the Add Data button in ArcMap. If you have more than one tile and want to stitch them together: Data Management Tools Raster Raster Dataset Mosaic to new Raster select the different TIFF tiles from ASTER (after unzipping the zip files). If you specify the coordinate during this step, you will end up with artefacts because you cannot specify here the resampling technique. You will specify the coordinate system later. IMPORTANT NOTE: during this operation, the default pixel type is set to 8_BIT_UNSIGNED ; this seems to be the cause of problems we have been having, such as numerous No Data pixels in the topography, typically at a given elevation. This is the solution I have been given: If the assumption can be made that the DEM has no values below sea level then the DEM should be mosaicked as 16_BIT_ UNSIGNED, otherwise 16_BIT_SIGNED, assuming that the units of height are Metres, as that will accommodate all values (something that 8 bit can t). So if you want to avoid problems, use 16 bit.
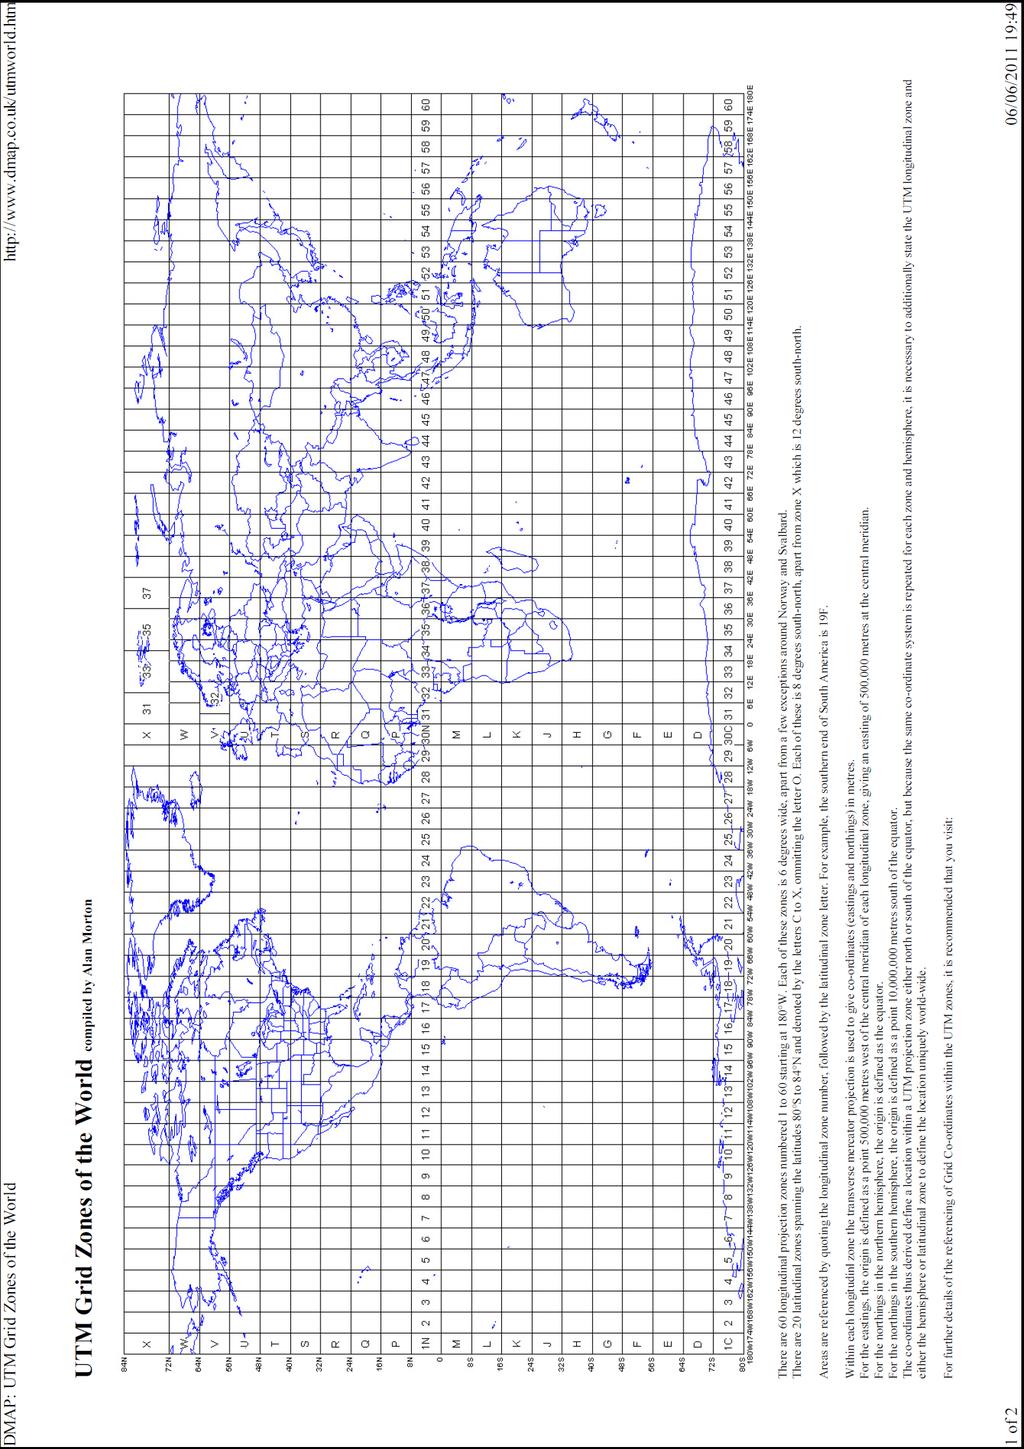
4 Note: in some cases (in particular if you have only one tile), the edges of the tiles can have anomalously high or low elevation values (e.g., m, m, m). This means that the data will not be displayed properly and it can create problem when processing the data. To eliminate these data points from the analysis, you can set them to Null: Spatial Analyst Tools Conditional SetNull. Select your raster as the input conditional raster AND the input false raster and type in the Expression box: Value < - 10 AND Value > 9000 (case and space sensitive). This means: Set to Null all the points that fulfil the statement and use the value from the input false raster every time the statement is not verified. Give a name to the output raster and click OK. This should solve your problems. Once the mosaic operation has been performed, you can choose the coordinate system. You need to choose a projected system to have coordinates in meters: Data Management Tools Projections and Transformations Raster Project Raster. Specify the input raster, then click on the button next to the output coordinate system box. These are two popular options: 1 (favourite) - Select Projected Coordinates Systems UTM WGS1984 Select the suitable zone, according to the table at the end of this handout; note that the zone refers essentially to the number as a function of longitude, and then whether it is north or south (e.g., most of the UK is 30N) you don t need to worry about the letters as a function of latitude. Specify the Resampling Technique as CUBIC click OK. OR: 2- Select Projected Coordinates Systems Continental - North America Lambert Conformal Conic.prj (for North America) - Canada Lambert Conformal Conic.prj (for Canada) - Europe Lambert Conformal Conic.prj (for Europe). In this case, ArcMap will also require the Geographic Transformation. I usually use the first one on the list because I don t really know what the numbers at the end of the transformations are. The result doesn t seem to be strongly influenced by this choice (if you have any suggestions with respect to this matter, please let me know). Specify the Resampling Technique as CUBIC click OK. Next steps: - Save the project and close ArcMap. - Reopen an empty ArcMap and import the transformed raster (using the Add Data button) so that the coordinates are displayed within the new coordinate system. - In Data Management Tools Raster Raster Processing Clip the zone of interest. This means you will create smaller files and Arc will work much faster. To clip, you need to specify the coordinates of the top, bottom, left and right extent of the area of interest, which you can obtain by hovering the mouse over the corners of the zone of interest (longitude and latitude will be displayed in the bottom right corner of the window note that if the coordinate is , it is ok to enter or , except if you are looking for a very high precision). Step 3: getting the satellite image georeferenced on top of the topography Move to the zone of interest with Google map and take a screenshot. In IrfanView (or other visualisation software), paste the screenshot and save it as a JPG. Select the area of interest with the mouse and crop it (Edit crop selection), then save it. In ArcMap, use the Add Data button and select the JPG file (don t double-click or it will just show the different layers that compose the JPG file). Make sure the Georeferencing toolbar is displayed. In the Georeferencing toolbar, use the scroll down menu to have the jpg file appearing in the layer box. Then, click on the Georeferencing button Fit to display.
5 In the Georeferencing toolbar, click on the button with the green and red crosses (make sure that the active layer in the toolbar is still the JPG image). Using this tool: click on one of the noticeable points on the JPG image (e.g. river confluence, cliff) and double click on the corresponding point on the DEM (you can hide the JPG image in the middle of the operation). The image will be translated/rotated/distorted to make the location fit (note: translation/rotation/distortion can be performed manually using the buttons in the Georeferencing toolbar). Repeat the operation for a few points. Note: it is easier to do this once the fluvial network has been traced. If you are happy with the result, click on the Georeferencing button Update Georeferencing. If you want to remove one or more points, click on the link table button just to the right of the red/green cross button: an editable table with all the tie points will appear. Step 4: visualizing the results in 3D in ArcScene Open ArcScene. Note: feel free to explore the different buttons in the toolbar, some do some pretty exciting things, e.g., the bird button (left click accelerates, right click slows down). Use the Add Data button to add the DEM. Double click on the layer in the layer window Base Heights Obtain heights from surface (select the DEM if it is not selected). You can use the Z unit conversion to enhance relief (1 is no vertical exaggeration). Add data add the jpg file which has been georeferenced. Do the same operation than above but make sure that the DEM file is selected as the Base Heights. Hide the DEM layer you should now see the landscape in 3D (like in Google Earth!). If you want to keep the satellite image wrapped onto the DEM, you may have to do a couple of operations to make sure that it is displayed above the DEM: - in the Rendering tab, you can select the drawing priority (in the effects box). If you give a priority of 1 to the satellite image and a priority of 10 to the DEM, then the image will be drawn on top of the DEM. If the image still disappears in places, you can use the offset option at the bottom of the Base Heights tab (if you put 5 meters for example, the satellite image will be systematically displayed 5 m above the DEM). Possible additions (so that it is better than Google Earth!): you can add catchments, fluvial networks, slope map, geological maps, etc. M. Attal, Jan. 2017
6
Download elevation model page 2 Re-Project DEM coordinates page 5 Cut region of interest page 10
 1 Download elevation model page 2 Re-Project DEM coordinates page 5 Cut region of interest page 10 Version June 2017, Dr. Jonas von Rütte, Dr. Peter Lehmann 2 Download elevation model for region of interest:
GeoEarthScope NoCAL San Andreas System LiDAR pre computed DEM tutorial
 GeoEarthScope NoCAL San Andreas System LiDAR pre computed DEM tutorial J Ramón Arrowsmith Chris Crosby School of Earth and Space Exploration Arizona State University ramon.arrowsmith@asu.edu http://lidar.asu.edu
16) After contour layer is chosen, on column height_field, choose Elevation, and on tag_field column, choose <None>. Click OK button.
 After contour layer is chosen, on column height_field, choose Elevation, and on tag_field column, choose <None>. Click OK button.") 16) After contour layer is chosen, on column height_field, choose Elevation, and on tag_field column, choose . Click OK button. 17) The process of TIN making will take some time. Various process
16) After contour layer is chosen, on column height_field, choose Elevation, and on tag_field column, choose . Click OK button. 17) The process of TIN making will take some time. Various process
Tutorial 1: Downloading elevation data
 Tutorial 1: Downloading elevation data Objectives In this exercise you will learn how to acquire elevation data from the website OpenTopography.org, project the dataset into a UTM coordinate system, and
CHAPTER 5 DIGITAL ELEVATION MODEL AND 3D VISUALIZATION
 CHAPTER 5 DIGITAL ELEVATION MODEL AND 3D VISUALIZATION A digital elevation model (DEM) is a digital model or 3D representation of a terrain's surface. A DEM can be represented as a raster (a grid of squares,
Creating Contours using ArcMap
 Creating Contours with ArcMap and ArcScene Digital elevation models (DEMs) are geospatial datasets that contain elevation values sampled according to a regularly spaced rectangular grid. They can be used
Lab 7: Bedrock rivers and the relief structure of mountain ranges
 Lab 7: Bedrock rivers and the relief structure of mountain ranges Objectives In this lab, you will analyze the relief structure of the San Gabriel Mountains in southern California and how it relates to
Files Used in this Tutorial
 RPC Orthorectification Tutorial In this tutorial, you will use ground control points (GCPs), an orthorectified reference image, and a digital elevation model (DEM) to orthorectify an OrbView-3 scene that
GEO 465/565 - Lab 7 Working with GTOPO30 Data in ArcGIS 9
 GEO 465/565 - Lab 7 Working with GTOPO30 Data in ArcGIS 9 This lab explains how work with a Global 30-Arc-Second (GTOPO30) digital elevation model (DEM) from the U.S. Geological Survey. This dataset can
WMS 9.1 Tutorial Watershed Modeling DEM Delineation Learn how to delineate a watershed using the hydrologic modeling wizard
 v. 9.1 WMS 9.1 Tutorial Learn how to delineate a watershed using the hydrologic modeling wizard Objectives Read a digital elevation model, compute flow directions, and delineate a watershed and sub-basins
Raster: The Other GIS Data
 Raster_The_Other_GIS_Data.Docx Page 1 of 11 Raster: The Other GIS Data Objectives Understand the raster format and how it is used to model continuous geographic phenomena. Understand how projections &
Working with Elevation Data URPL 969 Applied GIS Workshop: Rethinking New Orleans After Hurricane Katrina Spring 2006
 Working with Elevation Data URPL 969 Applied GIS Workshop: Rethinking New Orleans After Hurricane Katrina Spring 2006 This GIS lab exercise will explore Light Detection And Ranging (LiDAR) data for New
_Tutorials. Arcmap. Linking additional files outside from Geodata
 _Tutorials Arcmap Linking additional files outside from Geodata 2017 Sourcing the Data (Option 1): Extracting Data from Auckland Council GIS P1 First you want to get onto the Auckland Council GIS website
Making flow direction data
 Step 4. Making flow direction data Training Module 1) The first step in hydrology analysis is making flow direction data. On Arc Toolbox window, click symbol + on Spatial Analyst Tools Hydrology, double
GIS Workbook #1. GIS Basics and the ArcGIS Environment. Helen Goodchild
 GIS Basics and the ArcGIS Environment Helen Goodchild Overview of Geographic Information Systems Geographical Information Systems (GIS) are used to display, manipulate and analyse spatial data (data that
I CALCULATIONS WITHIN AN ATTRIBUTE TABLE
 Geology & Geophysics REU GPS/GIS 1-day workshop handout #4: Working with data in ArcGIS You will create a raster DEM by interpolating contour data, create a shaded relief image, and pull data out of the
Files Used in this Tutorial
 RPC Orthorectification Tutorial In this tutorial, you will use ground control points (GCPs), an orthorectified reference image, and a digital elevation model (DEM) to orthorectify an OrbView-3 scene that
Learn how to delineate a watershed using the hydrologic modeling wizard
 v. 11.0 WMS 11.0 Tutorial Learn how to delineate a watershed using the hydrologic modeling wizard Objectives Import a digital elevation model, compute flow directions, and delineate a watershed and sub-basins
Digital Elevation Models
 Digital Elevation Models National Elevation Dataset 1 Data Sets US DEM series 7.5, 30, 1 o for conterminous US 7.5, 15 for Alaska US National Elevation Data (NED) GTOPO30 Global Land One-kilometer Base
Introduction to GIS 2011
 Introduction to GIS 2011 Digital Elevation Models CREATING A TIN SURFACE FROM CONTOUR LINES 1. Start ArcCatalog from either Desktop or Start Menu. 2. In ArcCatalog, create a new folder dem under your c:\introgis_2011
GIS LAB 8. Raster Data Applications Watershed Delineation
 GIS LAB 8 Raster Data Applications Watershed Delineation This lab will require you to further your familiarity with raster data structures and the Spatial Analyst. The data for this lab are drawn from
I. An Intro to ArcMap Version 9.3 and 10. 1) Arc Map is basically a build your own Google map
 Arc Map is basically a build your own Google map") I. An Intro to ArcMap Version 9.3 and 10 What is Arc Map? 1) Arc Map is basically a build your own Google map a. Display and manage geo-spatial data (maps, images, points that have a geographic location)
I. An Intro to ArcMap Version 9.3 and 10 What is Arc Map? 1) Arc Map is basically a build your own Google map a. Display and manage geo-spatial data (maps, images, points that have a geographic location)
USING CCCR S AERIAL PHOTOGRAPHY IN YOUR OWN GIS
 USING CCCR S AERIAL PHOTOGRAPHY IN YOUR OWN GIS Background: In 2006, the Centre for Catchment and Coastal Research purchased 40 cm resolution aerial photography for the whole of Wales. This product was
Biodiversity Interactive Map
 Powered by MapShare Biodiversity Interactive Map (BIM) User Tips The Biodiversity Interactive Map (BIM) is accessible via the Department of Environment and Primary Industries (DEPI) website at www.depi.vic.gov.au.
In this lab, you will create two maps. One map will show two different projections of the same data.
 Projection Exercise Part 2 of 1.963 Lab for 9/27/04 Introduction In this exercise, you will work with projections, by re-projecting a grid dataset from one projection into another. You will create a map
Lab 18c: Spatial Analysis III: Clip a raster file using a Polygon Shapefile
 Environmental GIS Prepared by Dr. Zhi Wang, CSUF EES Department Lab 18c: Spatial Analysis III: Clip a raster file using a Polygon Shapefile These instructions enable you to clip a raster layer in ArcMap
Opening Canadian Digital Elevation Data Files in ArcMap 9.x
 Opening Canadian Digital Elevation Data Files in ArcMap 9.x These procedures outline: 1. Downloading spatial data from the GeoBase website (accessed through the Ryerson University Library website) 2. Uncompressing
CONTENTS 1 INTRODUCTION 3 ARCGIS 5 START ARCMAP 11 IMPORT 1: MAP DATA 12 ADD WIND FARM DATA 21 CREATE A MAP TO INSERT IN A REPORT 32
 CONTENTS CONTENTS 1 INTRODUCTION 3 SCENARIO 3 WHAT WILL I LEARN? 3 WHAT DATA DO I HAVE? 4 ARCGIS 5 ARCMAP 6 ARCCATALOG 8 ARCTOOLBOX 9 START ARCMAP 11 IMPORT 1:250000 MAP DATA 12 CREATE A GROUP LAYER 16
Terrain and Imagery Tutorial. Contents. By: Brian Zager
 Terrain and Imagery Tutorial By: Brian Zager http://www.zagerdesign.com/golf_design/ This tutorial provides and overview on how terrain data and overhead imagery are used to create real courses or courses
Geographical Information Systems Institute. Center for Geographic Analysis, Harvard University. LAB EXERCISE 1: Basic Mapping in ArcMap
 Harvard University Introduction to ArcMap Geographical Information Systems Institute Center for Geographic Analysis, Harvard University LAB EXERCISE 1: Basic Mapping in ArcMap Individual files (lab instructions,
GSSHA WMS Basics Loading DEMs, Contour Options, Images, and Projection Systems
 v. 10.0 WMS 10.0 Tutorial GSSHA WMS Basics Loading DEMs, Contour Options, Images, and Projection Systems Learn how to work with DEMs and images and to convert between projection systems in the WMS interface
GEOGRAPHIC INFORMATION SYSTEMS Lecture 25: 3D Analyst
 GEOGRAPHIC INFORMATION SYSTEMS Lecture 25: 3D Analyst 3D Analyst - 3D Analyst is an ArcGIS extension designed to work with TIN data (triangulated irregular network) - many of the tools in 3D Analyst also
Introduction to using QGIS for Archaeology and History Workshop by the Empirical Reasoning Center
 Introduction to using QGIS for Archaeology and History Workshop by the Empirical Reasoning Center In this workshop, we will cover the basics of working with spatial data, as well as its main uses for archaeology.
Lesson 8 : How to Create a Distance from a Water Layer
 Created By: Lane Carter Advisor: Paul Evangelista Date: July 2011 Software: ArcGIS 10 Lesson 8 : How to Create a Distance from a Water Layer Background This tutorial will cover the basic processes involved
Geology & Geophysics REU GPS/GIS 1-day workshop handout #3: Working with data in ArcGIS
 Geology & Geophysics REU GPS/GIS 1-day workshop handout #3: Working with data in ArcGIS In this lab you ll start to use some basic ArcGIS routines to display your data. These include overlaying data on
Create Geomark in Google Earth Tutorial
 Create Geomark in Google Earth Tutorial General business example a potential applicant / user wants to create an area of interest that can be shared electronically to another party eg: another agency,
Objectives Learn how to work with projections in SMS, and how to combine data from different coordinate systems into the same SMS project.
 v. 12.2 SMS 12.2 Tutorial Working with map projections in SMS Objectives Learn how to work with projections in SMS, and how to combine data from different coordinate systems into the same SMS project.
Part 6b: The effect of scale on raster calculations mean local relief and slope
 Part 6b: The effect of scale on raster calculations mean local relief and slope Due: Be done with this section by class on Monday 10 Oct. Tasks: Calculate slope for three rasters and produce a decent looking
Geology & Geophysics REU GPS/GIS 1-day workshop handout #2: Importing Field Data to ArcGIS
 Geology & Geophysics REU GPS/GIS 1-day workshop handout #2: Importing Field Data to ArcGIS In this lab you ll start to use some basic ArcGIS routines. These include importing GPS field data and creating
Introduction to GIS A Journey Through Gale Crater
 Introduction to GIS A Journey Through Gale Crater In this lab you will be learning how to use ArcMap, one of the most common commercial software packages for GIS (Geographic Information System). Throughout
A Practical Guide to Using QGIS
 A Practical Guide to Using QGIS 1.1 INTRODUCTION Quantum GIS (QGIS) is a useful mapping software that enables the compilation and displaying of spatial data in the form of a map. Gaining experience in
A Second Look at DEM s
 A Second Look at DEM s Overview Detailed topographic data is available for the U.S. from several sources and in several formats. Perhaps the most readily available and easy to use is the National Elevation
ATNS. USING Google EARTH. Version 1
 ATNS USING Google EARTH Version 1 ATNS/HO/Using Google Earth Page 1 25/04/2013 CONTENTS 1. BASIC SETUP 2. NAVIGATING IN GOOGLE EARTH 3. ADDING OBJECTS TO GOOGLE EARTH 4. USER HELP REFERENCES ATNS/HO/Using
NEXTMap World 30 Digital Surface Model
 NEXTMap World 30 Digital Surface Model Intermap Technologies, Inc. 8310 South Valley Highway, Suite 400 Englewood, CO 80112 083013v3 NEXTMap World 30 (top) provides an improvement in vertical accuracy
Using rasters for interpolation and visualization in GMS
 v. 10.3 GMS 10.3 Tutorial Using rasters for interpolation and visualization in GMS Objectives This tutorial teaches how GMS uses rasters to support all kinds of digital elevation models and how rasters
Learn how to delineate a watershed using the hydrologic modeling wizard
 v. 10.1 WMS 10.1 Tutorial Learn how to delineate a watershed using the hydrologic modeling wizard Objectives Import a digital elevation model, compute flow directions, and delineate a watershed and sub-basins
Lab 12: Sampling and Interpolation
 Lab 12: Sampling and Interpolation What You ll Learn: -Systematic and random sampling -Majority filtering -Stratified sampling -A few basic interpolation methods Videos that show how to copy/paste data
STUDENT PAGES GIS Tutorial Treasure in the Treasure State
 STUDENT PAGES GIS Tutorial Treasure in the Treasure State Copyright 2015 Bear Trust International GIS Tutorial 1 Exercise 1: Make a Hand Drawn Map of the School Yard and Playground Your teacher will provide
Objectives Learn how to work with projections in GMS, and how to combine data from different coordinate systems into the same GMS project.
 v. 10.2 GMS 10.2 Tutorial Working with map projections in GMS Objectives Learn how to work with projections in GMS, and how to combine data from different coordinate systems into the same GMS project.
THE HONG KONG POLYTECHNIC UNIVERSITY DEPARTMENT OF LAND SURVEYING & GEO-INFORMATICS LSGI521 PRINCIPLES OF GIS
 THE HONG KONG POLYTECHNIC UNIVERSITY DEPARTMENT OF LAND SURVEYING & GEO-INFORMATICS LSGI521 PRINCIPLES OF GIS Student name: Student ID: Table of Content Working with files, folders, various software and
Taking Advantage of the Explosion in Online Imagery with Autodesk Raster Design.
 11/28/2005-1:00 pm - 2:30 pm Room:Osprey 2 [Lab] (Swan) Walt Disney World Swan and Dolphin Resort Orlando, Florida Taking Advantage of the Explosion in Online Imagery with Autodesk Raster Design. Gary
GY461 GIS 1: Environmental Campus Topography Project with ArcGIS 9.x
 I. Introduction GY461 GIS 1: Environmental In this project you will use data from a topographic survey of the USA campus to generate 2 separate maps: 1. A color-coded 2-dimensional topographic contour
2) Make sure that the georeferencing extension is on by right-clicking in the task bar area and selecting Georeferencing
 Make sure that the georeferencing extension is on by right-clicking in the task bar area and selecting Georeferencing") HGIS Workshop Module 1 Georeferencing Large Scale Scanned Historical Maps Objective: Learn the Principles of Georeferencing 1) In ArcMap, open the project 01 data\arcdata_10_1\arcdata\toronto\georeference.mxd
HGIS Workshop Module 1 Georeferencing Large Scale Scanned Historical Maps Objective: Learn the Principles of Georeferencing 1) In ArcMap, open the project 01 data\arcdata_10_1\arcdata\toronto\georeference.mxd
NV CCS USER S GUIDE V1.1 ADDENDUM
 NV CCS USER S GUIDE V1.1 ADDENDUM PAGE 1 FOR CREDIT PROJECTS THAT PROPOSE TO MODIFY CONIFER COVER Released 5/19/2016 This addendum provides instructions for evaluating credit projects that propose to treat
Import, view, edit, convert, and digitize triangulated irregular networks
 v. 10.1 WMS 10.1 Tutorial Import, view, edit, convert, and digitize triangulated irregular networks Objectives Import survey data in an XYZ format. Digitize elevation points using contour imagery. Edit
A step by step introduction to TopoFlight
 November 20, 2014 TopoFlight_First_Steps.docx 2004057./KB/04 A step by step introduction to TopoFlight Content 1 Introduction...2 2 Creating the area of interest with GoogleEarth...2 3 Creating the TopoFlight
Assembling Datasets for Species Distribution Models. GIS Cyberinfrastructure Course Day 3
 Assembling Datasets for Species Distribution Models GIS Cyberinfrastructure Course Day 3 Objectives Assemble specimen-level data and associated covariate information for use in a species distribution model
Easy way to making a photo-realistic Condor scenery
 Easy way to making a photo-realistic Condor scenery by Luis Briones Introduction First at all, sorry for my English. This not pretend be an original work. It's only a way that I can make a scenery. I had
CRC Website and Online Book Materials Page 1 of 16
 Page 1 of 16 Appendix 2.3 Terrain Analysis with USGS DEMs OBJECTIVES The objectives of this exercise are to teach readers to: Calculate terrain attributes and create hillshade maps and contour maps. use,
Terrain Analysis. Using QGIS and SAGA
 Terrain Analysis Using QGIS and SAGA Tutorial ID: IGET_RS_010 This tutorial has been developed by BVIEER as part of the IGET web portal intended to provide easy access to geospatial education. This tutorial
Exercise 2-DEM downloading
 Exercise 2-DEM downloading Downloading and importing DEM in to ILWIS 1.1. PURPOSE The purpose with this exercise is to exemplify how to download a DEM to your area of interest, import it to your GIS software
NEXTMap World 10 Digital Elevation Model
 NEXTMap Digital Elevation Model Intermap Technologies, Inc. 8310 South Valley Highway, Suite 400 Englewood, CO 80112 10012015 NEXTMap (top) provides an improvement in vertical accuracy and brings out greater
UNDERSTAND HOW TO SET UP AND RUN A HYDRAULIC MODEL IN HEC-RAS CREATE A FLOOD INUNDATION MAP IN ARCGIS.
 CE 412/512, Spring 2017 HW9: Introduction to HEC-RAS and Floodplain Mapping Due: end of class, print and hand in. HEC-RAS is a Hydrologic Modeling System that is designed to describe the physical properties
TerrainOnDemand ArcGIS
 TM TerrainOnDemand ArcGIS Connect to Intermap Technologies NEXTMap data within: ArcGIS Desktop 9.3.1 and Above AGDQS0312 TerrainOnDemand ArcGIS 2 TerrainOnDemand ArcGIS Table of Contents 1. Introduction...1
Exercise Lab: Where is the Himalaya eroding? Using GIS/DEM analysis to reconstruct surfaces, incision, and erosion
 Exercise Lab: Where is the Himalaya eroding? Using GIS/DEM analysis to reconstruct surfaces, incision, and erosion 1) Start ArcMap and ensure that the 3D Analyst and the Spatial Analyst are loaded and
Lecture 22 - Chapter 8 (Raster Analysis, part 3)
") GEOL 452/552 - GIS for Geoscientists I Lecture 22 - Chapter 8 (Raster Analysis, part 3) Today: Zonal Analysis (statistics) for polygons, lines, points, interpolation (IDW), Effects Toolbar, analysis masks
GEOL 452/552 - GIS for Geoscientists I Lecture 22 - Chapter 8 (Raster Analysis, part 3) Today: Zonal Analysis (statistics) for polygons, lines, points, interpolation (IDW), Effects Toolbar, analysis masks
Lab 1: Landuse and Hydrology, learning ArcGIS
 Lab 1: Landuse and Hydrology, learning ArcGIS The following lab exercises are designed to give you experience using ArcMap in order to visualize and analyze datasets that are relevant to important geomorphological/
Lecture 21 - Chapter 8 (Raster Analysis, part2)
") GEOL 452/552 - GIS for Geoscientists I Lecture 21 - Chapter 8 (Raster Analysis, part2) Today: Digital Elevation Models (DEMs), Topographic functions (surface analysis): slope, aspect hillshade, viewshed,
GEOL 452/552 - GIS for Geoscientists I Lecture 21 - Chapter 8 (Raster Analysis, part2) Today: Digital Elevation Models (DEMs), Topographic functions (surface analysis): slope, aspect hillshade, viewshed,
Smart GIS Course. Developed By. Mohamed Elsayed Elshayal. Elshayal Smart GIS Map Editor and Surface Analysis. First Arabian GIS Software
 Smart GIS Course Developed By Mohamed Elsayed Elshayal Elshayal Smart GIS Map Editor and Surface Analysis First Arabian GIS Software http://www.freesmartgis.blogspot.com/ http://tech.groups.yahoo.com/group/elshayalsmartgis/
Module: Rasters. 8.1 Lesson: Working with Raster Data Follow along: Loading Raster Data CHAPTER 8
 CHAPTER 8 Module: Rasters We ve used rasters for digitizing before, but raster data can also be used directly. In this module, you ll see how it s done in QGIS. 8.1 Lesson: Working with Raster Data Raster
Map Blending Using Combiners Map to Image Combinations
 Map Blending Using Combiners Map to Image Combinations Version 1.0 Mark Lucas 24 May 2005 Overview Studying the different combiner modes in OSSIM OSSIM and ImageLinker provide several ways to combine geo-spatial
Using LIDAR to Design Embankments in ArcGIS. Written by Scott Ralston U.S. Fish & Wildlife Service Windom Wetland Management District
 Using LIDAR to Design Embankments in ArcGIS Written by Scott Ralston U.S. Fish & Wildlife Service Windom Wetland Management District This tutorial covers the basics of how to design a dike, embankment
Introduction to InfraWorks 360 for Civil
 Eric Chappell Autodesk Aimed at Civil industry professional, this class will cover basic importing of data sources to make an existing model, followed by creation of roads, buildings, and city furniture
Mosaic Tutorial: Advanced Workflow
 Mosaic Tutorial: Advanced Workflow This tutorial demonstrates how to mosaic two scenes with different color variations. You will learn how to: Reorder the display of the input scenes Achieve a consistent
Technical Specifications
 1 Contents INTRODUCTION...3 ABOUT THIS LAB...3 IMPORTANCE OF THIS MODULE...3 EXPORTING AND IMPORTING DATA...4 VIEWING PROJECTION INFORMATION...5...6 Assigning Projection...6 Reprojecting Data...7 CLIPPING/SUBSETTING...7
Files Used in this Tutorial
 Generate Point Clouds and DSM Tutorial This tutorial shows how to generate point clouds and a digital surface model (DSM) from IKONOS satellite stereo imagery. You will view the resulting point clouds
Basics of Using LiDAR Data
 Conservation Applications of LiDAR Basics of Using LiDAR Data Exercise #2: Raster Processing 2013 Joel Nelson, University of Minnesota Department of Soil, Water, and Climate This exercise was developed
Geological mapping using open
 Geological mapping using open source QGIS MOHSEN ALSHAGHDARI -2017- Abstract Geological mapping is very important to display your field work in a map for geologist and others, many geologists face problems
Guided tour through SoundPLAN 8.0
 Guided tour through SoundPLAN 8.0 You can join this tour with all SoundPLAN 8.0 installations, even with the demo version. Launch SoundPLAN and open a project with the Open project - icon or via the menu
Lab 1: Introduction to ArcGIS
 Lab 1: Introduction to ArcGIS Objectives In this lab you will: 1) Learn the basics of the software package we will be using for the remainder of the semester, and 2) Discover the role that climate and
Image Services for Elevation Data
 Image Services for Elevation Data Peter Becker Need for Elevation Using Image Services for Elevation Data sources Creating Elevation Service Requirement: GIS and Imagery, Integrated and Accessible Field
Objectives Learn how to work with projections in SMS, and how to combine data from different coordinate systems into the same SMS project.
 v. 12.3 SMS 12.3 Tutorial Working with map projections in SMS Objectives Learn how to work with projections in SMS, and how to combine data from different coordinate systems into the same SMS project.
Introduction to LiDAR
 Introduction to LiDAR Our goals here are to introduce you to LiDAR data, to show you how to download it for an area of interest, and to better understand the data and uses through some simple manipulations.
Server Usage & Third-Party Viewers
 Server Usage & Third-Party Viewers October 2016 HiPER LOOK Version 1.4.16.0 Copyright 2015 PIXIA Corp. All Rights Reserved. Table of Contents HiPER LOOK Server Introduction... 2 Google Earth... 2 Installation...2
CFU RASTER FORMAT SPECIFICATION
 Name: "MyNav CFU format" Version: 1 MyNav compatibility: v6.3.0.0 and above Date of publishing: November 18 th, 2010 Introduction CFU RASTER FORMAT SPECIFICATION The MyNav raster format is compatible with
Final project: Lecture 21 - Chapter 8 (Raster Analysis, part2) GEOL 452/552 - GIS for Geoscientists I
 GEOL 452/552 - GIS for Geoscientists I") GEOL 452/552 - GIS for Geoscientists I Lecture 21 - Chapter 8 (Raster Analysis, part2) Talk about class project (copy follow_along_data\ch8a_class_ex into U:\ArcGIS\ if needed) Catch up with lecture 20
GEOL 452/552 - GIS for Geoscientists I Lecture 21 - Chapter 8 (Raster Analysis, part2) Talk about class project (copy follow_along_data\ch8a_class_ex into U:\ArcGIS\ if needed) Catch up with lecture 20
Open Source Cloud Map User Guide
 Open Source Cloud Map User Guide Table of Contents Map Page... 1 Static Mercator Map... 1 Customizable Map... 1 Title Bar... 2 Toolbar... 2 Non Toolbar Navigation... 3 Map Window... 3 Layers / Legend Window...
INTRODUCTION TO GIS WORKSHOP EXERCISE
 111 Mulford Hall, College of Natural Resources, UC Berkeley (510) 643-4539 INTRODUCTION TO GIS WORKSHOP EXERCISE This exercise is a survey of some GIS and spatial analysis tools for ecological and natural
Steps for Modeling a Proposed New Reservoir in GIS
 Steps for Modeling a Proposed New Reservoir in GIS Requirements: ArcGIS ArcMap, ArcScene, Spatial Analyst, and 3D Analyst There s a new reservoir proposed for Right Hand Fork in Logan Canyon. I wanted
Generate Glacier Velocity Maps with the Sentinel-1 Toolbox
 Making remote-sensing data accessible since 1991 Generate Glacier Velocity Maps with the Sentinel-1 Toolbox Adapted from the European Space Agency s STEP community platform In this document you will find:
Exercise 03 Creating and Editing Shapefiles Assigned Feb. 2, 2018 Due Feb. 9, 2018
 Exercise 03 Creating and Editing Shapefiles Assigned Feb. 2, 2018 Due Feb. 9, 2018 On the class website I've posted an exercise_03_data.zip file which contains a USGS 7.5' quad map of Laramie (as laramie_quad_usgs_1963.tiff)
MODULE 1 BASIC LIDAR TECHNIQUES
 MODULE SCENARIO One of the first tasks a geographic information systems (GIS) department using lidar data should perform is to check the quality of the data delivered by the data provider. The department
Introduction to Google Earth
 Introduction to Google Earth Assignment: The goal of this assignment is for you to become familiar with Google Earth. You may work alone or with a partner but you must turn in your own individual work.
An Introduction to Geographic Information Systems (GIS) using ArcGIS 9.2
 using ArcGIS 9.2") An Introduction to Geographic Information Systems (GIS) using ArcGIS 9.2 by Marcel Fortin, GIS and Map Librarian, University of Toronto Libraries, 2009 gis.maps@utoronto.ca http://www.library.utoronto.ca/maplib/
An Introduction to Geographic Information Systems (GIS) using ArcGIS 9.2 by Marcel Fortin, GIS and Map Librarian, University of Toronto Libraries, 2009 gis.maps@utoronto.ca http://www.library.utoronto.ca/maplib/
COPYRIGHTED MATERIAL. Introduction to 3D Data: Modeling with ArcGIS 3D Analyst and Google Earth CHAPTER 1
 CHAPTER 1 Introduction to 3D Data: Modeling with ArcGIS 3D Analyst and Google Earth Introduction to 3D Data is a self - study tutorial workbook that teaches you how to create data and maps with ESRI s
Importing CDED (Canadian Digital Elevation Data) into ArcGIS 9.x
 into ArcGIS 9.x") Importing CDED (Canadian Digital Elevation Data) into ArcGIS 9.x Related Guides: Obtaining Canadian Digital Elevation Data (CDED) Importing Canadian Digital Elevation Data (CDED) into ArcView 3.x Requirements:
Importing CDED (Canadian Digital Elevation Data) into ArcGIS 9.x Related Guides: Obtaining Canadian Digital Elevation Data (CDED) Importing Canadian Digital Elevation Data (CDED) into ArcView 3.x Requirements:
GGR 375 QGIS Tutorial
 GGR 375 QGIS Tutorial With text taken from: Sherman, Gary E. Shuffling Quantum GIS into the Open Source GIS Stack. Free and Open Source Software for Geospatial (FOSS4G) Conference. 2007. Available online
Exercise 1: Introduction to ILWIS with the Riskcity dataset
 Exercise 1: Introduction to ILWIS with the Riskcity dataset Expected time: 2.5 hour Data: data from subdirectory: CENN_DVD\ILWIS_ExerciseData\IntroRiskCity Objectives: After this exercise you will be able
GIS.XL. User manual of Excel add-in for spatial data analysis and visualization.
 GIS.XL User manual of Excel add-in for spatial data analysis and visualization http://gisxl.com Content 1 Introduction... 2 2 Requirements... 3 3 Installation... 4 4 Uninstallation... 7 5 Add-in Setup...
Pictometry for ArcGIS Desktop Local Guide For ArcGIS Desktop Version 10.3
 for ArcGIS Desktop Local Guide For ArcGIS Desktop Version 10.3 June 2015 Copyright 2010-2015 International Corp. All rights reserved. No part of this publication may be reproduced, stored in a retrieval