DATA PLOTTING WITH MATLAB
|
|
|
- Shona Holmes
- 6 years ago
- Views:
Transcription

1 DATA PLOTTING WITH MATLAB Prof. Marco Pilotti Dr. Giulia Valerio Giulia Valerio 7Marzo


2 1. WHY MATLAB? WHY MATLAB? Matlab is a high-level programming language that provides a numerical computing environment for algorithms development, data visualization and data analysis The use of Matlab is more appropriate in the following cases: If you have to evaluate large amounts of data that are acquired automatically by means of computers and other technical appliances. If you want to develop general programmed data evaluation routines to be applied to different set of data. The application of these routines is a more efficient way if the evaluation procedure has to be changed over and over again to 'fine-tune' it. Re-calculating the whole data set with the changed procedure is then done in a snap. If you need graphics functions and dedicated statistics functions as well as other interesting features which are not available in other software packages. 2

3 1. WHY MATLAB? At the end of this lesson you will be able to ps_solve/player.html 3


4 2. MATLAB ENVIRONMENT MATLAB ENVIRONMENT THE USER INTERFACE Introduction to Matlab 5. Matlab's help system is an indispensable aid for beginners as well 4. The «Workspace» as experienced is the working users. It makes a memory of Matlab. printed It manual stores unnecessary. the used Here you variables on which can programs also find DEMOS, operate.. the on-line tutorials. Otherwise, see 1. The «Command Window» area is the communication channel between 2. In the the user window and the «Command Matlab program. History» Here, you commands can be entered, 3. The «Current and programs Directory» can output browser results is used and messages. to access the Warnings, computer's find the commands you have entered error file messages system. and There, the you like can are select also shown the current here. In directory the Command for data throughout the current session in the Window, previously storage entered as well as commands the root can directory be repeated for the with editor. command window. the keys <arrow up> and <arrow down>, and then changed and re-executed. 4


5 3. MATLAB FUNDAMENTALS COMMANDS SINGLE COMMANDS in the Command window GROUPS OF COMMANDS in the Matlab editor Introduction to Matlab SCRIPTS You have to type any valid command in the Matlab editor and then save the script as Namefile.m. Back in the Command window, typing Namefile Matlab will execute all the commands written in Nomefile.m Notes: %. to make comments a = 3; without ; shows the variables in the Command window; without doesn t 5


6 4. DATA MANIPULATION PRACTICE Today we will plot some of the data measured by the monitoring station active on Lake Iseo, showing some peculiar aspect of the thermal and hydrodynamic behaviour of this water body 6
7 3. MATLAB FUNDAMENTALS READING AND DEFINING VARIABLES A variable is MATRIX, with elements identified by their position EXTRACT SINGLE ELEMENTS rv1(2) read the second element of the vector m1(2, 3) read the element of the matrix m1 in the 2nd row and 3th column m1(end, 3:4) read the element of the matrix m1 in the last row, 3th and 4th column EXTRACTSINGLE ELEMENTS AND CREATE NEW VAR FUNCTION datenum m2 = m1(2, 3) read back the element of the matrix in the 2nd row and 3th column and assign it to a new variable m2 datenum([aaaa mm dd hh mi ss]) converts a date to a single number [days] that matlab uses to manage time series of data. aaaa is the year, mm is the month, dd is the day, hh is the hour, mi is the minute and ss is the second 7

8 3. MATLAB FUNDAMENTALS READING AND DEFINING VARIABLES 8
9 3. MATLAB FUNDAMENTALS IMPORTING DATA A. Import through the IMPORT WIZAD A1. In the Current folder go to the directory of interest A2. Select the file and right click on Import A3. Specify the Import parameters A4. You will se the data in the Workspace B. Import PROGRAMMATICALLY B1. cd Nomepath B2. new_var = importdata( Nomefile.txt ) new_var = importdata(filename, delimiter, nheaderlines); B3. You will se the new_var in the Workspace Editing >> doc fileformats you will see the help page where to find more about the supported filetypes and how to extract them 9
10 3. MATLAB FUNDAMENTALS A. Saving MANUALLY from the workspace A1. Select with the CNTR-key A2. Right-click on one of the variable and select Save as A3. Specify the folder and the Nomefile.mat B. Saving PROGRAMMATICALLY Save(filename) stores all variables from the current workspace in a MATLAB formatted binary file (MAT-file) called filename Introduction to Matlab save(filename, variables) stores only the specified variables. Matlab FIGURES can be saved into.fig files or exported as.tif.jpg file see Figure File- Export set up 10

11 3. MATLAB FUNDAMENTALS SAVING AND LOADING DATA Matlab DATA can be easily stored into formatted binary.mat files 11
12 3. MATLAB FUNDAMENTALS PRACTICE We want to analyze the hydrodynamic conditions that were observed between 01 and 10 August 2011 in Lake Iseo. Load the data by by following the instructions in the data.m script. Select the directory where you saved the files Import the temperature.txt file and meteo.txt with the data set measured by the floating station. Meteo.txt includes air temperature, wind and radiation data as a function of time. Temperature.txt include the water temperature data measured at 21 depths as a function of time Extract the series of time, windspeed, winddirection, temperature and depth in variables called wspeed, wdir, temp and depth. Keep on the workspace only these last variables and save them as a Iseo.mat file 12
13 2D PLOTTING FUNCTIONS 4. DATA PLOTTING MATLAB FOR DATA PLOTTING VISUALIZING DATA - OVERVIEW 13
14 3D PLOTTING FUNCTIONS 4. DATA PLOTTING VISUALIZING DATA - OVERVIEW 14
15 4. DATA PLOTTING VISUALIZING DATA FIGURE PROPERTIES figure create a figure window clf clear the contents of a figure window close, close all close figure(s) hold on, hold off fixate graph, or release fixation subplot create or address sub-figures Introduction to Matlab set(gcf, 'property', parameter); gcf = get current figure handle Change the properties of a figure window by means of argument pairs, such as: Name, Color, Position, Toolbar, Visible 15
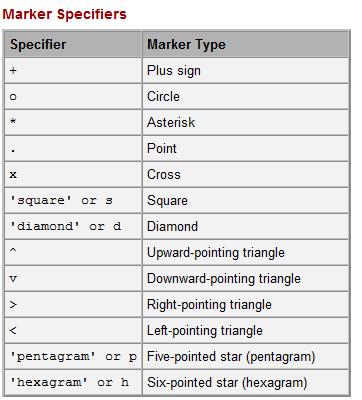
16 4. DATA PLOTTING VISUALIZING DATA PLOT TOOLS plot(x1,y1,...,xn,yn) plots each vector Yn versus vector Xn on the same axes. If one of Yn or Xn is a matrix and the other is a vector, it plots the vector versus the matrix row or column with a matching dimension to the vector. If Xn is a scalar and Yn is a vector, it plots discrete Yn points vertically at Xn. If Xn or Yn are matrices, they must be 2-D and the same size, and the columns of Yn are plotted against the columns of Xn. plot(...,'propertyname',propertyvalue,...) manipulates plot characteristics You can find all the properties at: Among them, the following are particularly useful: LineStyle: the style of the line (standard, dotted, dashed etc.) LineWidth : the width of the line Marker: the style of the data point markers (dot, circle, triangle, star ) Color : the color of the curve 16


17 4. DATA PLOTTING VISUALIZING DATA PLOT TOOLS Example: plot(x1,y1, LineStyle, -, Color,'b','Linewidth',2) = plot(x1,y1, -b,'linewidth',2) 17
18 4. DATA PLOTTING VISUALIZING DATA FIGURE AXES xlabel, ylabel, zlabel label an axis datetick label the axis with a data format (e.g. 01 Jul 2011) grid on, grid off show or hide the grid axis on, axis off show or hide the axes axis([xmin xmax ymin ymax]) set axis limits axis equal impose the same scale for the axis Introduction to Matlab set(gca, 'property', parameter); gca = get current axeshandle Change the properties of an axes (see ) Among them, the following are particularly useful: FontName, FontSize, XLim, Ylim, Xlabel, Ylabel, Xtick, Ytick Example: set(gca, 'Xtick',0:0.5:8,'Ytick',0:0.5:6,'FontName', Arial','FontSize',10); 18
19 4. DATA MANIPULATION PRACTICE Create a figure (Figure1) that shows the temperature profile T(z) measured the beginning and at the end of the period of interest, by following the instructions in the profile.m script. Use two different colors and a solid line with circles. The vertical axis must be limited between 0 and -50m and spaced every 5m and must have z (m) as label. The vertical axis must be limited between 5 and 30m and spaced every 5 C and must have T ( C) as label. Use Arial 10 as font. Add the lagend. Once the figure has been created, modify the dimension of the plot, fix the resolution of the figure as 300 dpi. Save the figures both as Profile.fig and Profile.tif file. 19
20 4. DATA MANIPULATION PRACTICE Create a figure (Figure 2) that shows the meteorological conditions in the period of interest by following the instructions in the meteo.m script. It should include 2 subplots for a) wind speed c) wind direction Plot wind speed with a continuous lines and wind direction with dots. Choose the line and marker sizes, axis label and ticks that you find more suitable to obtain an effective plot. Use the function datetick to label the x axis with a data format Once the figure has been created, modify the dimension of the plot, fix the resolution of the figure as 300 dpi and save the figures both as Meteo.fig and Meteo.tif file. 20
 draw contour plots of Z using X and Y to determine the x- and y-axis limits.")
.")
 sets the colormap to the matrix according to a certain built-in Matlab colorbar colorbar isplays the")
21 4. DATA PLOTTING VISUALIZING DATA 2D PLOTS contour(x,y,z,v) A contour plot displays isolines of matrix Z. contour(x,y,z) draw contour plots of Z using X and Y to determine the x- and y-axis limits. It is possible to specify contour levels in the monotonically increasing vector v. The number of contour levels is equal to length(v). contourf(x,y,z,v) contourf(x,y,z) draws a filled contour plot of matrix Z. colormap(jet) sets the colormap to the matrix according to a certain built-in Matlab colorbar colorbar isplays the current colormap in the current figure caxis([cmin cmax]) sets the color limits to specified minimum and maximum values. Data values less than cmin or greater than cmax map to cmin and cmax, respectively. 21
 Streamline draws streamlines from 2-D vector data. The arrays X, Y, which define the coordinates for U, V, must be monotonic, but do not need to be uniformly spaced.")
22 4. DATA PLOTTING VISUALIZING DATA 2D PLOTS quiver(x,y,u,v) Quiver A quiver plot displays velocity vectors as arrows with components (u,v) at the points (x,y). quiver(...,scale) automatically scales the arrows to fit within the grid and then stretches them by the factor scale. streamline(x,y,u,v,startx,starty) Streamline draws streamlines from 2-D vector data. The arrays X, Y, which define the coordinates for U, V, must be monotonic, but do not need to be uniformly spaced. X, Y, must have the same number of elements, as if produced by meshgrid. startx, starty define the starting positions of the streamlines 22
23 4. DATA MANIPULATION PRACTICE Create a figure (Figure 3) that shows the temperature field as a function of time and depth, drawing a contour line every 1 C. Follow the contour.m script as a guide. Depth is in y axis, time is in the x axis and the color refers to the temperature values. The vertical axis must be limited between 0 and 50m and spaced every 5m and must have z (m) as label. The horizontal axis must be limited between 01/08 to 10/08, be spaced every day and have time as label. Use the function datetick to label the x axis with a data format. Add the grid, the title and the colourmap. Once the figure has been created, fix the resolution of the figure as 300 dpi and save the figures both as Meteo.fig and Meteo.tif file. 23
24 4. DATA MANIPULATION LET S PRACTICE Through a numerical model, we set up a simulation of the entrance of Oglio river (Q=50m 3 /s; T = 15 C) in Lake Iseo during the stratified season. The river s plume intrudes at about 10m depth. Accordingly, we have extracted the velocity field (u and v components) at -10m depth. The matrixes in the Inflow_path.mat file include: the x and y coordinates, the u and y components of the velocity and the lake depth z for each point of the grid. Load the data and create a figure (Figure 4) that shows the contour of the water speed (vel) superimposed to the velocity vector field, following the inflow.m script. Choose the scale of the vector that assures a good visibility of the velocity field. Superimpose the streamline traced from the Oglio inlet and zoom the figure in the area around the Oglio inlet. Save the figure 24
, where X1, Y1, Z1 are vectors or matrices, plots one or more lines in threedimensional space through the points whose coordinates are the elements of X1, Y1, and Z1.")
25 4. DATA PLOTTING VISUALIZING DATA 3D PLOTS plot3(x1,y1,z1) plot3(x1,y1,z1,...), where X1, Y1, Z1 are vectors or matrices, plots one or more lines in threedimensional space through the points whose coordinates are the elements of X1, Y1, and Z1. quiver3(x,y,z,u,v,w) quiver3(x,y,z,u,v,w) plots vectors with components (u,v,w) at the points (x,y,z). The matrices x,y,z,u,v,w must all be the same size and contain the corresponding position and vector components. surf(x,y,z) Surf(X,Y,Z) uses Z for the color data and surface height. X and Y are vectors or matrices defining the x and y components of a surface. If X and Y are vectors, length(x) = n and length(y) = m, where [m,n] = size(z). 25
26 4. DATA MANIPULATION PRACTICE Use the previous data to create a figure (Figure 5) that shows the bathymetry of lake Iseo superimposed to the Oglio vectors located at -10m depth 26
W1005 Intro to CS and Programming in MATLAB. Plo9ng & Visualiza?on. Fall 2014 Instructor: Ilia Vovsha. hgp://www.cs.columbia.
 W1005 Intro to CS and Programming in MATLAB Plo9ng & Visualiza?on Fall 2014 Instructor: Ilia Vovsha hgp://www.cs.columbia.edu/~vovsha/w1005 Outline Plots (2D) Plot proper?es Figures Plots (3D) 2 2D Plots
EOSC 473/573 Matlab Tutorial R. Pawlowicz with changes by M. Halverson
 EOSC 473/573 Matlab Tutorial R. Pawlowicz with changes by M. Halverson February 12, 2008 Getting help 1. Local On-line help (a) text-based help: >> help (b) GUI-help >> helpwin (c) Browser-based
Dr. Iyad Jafar. Adapted from the publisher slides
 Computer Applications Lab Lab 6 Plotting Chapter 5 Sections 1,2,3,8 Dr. Iyad Jafar Adapted from the publisher slides Outline xy Plotting Functions Subplots Special Plot Types Three-Dimensional Plotting
Prof. Manoochehr Shirzaei. RaTlab.asu.edu
 RaTlab.asu.edu Introduction To MATLAB Introduction To MATLAB This lecture is an introduction of the basic MATLAB commands. We learn; Functions Procedures for naming and saving the user generated files
GUI Alternatives. Syntax. Description. MATLAB Function Reference plot. 2-D line plot
 MATLAB Function Reference plot 2-D line plot GUI Alternatives Use the Plot Selector to graph selected variables in the Workspace Browser and the Plot Catalog, accessed from the Figure Palette. Directly
Introduction to MATLAB
 Introduction to MATLAB Violeta Ivanova, Ph.D. MIT Academic Computing violeta@mit.edu http://web.mit.edu/violeta/www/iap2006 Topics MATLAB Interface and Basics Linear Algebra and Calculus Graphics Programming
Logical Subscripting: This kind of subscripting can be done in one step by specifying the logical operation as the subscripting expression.
 What is the answer? >> Logical Subscripting: This kind of subscripting can be done in one step by specifying the logical operation as the subscripting expression. The finite(x)is true for all finite numerical
Introduction to MATLAB
 Introduction to MATLAB Violeta Ivanova, Ph.D. Office for Educational Innovation & Technology violeta@mit.edu http://web.mit.edu/violeta/www Topics MATLAB Interface and Basics Calculus, Linear Algebra,
3D plot of a surface in Matlab
 3D plot of a surface in Matlab 3D plot of a surface in Matlab Create a surface of function mesh Graphics 3-D line plot Graphics 3-D contour plot Draw contours in volume slice planes For 3-D shaded surface
MATLAB Introduction to MATLAB Programming
 MATLAB Introduction to MATLAB Programming MATLAB Scripts So far we have typed all the commands in the Command Window which were executed when we hit Enter. Although every MATLAB command can be executed
Classes 7-8 (4 hours). Graphics in Matlab.
. Graphics in Matlab.") Classes 7-8 (4 hours). Graphics in Matlab. Graphics objects are displayed in a special window that opens with the command figure. At the same time, multiple windows can be opened, each one assigned a number.
Classes 7-8 (4 hours). Graphics in Matlab. Graphics objects are displayed in a special window that opens with the command figure. At the same time, multiple windows can be opened, each one assigned a number.
Graphics and plotting techniques
 Davies: Computer Vision, 5 th edition, online materials Matlab Tutorial 5 1 Graphics and plotting techniques 1. Introduction The purpose of this tutorial is to outline the basics of graphics and plotting
Mechanical Engineering Department Second Year (2015)
") Lecture 7: Graphs Basic Plotting MATLAB has extensive facilities for displaying vectors and matrices as graphs, as well as annotating and printing these graphs. This section describes a few of the most
Lecture 7: Graphs Basic Plotting MATLAB has extensive facilities for displaying vectors and matrices as graphs, as well as annotating and printing these graphs. This section describes a few of the most
Introduction to MATLAB: Graphics
 Introduction to MATLAB: Graphics Eduardo Rossi University of Pavia erossi@eco.unipv.it September 2014 Rossi Introduction to MATLAB Financial Econometrics - 2014 1 / 14 2-D Plot The command plot provides
More on Plots. Dmitry Adamskiy 30 Nov 2011
 More on Plots Dmitry Adamskiy adamskiy@cs.rhul.ac.uk 3 Nov 211 1 plot3 (1) Recall that plot(x,y), plots vector Y versus vector X. plot3(x,y,z), where x, y and z are three vectors of the same length, plots
Basic Graphs. Dmitry Adamskiy 16 November 2011
 Basic Graphs Dmitry Adamskiy adamskiy@cs.rhul.ac.uk 16 November 211 1 Plot Function plot(x,y): plots vector Y versus vector X X and Y must have the same size: X = [x1, x2 xn] and Y = [y1, y2,, yn] Broken
Matlab Tutorial 1: Working with variables, arrays, and plotting
 Matlab Tutorial 1: Working with variables, arrays, and plotting Setting up Matlab First of all, let's make sure we all have the same layout of the different windows in Matlab. Go to Home Layout Default.
MATLAB Tutorial. Primary Author: Shoumik Chatterjee Secondary Author: Dr. Chuan Li
 MATLAB Tutorial Primary Author: Shoumik Chatterjee Secondary Author: Dr. Chuan Li 1 Table of Contents Section 1: Accessing MATLAB using RamCloud server...3 Section 2: MATLAB GUI Basics. 6 Section 3: MATLAB
Graphics in MATLAB. Responsible teacher: Anatoliy Malyarenko. November 10, Abstract. Basic Plotting Commands
 Graphics in MATLAB Responsible teacher: Anatoliy Malyarenko November 10, 2003 Contents of the lecture: Two-dimensional graphics. Formatting graphs. Three-dimensional graphics. Specialised plots. Abstract
MATLAB Tutorial. Digital Signal Processing. Course Details. Topics. MATLAB Environment. Introduction. Digital Signal Processing (DSP)
") Digital Signal Processing Prof. Nizamettin AYDIN naydin@yildiz.edu.tr naydin@ieee.org http://www.yildiz.edu.tr/~naydin Course Details Course Code : 0113620 Course Name: Digital Signal Processing (Sayısal
Digital Signal Processing Prof. Nizamettin AYDIN naydin@yildiz.edu.tr naydin@ieee.org http://www.yildiz.edu.tr/~naydin Course Details Course Code : 0113620 Course Name: Digital Signal Processing (Sayısal
MATH 2221A Mathematics Laboratory II
 MATH A Mathematics Laboratory II Lab Assignment 4 Name: Student ID.: In this assignment, you are asked to run MATLAB demos to see MATLAB at work. The color version of this assignment can be found in your
INTRODUCTION TO MATLAB PLOTTING WITH MATLAB
 1 INTRODUCTION TO MATLAB PLOTTING WITH MATLAB Plotting with MATLAB x-y plot Plotting with MATLAB MATLAB contains many powerful functions for easily creating plots of several different types. Command plot(x,y)
Basic plotting commands Types of plots Customizing plots graphically Specifying color Customizing plots programmatically Exporting figures
 Basic plotting commands Types of plots Customizing plots graphically Specifying color Customizing plots programmatically Exporting figures Matlab is flexible enough to let you quickly visualize data, and
Department of Chemical Engineering ChE-101: Approaches to Chemical Engineering Problem Solving MATLAB Tutorial Vb
 Department of Chemical Engineering ChE-101: Approaches to Chemical Engineering Problem Solving MATLAB Tutorial Vb Making Plots with Matlab (last updated 5/29/05 by GGB) Objectives: These tutorials are
Lecturer: Keyvan Dehmamy
 MATLAB Tutorial Lecturer: Keyvan Dehmamy 1 Topics Introduction Running MATLAB and MATLAB Environment Getting help Variables Vectors, Matrices, and linear Algebra Mathematical Functions and Applications
MATLAB Laboratory 09/23/10 Lecture. Chapters 5 and 9: Plotting
 MATLAB Laboratory 09/23/10 Lecture Chapters 5 and 9: Plotting Lisa A. Oberbroeckling Loyola University Maryland loberbroeckling@loyola.edu L. Oberbroeckling (Loyola University) MATLAB 09/23/10 Lecture
PyPlot. The plotting library must be imported, and we will assume in these examples an import statement similar to those for numpy and math as
 Geog 271 Geographic Data Analysis Fall 2015 PyPlot Graphicscanbeproducedin Pythonviaavarietyofpackages. We willuseapythonplotting package that is part of MatPlotLib, for which documentation can be found
The Department of Engineering Science The University of Auckland Welcome to ENGGEN 131 Engineering Computation and Software Development
 The Department of Engineering Science The University of Auckland Welcome to ENGGEN 131 Engineering Computation and Software Development Chapter 7 Graphics Learning outcomes Label your plots Create different
Table of Contents. Introduction.*.. 7. Part /: Getting Started With MATLAB 5. Chapter 1: Introducing MATLAB and Its Many Uses 7
 MATLAB Table of Contents Introduction.*.. 7 About This Book 1 Foolish Assumptions 2 Icons Used in This Book 3 Beyond the Book 3 Where to Go from Here 4 Part /: Getting Started With MATLAB 5 Chapter 1:
PROGRAMMING WITH MATLAB WEEK 6
 PROGRAMMING WITH MATLAB WEEK 6 Plot: Syntax: plot(x, y, r.- ) Color Marker Linestyle The line color, marker style and line style can be changed by adding a string argument. to select and delete lines
PyPlot. The plotting library must be imported, and we will assume in these examples an import statement similar to those for numpy and math as
 Geog 271 Geographic Data Analysis Fall 2017 PyPlot Graphicscanbeproducedin Pythonviaavarietyofpackages. We willuseapythonplotting package that is part of MatPlotLib, for which documentation can be found
FF505/FY505 Computational Science. MATLAB Graphics. Marco Chiarandini
 FF505/FY505 Computational Science MATLAB Marco Chiarandini (marco@imada.sdu.dk) Department of Mathematics and Computer Science (IMADA) University of Southern Denmark Outline 1. 2D Plots 3D Plots 2 Outline
Appendix A. Introduction to MATLAB. A.1 What Is MATLAB?
 Appendix A Introduction to MATLAB A.1 What Is MATLAB? MATLAB is a technical computing environment developed by The Math- Works, Inc. for computation and data visualization. It is both an interactive system
INTERNATIONAL EDITION. MATLAB for Engineers. Third Edition. Holly Moore
 INTERNATIONAL EDITION MATLAB for Engineers Third Edition Holly Moore 5.4 Three-Dimensional Plotting Figure 5.8 Simple mesh created with a single two-dimensional matrix. 5 5 Element,5 5 The code mesh(z)
INTRODUCTION TO MATLAB, SIMULINK, AND THE COMMUNICATION TOOLBOX
 INTRODUCTION TO MATLAB, SIMULINK, AND THE COMMUNICATION TOOLBOX 1) Objective The objective of this lab is to review how to access Matlab, Simulink, and the Communications Toolbox, and to become familiar
DSP Laboratory (EELE 4110) Lab#1 Introduction to Matlab
 Lab#1 Introduction to Matlab") Islamic University of Gaza Faculty of Engineering Electrical Engineering Department 2012 DSP Laboratory (EELE 4110) Lab#1 Introduction to Matlab Goals for this Lab Assignment: In this lab we would have
Islamic University of Gaza Faculty of Engineering Electrical Engineering Department 2012 DSP Laboratory (EELE 4110) Lab#1 Introduction to Matlab Goals for this Lab Assignment: In this lab we would have
Introduction to Programming in MATLAB
 Introduction to Programming in MATLAB User-defined Functions Functions look exactly like scripts, but for ONE difference Functions must have a function declaration Help file Function declaration Outputs
Additional Plot Types and Plot Formatting
 Additional Plot Types and Plot Formatting The xy plot is the most commonly used plot type in MAT- LAB Engineers frequently plot either a measured or calculated dependent variable, say y, versus an independent
What is MATLAB? It is a high-level programming language. for numerical computations for symbolic computations for scientific visualizations
 What is MATLAB? It stands for MATrix LABoratory It is developed by The Mathworks, Inc (http://www.mathworks.com) It is an interactive, integrated, environment for numerical computations for symbolic computations
Creates a 1 X 1 matrix (scalar) with a value of 1 in the column 1, row 1 position and prints the matrix aaa in the command window.
 with a value of 1 in the column 1, row 1 position and prints the matrix aaa in the command window.") EE 350L: Signals and Transforms Lab Spring 2007 Lab #1 - Introduction to MATLAB Lab Handout Matlab Software: Matlab will be the analytical tool used in the signals lab. The laboratory has network licenses
EE 350L: Signals and Transforms Lab Spring 2007 Lab #1 - Introduction to MATLAB Lab Handout Matlab Software: Matlab will be the analytical tool used in the signals lab. The laboratory has network licenses
What is Matlab? A software environment for interactive numerical computations
 What is Matlab? A software environment for interactive numerical computations Examples: Matrix computations and linear algebra Solving nonlinear equations Numerical solution of differential equations Mathematical
Introduction to Matlab
 Introduction to Matlab By:Mohammad Sadeghi *Dr. Sajid Gul Khawaja Slides has been used partially to prepare this presentation Outline: What is Matlab? Matlab Screen Basic functions Variables, matrix, indexing
MATLAB Tutorial. Mohammad Motamed 1. August 28, generates a 3 3 matrix.
 MATLAB Tutorial 1 1 Department of Mathematics and Statistics, The University of New Mexico, Albuquerque, NM 87131 August 28, 2016 Contents: 1. Scalars, Vectors, Matrices... 1 2. Built-in variables, functions,
12 whereas if I terminate the expression with a semicolon, the printed output is suppressed.
 Example 4 Printing and Plotting Matlab provides numerous print and plot options. This example illustrates the basics and provides enough detail that you can use it for typical classroom work and assignments.
Desktop Command window
 Chapter 1 Matlab Overview EGR1302 Desktop Command window Current Directory window Tb Tabs to toggle between Current Directory & Workspace Windows Command History window 1 Desktop Default appearance Command
STAT 391 Handout 1 Making Plots with Matlab Mar 26, 2006
 STAT 39 Handout Making Plots with Matlab Mar 26, 26 c Marina Meilă & Lei Xu mmp@cs.washington.edu This is intended to help you mainly with the graphics in the homework. Matlab is a matrix oriented mathematics
Chapter 3: Introduction to MATLAB Programming (4 th ed.)
") Chapter 3: Introduction to MATLAB Programming (4 th ed.) Algorithms MATLAB scripts Input / Output o disp versus fprintf Graphs Read and write variables (.mat files) User-defined Functions o Definition
Chapter 3: Introduction to MATLAB Programming (4 th ed.) Algorithms MATLAB scripts Input / Output o disp versus fprintf Graphs Read and write variables (.mat files) User-defined Functions o Definition
INTRODUCTION TO MATLAB
 1 of 18 BEFORE YOU BEGIN PREREQUISITE LABS None EXPECTED KNOWLEDGE Algebra and fundamentals of linear algebra. EQUIPMENT None MATERIALS None OBJECTIVES INTRODUCTION TO MATLAB After completing this lab
Introduction to MATLAB programming: Fundamentals
 Introduction to MATLAB programming: Fundamentals Shan He School for Computational Science University of Birmingham Module 06-23836: Computational Modelling with MATLAB Outline Outline of Topics Why MATLAB?
NENS 230 Assignment 4: Data Visualization
 NENS 230 Assignment 4: Data Visualization Due date: Tuesday, October 20, 2015 Goals Get comfortable manipulating figures Familiarize yourself with common 2D and 3D plots Understand how color and colormaps
Math Sciences Computing Center. University ofwashington. September, Fundamentals Making Plots Printing and Saving Graphs...
 Introduction to Plotting with Matlab Math Sciences Computing Center University ofwashington September, 1996 Contents Fundamentals........................................... 1 Making Plots...........................................
Lab of COMP 406 Introduction of Matlab (II) Graphics and Visualization
 Graphics and Visualization") Lab of COMP 406 Introduction of Matlab (II) Graphics and Visualization Teaching Assistant: Pei-Yuan Zhou Contact: cspyzhou@comp.polyu.edu.hk Lab 2: 19 Sep., 2014 1 Review Find the Matlab under the folder
Lab of COMP 406 Introduction of Matlab (II) Graphics and Visualization Teaching Assistant: Pei-Yuan Zhou Contact: cspyzhou@comp.polyu.edu.hk Lab 2: 19 Sep., 2014 1 Review Find the Matlab under the folder
Examples, examples: Outline
 Examples, examples: Outline Overview of todays exercises Basic scripting Importing data Working with temporal data Working with missing data Interpolation in 1D Some time series analysis Linear regression
SGN Introduction to Matlab
 SGN-84007 Introduction to Matlab Lecture 4: Data Visualization Heikki Huttunen Alessandro Foi October 10, 2016 Outline Basics: figure, axes, handles, properties; Plotting univariate and multivariate data;
MATLAB Functions and Graphics
 Functions and Graphics We continue our brief overview of by looking at some other areas: Functions: built-in and user defined Using M-files to store and execute statements and functions A brief overview
Introduction to MATLAB
 58:110 Computer-Aided Engineering Spring 2005 Introduction to MATLAB Department of Mechanical and industrial engineering January 2005 Topics Introduction Running MATLAB and MATLAB Environment Getting help
This module aims to introduce Precalculus high school students to the basic capabilities of Matlab by using functions. Matlab will be used in
 This module aims to introduce Precalculus high school students to the basic capabilities of Matlab by using functions. Matlab will be used in subsequent modules to help to teach research related concepts
Overview. Lecture 13: Graphics and Visualisation. Graphics & Visualisation 2D plotting. Graphics and visualisation of data in Matlab
 Overview Lecture 13: Graphics and Visualisation Graphics & Visualisation 2D plotting 1. Plots for one or multiple sets of data, logarithmic scale plots 2. Axis control & Annotation 3. Other forms of 2D
Introduction to MATLAB LAB 1
 Introduction to MATLAB LAB 1 1 Basics of MATLAB MATrix LABoratory A super-powerful graphing calculator Matrix based numeric computation Embedded Functions Also a programming language User defined functions
A Brief Introduction to MATLAB
 A Brief Introduction to MATLAB MATLAB (Matrix Laboratory) is an interactive software system for numerical computations and graphics. As the name suggests, MATLAB was first designed for matrix computations:
Plotting using Matlab. Vytautas Astromskas
 Plotting using Matlab Vytautas Astromskas Contents 1 Manipulating a plot using GUI 2 2 Manipulating a plot using command line 4 3 Adding multiple lines to the same plot 5 4 Logarithmic axes 6 5 Plotting
MATLAB Tutorial. 1. The MATLAB Windows. 2. The Command Windows. 3. Simple scalar or number operations
 MATLAB Tutorial The following tutorial has been compiled from several resources including the online Help menu of MATLAB. It contains a list of commands that will be directly helpful for understanding
QUICK INTRODUCTION TO MATLAB PART I
 QUICK INTRODUCTION TO MATLAB PART I Department of Mathematics University of Colorado at Colorado Springs General Remarks This worksheet is designed for use with MATLAB version 6.5 or later. Once you have
Introduction to MATLAB Programming. Chapter 3. Linguaggio Programmazione Matlab-Simulink (2017/2018)
") Introduction to MATLAB Programming Chapter 3 Linguaggio Programmazione Matlab-Simulink (2017/2018) Algorithms An algorithm is the sequence of steps needed to solve a problem Top-down design approach to
Introduction to MATLAB Programming Chapter 3 Linguaggio Programmazione Matlab-Simulink (2017/2018) Algorithms An algorithm is the sequence of steps needed to solve a problem Top-down design approach to
EXERCISES Introduction to MATLAB: Graphics
 I. Class Materials 1. Download Graphics.tar EXERCISES Introduction to MATLAB: Graphics From a web browser: Open your browser and go to http://web.mit.edu/acmath/matlab/intromatlab. Download the file Graphics.tar
UNIVERSITI TEKNIKAL MALAYSIA MELAKA FAKULTI KEJURUTERAAN ELEKTRONIK DAN KEJURUTERAAN KOMPUTER
 UNIVERSITI TEKNIKAL MALAYSIA MELAKA FAKULTI KEJURUTERAAN ELEKTRONIK DAN KEJURUTERAAN KOMPUTER FAKULTI KEJURUTERAAN ELEKTRONIK DAN KEJURUTERAAN KOMPUTER BENC 2113 DENC ECADD 2532 ECADD LAB SESSION 6/7 LAB
MATLAB Guide to Fibonacci Numbers
 MATLAB Guide to Fibonacci Numbers and the Golden Ratio A Simplified Approach Peter I. Kattan Petra Books www.petrabooks.com Peter I. Kattan, PhD Correspondence about this book may be sent to the author
PART 1 PROGRAMMING WITH MATHLAB
 PART 1 PROGRAMMING WITH MATHLAB Presenter: Dr. Zalilah Sharer 2018 School of Chemical and Energy Engineering Universiti Teknologi Malaysia 23 September 2018 Programming with MATHLAB MATLAB Environment
Programming in Mathematics. Mili I. Shah
 Programming in Mathematics Mili I. Shah Starting Matlab Go to http://www.loyola.edu/moresoftware/ and login with your Loyola name and password... Matlab has eight main windows: Command Window Figure Window
Chapter 11. Above: Principal contraction rates calculated from GPS velocities. Visualized using MATLAB.
 Chapter 11 Above: Principal contraction rates calculated from GPS velocities. Visualized using MATLAB. We have used MATLAB to visualize data a lot in this course, but we have only scratched the surface
Name: Math Analytic Geometry and Calculus III - Spring Matlab Project - due on Wednesday, March 30
 Name: Math 275 - Analytic Geometry and Calculus III - Spring 2011 Solve the following problems: Matlab Project - due on Wednesday, March 30 (Section 14.1 # 30) Use Matlab to graph the curve given by the
Plotting - Practice session
 Plotting - Practice session Alessandro Fanfarillo - Salvatore Filippone fanfarillo@ing.uniroma2.it May 28th, 2013 (fanfarillo@ing.uniroma2.it) Plotting May 28th, 2013 1 / 14 Plot function The basic function
CSE 123. Plots in MATLAB
 CSE 123 Plots in MATLAB Easiest way to plot Syntax: ezplot(fun) ezplot(fun,[min,max]) ezplot(fun2) ezplot(fun2,[xmin,xmax,ymin,ymax]) ezplot(fun) plots the expression fun(x) over the default domain -2pi
Graphics Example a final product:
 Basic 2D Graphics 1 Graphics Example a final product: TITLE LEGEND YLABEL TEXT or GTEXT CURVES XLABEL 2 2-D Plotting Specify x-data and/or y-data Specify color, line style and marker symbol (Default values
MAT 275 Laboratory 1 Introduction to MATLAB
 MATLAB sessions: Laboratory 1 1 MAT 275 Laboratory 1 Introduction to MATLAB MATLAB is a computer software commonly used in both education and industry to solve a wide range of problems. This Laboratory
EOSC 352 MATLAB Review
 EOSC 352 MATLAB Review To use MATLAB, you can either (1) type commands in the window (i.e., at the command line ) or (2) type in the name of a file you have made, whose name ends in.m and which contains
AMS 27L LAB #2 Winter 2009
 AMS 27L LAB #2 Winter 2009 Plots and Matrix Algebra in MATLAB Objectives: 1. To practice basic display methods 2. To learn how to program loops 3. To learn how to write m-files 1 Vectors Matlab handles
GRAPHICS AND VISUALISATION WITH MATLAB
 GRAPHICS AND VISUALISATION WITH MATLAB UNIVERSITY OF SHEFFIELD CiCS DEPARTMENT Des Ryan & Mike Griffiths September 2017 Topics 2D Graphics 3D Graphics Displaying Bit-Mapped Images Graphics with Matlab
Computing Fundamentals Plotting
 Computing Fundamentals Plotting Salvatore Filippone salvatore.filippone@uniroma2.it 2014 2015 (salvatore.filippone@uniroma2.it) Plotting 2014 2015 1 / 14 Plot function The basic function to plot something
Scientific Functions Complex Numbers
 CNBC Matlab Mini-Course Inf and NaN 3/0 returns Inf David S. Touretzky October 2017 Day 2: More Stuff 0/0 returns NaN 3+Inf Inf/Inf 1 -Inf, -NaN 4 Scientific Functions Complex Numbers Trig: Rounding: Modular:
MATLAB basic guide to create 2D and 3D Plots. Part I Introduction
 MATLAB basic guide to create 2D and 3D Plots Part I Introduction This guide will walk you through the steps necessary to create, using MATLAB, a Three dimensional surface, a Two dimensional contour plot
NatSciLab - Numerical Software Introduction to MATLAB
 Outline 110112 NatSciLab - Numerical Software Introduction to MATLAB Onur Oktay Jacobs University Bremen Spring 2010 Outline 1.m files 2 Programming Branching (if, switch) Loops (for, while) 3 Anonymous
COMS 3101 Programming Languages: MATLAB. Lecture 3
 COMS 3101 Programming Languages: MATLAB Lecture 3 Fall 2013 Instructor: Ilia Vovsha hbp://www.cs.columbia.edu/~vovsha/coms3101/matlab Lecture Outline Loading and saving data More input/output Basic plojng,
A very brief Matlab introduction
 A very brief Matlab introduction Siniša Krajnović January 24, 2006 This is a very brief introduction to Matlab and its purpose is only to introduce students of the CFD course into Matlab. After reading
MATLAB/Octave Tutorial
 University of Illinois at Urbana-Champaign Department of Electrical and Computer Engineering ECE 298JA Fall 2017 MATLAB/Octave Tutorial 1 Overview The goal of this tutorial is to help you get familiar
2D LINE PLOTS... 1 The plot() Command... 1 Labeling and Annotating Figures... 5 The subplot() Command... 7 The polarplot() Command...
 Command... 1 Labeling and Annotating Figures... 5 The subplot() Command... 7 The polarplot() Command...") Contents 2D LINE PLOTS... 1 The plot() Command... 1 Labeling and Annotating Figures... 5 The subplot() Command... 7 The polarplot() Command... 9 2D LINE PLOTS One of the benefits of programming in MATLAB
Contents 2D LINE PLOTS... 1 The plot() Command... 1 Labeling and Annotating Figures... 5 The subplot() Command... 7 The polarplot() Command... 9 2D LINE PLOTS One of the benefits of programming in MATLAB
Matlab Tutorial. Get familiar with MATLAB by using tutorials and demos found in MATLAB. You can click Start MATLAB Demos to start the help screen.
 University of Illinois at Urbana-Champaign Department of Electrical and Computer Engineering ECE 298JA Fall 2015 Matlab Tutorial 1 Overview The goal of this tutorial is to help you get familiar with MATLAB
Introduction to Matlab
 What is Matlab? Introduction to Matlab Matlab is software written by a company called The Mathworks (mathworks.com), and was first created in 1984 to be a nice front end to the numerical routines created
CDA6530: Performance Models of Computers and Networks. Chapter 4: Using Matlab for Performance Analysis and Simulation
 CDA6530: Performance Models of Computers and Networks Chapter 4: Using Matlab for Performance Analysis and Simulation Objective Learn a useful tool for mathematical analysis and simulation Interpreted
Lab 6: Graphical Methods
 Lab 6: Graphical Methods 6.1 Introduction EGR 53L - Fall 2009 Lab this week is going to introduce graphical solution and presentation techniques as well as surface plots. 6.2 Resources The additional resources
Grace days can not be used for this assignment
 CS513 Spring 19 Prof. Ron Matlab Assignment #0 Prepared by Narfi Stefansson Due January 30, 2019 Grace days can not be used for this assignment The Matlab assignments are not intended to be complete tutorials,
Beyond the Mouse A Short Course on Programming
 1 / 15 Beyond the Mouse A Short Course on Programming 5. Matlab IO: Getting data in and out of Matlab Ronni Grapenthin and Glenn Thompson Geophysical Institute, University of Alaska Fairbanks October 11,
EL2310 Scientific Programming LAB1: MATLAB lab session. Patric Jensfelt
 EL2310 Scientific Programming LAB1: MATLAB lab session Patric Jensfelt Chapter 1 Introduction 1.1 Goals for this lab The goals for this lab is handle the computers in the computer rooms create and edit
Constraint-based Metabolic Reconstructions & Analysis H. Scott Hinton. Matlab Tutorial. Lesson: Matlab Tutorial
 1 Matlab Tutorial 2 Lecture Learning Objectives Each student should be able to: Describe the Matlab desktop Explain the basic use of Matlab variables Explain the basic use of Matlab scripts Explain the
CDA6530: Performance Models of Computers and Networks. Chapter 4: Using Matlab for Performance Analysis and Simulation
 CDA6530: Performance Models of Computers and Networks Chapter 4: Using Matlab for Performance Analysis and Simulation Objective Learn a useful tool for mathematical analysis and simulation Interpreted
Introduction to Matlab to Accompany Linear Algebra. Douglas Hundley Department of Mathematics and Statistics Whitman College
 Introduction to Matlab to Accompany Linear Algebra Douglas Hundley Department of Mathematics and Statistics Whitman College August 27, 2018 2 Contents 1 Getting Started 5 1.1 Before We Begin........................................
CDA5530: Performance Models of Computers and Networks. Chapter 8: Using Matlab for Performance Analysis and Simulation
 CDA5530: Performance Models of Computers and Networks Chapter 8: Using Matlab for Performance Analysis and Simulation Objective Learn a useful tool for mathematical analysis and simulation Interpreted
Getting Started. Chapter 1. How to Get Matlab. 1.1 Before We Begin Matlab to Accompany Lay s Linear Algebra Text
 Chapter 1 Getting Started How to Get Matlab Matlab physically resides on each of the computers in the Olin Hall labs. See your instructor if you need an account on these machines. If you are going to go
Getting Started with MATLAB
 Getting Started with MATLAB Math 315, Fall 2003 Matlab is an interactive system for numerical computations. It is widely used in universities and industry, and has many advantages over languages such as
Introduction to Octave/Matlab. Deployment of Telecommunication Infrastructures
 Introduction to Octave/Matlab Deployment of Telecommunication Infrastructures 1 What is Octave? Software for numerical computations and graphics Particularly designed for matrix computations Solving equations,