GIS.XL. User manual of Excel add-in for spatial data analysis and visualization.
|
|
|
- Barbra Cain
- 6 years ago
- Views:
Transcription


1 GIS.XL User manual of Excel add-in for spatial data analysis and visualization
2 Content 1 Introduction Requirements Installation Uninstallation Add-in Setup Licensing User Interface GIS Features Excel to GIS GIS to Excel Special Features Conclusion Gregor M. 2016: GIS.XL User manual of Excel add-in for spatial data analysis and visualization. ONLINE ONLY,
3 1 Introduction Excel is a good tool for management, analysis, visualization and storage of diverse data types. In practice, it is the most widely used software for data processing in tabular form. Estimates state that MS Excel has about one billion worldwide users, and further analysis reveals that 80% of the data we have and use has a spatial character. Therefore, global users have billions of data-sets that can be visualized or analyzed in relation to their spatial characteristics. Despite this, Excel offers few options for spatial data. Most existing solutions are geared to basic data display on Bing or Google Map backgrounds, and if you need something more, you always have to add another large external piece of software; even when you only need a simple function or feature. Moreover, data transfer between Excel and the added external program consumes 80% of your running time, and this time is extended if you transfer data often or if your dataset is updated on a regular basis. I faced this problem in my practice as a hydrogeologist; and I was so frustrated at not being able to find an existing solution that met my expectations that I created my own. All my colleagues gave positive reactions, so I decided to finish this solution and release it publicly. Today, you can use this solution too, and you will find that it saves you a lot of time The result is application level add-in for MS Excel which is released under the name GIS.XL. In a sentence, GIS.XL can be described as an add-in for spatial data analysis and visualization. Add-in contains complete GIS interface, plus a variety of features for working with spatial data. It lets you quickly display your tabular data in a map and also receive additional data for your tables from external maps which can be imported into the program as ESRI Shape Files. This manual provides all the comprehensive information you need to be able to fully utilize GIS.XL functionality. For more information, together with the installation file, visit the website which also provides links to video tutorials and instruction videos for GIS.XL add-in. 2 56
4 2 Requirements Add-in GIS.XL was developed with the condition that it does not require additional software, libraries or web services. The Installation package is less than 13 MB and it contains everything you need for installation and running. When you begin the installation process the program downloads all necessary libraries (.NET Framework 4.5) via the Internet (microsoft.com website) and installs them automatically. This is a great help if your computer is not updated regularly with libraries and the latest available tools. Your computer only needs the following: OS: Windows Vista or higher MS Office: desktop version of MS Excel 2005 or higher Your computer may be 32 or 64-bit, and the same for your Office; and this program is operational in all combinations. 3 56
, the installation program automatically downloads and installs it.")

5 3 Installation Installation of GIS.XL add-in is very simple. You just follow the assistant who takes care of everything for you. If something is missing in your computer (a library), the installation program automatically downloads and installs it. After installation, you can use add-in immediately. The first step is, download the installation package from website. The installation package is a compressed zip file you can open after the download. Just run setup.exe file in the directory, and follow the instuctions. After running setup.exe, a control dialog is displayed that asks if you want to run the installation program. 4 56


6 If you click on the Run button, add-in installation begins. The actual installation starts when you click the Install button. The progress bar in the next dialog displays installation status and progress. The final dialog informs you if the software is installed successfully, 5 56
![The installation is complete after clicking the Close button, and you can immediately use add-in. If you start MS Excel, you will find a new tab called GIS [demo] at the end of the ribbon toolbar.](/docs-images/73/68829545/images/7-0.jpg "You can now use add-in to test it and familiarize yourself with it. If you want to use the add-in without limitations, you must activate your license.")
.")
7 The installation is complete after clicking the Close button, and you can immediately use add-in. If you start MS Excel, you will find a new tab called GIS [demo] at the end of the ribbon toolbar. You can now use add-in to test it and familiarize yourself with it. If you want to use the add-in without limitations, you must activate your license. This procedure is described in chapter 6 Licensing. TIP If an error occurs during installation(security excepted), one step is required before instaling again. Copy the installation package you downloaded to the directory you have full adminitrative rights to,(such as My Documents folder). Once you have copied the package install it again, and installation takes place correctly. After the installation, you can delete the package from My Documents 6 56

8 4 Uninstallation If you want to update or remove add-in from your computer, it is easy. Add-in is uninstalled exactly the same as you remove other programs from your computer. Firstly, open the Control Panel Programs Programs and Features window. Find GIS.XL in the list of programs, double-click on it, or right-click on it and choose Uninstall from the context menu. Uninstalling removes add-in from your computer. WARNING If you have activated your commercial add-in license, you must detach it before uninstalling the program. Otherwise, you can not activate your commercial license on another computer and it will remain on your current computer. See--Chapter 6 Licensing--to detach your license. 7 56


9 5 Add-in Setup The first version of the program contains only one configuration option. You can set whether you want add-in to start automatically at MS Excel boot or on user request. The Auto-Start option doesn t slow Excel start. If you want to turn add-in on OR off manually, click on the main ribbon button File and then click the Options menu item. You click on the Add-ins item in the displayed dialog and then select COM Add-ins in the right panel of the combo box and press the Go button. This next dialog display lets you enable or disable selected add-ins in the installed list. This list also contains our GIS.XL add-in. 8 56

10 6 Licensing After installing add-in, you can immediately use the demo version. This version includes all functions; but some are limited. You will find limited functions in the Functions group in the ribbon toolbar tab. If you want to use the full version of add-in, you must activate your commercial license (described in chapter 6 Licensing). An auxiliary dialog appears when you click the License ribbon button and this enables activation. Your computer must be connected to the internet to activate your license. Add-in firstly verifies connectivity to the installation server. Then you can install the license which you purchase in the site. After purchasing the license you get a registration code you insert into the text box. After license activation, you can use the full version immediately, and without restrictions. WARNING If you want to activate your license on another computer, or upgrade to a higher add-in version, you must first deactivate your license on your current computer. Click on the License button in the ribbon toolbar, enter the registration code in that window and click the Detach License button. Then you can use your license on another computer. 9 56
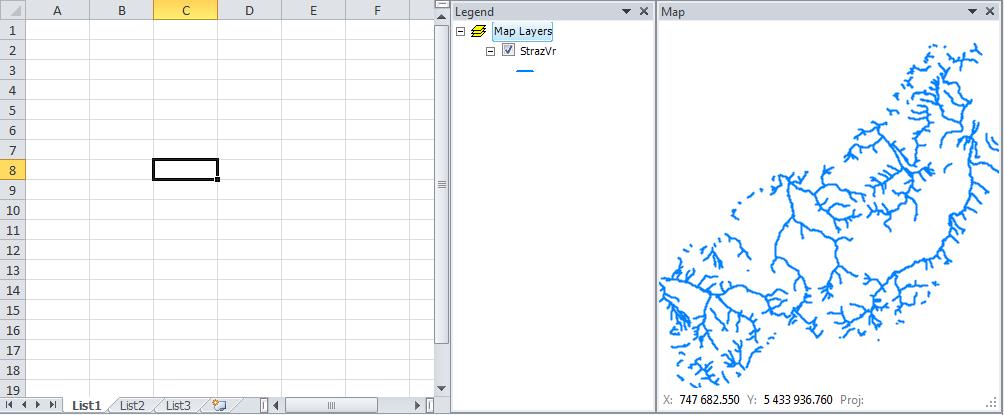
11 7 User Interface The GIS.XL add-in user interface has three main parts. The first is the ribbon toolbar tab, named GIS. This toolbar contains everything you need to work with add-in. The first two buttons display the map and legend panels. The second group of buttons is used to work with external map layers in the ShapeFile form and the third group is for working with spatial data. Using these functions, you can combine the powerful features of Excel spreadsheet and GIS interface. Finally, the last two buttons display information about add-in and commercial license activation/deactivation. These individual functions on the ribbon toolbar are described in the following manual sections. Only the first two buttons are important in this chapter. The first button, called Map, displays the Map panel. This panel shows your data in the form of maps, and you can import your data from the Excel table into this panel and open external layers from ESRI Shape Files (*.shp). The panel is anchored to the right part of the Excel window, but you can change its position. You can exclude it entirely from the Excel window, move it on the external monitor or resize it to fullscreen mode. The info bar in the bottom of the Map panel displays the X and Y coordinates on the mouse cursor and also the coordinate system you are using. If you want to change the map layers visual properties, you use features in the panel which appear when you click the second ribbon button Legend. Invidual features of the GIS interface are described in the following chapter; 8. GIS Features
12 11 56

13 8 GIS Features GIS interface functionality is mostly controlled by the first five buttons in the ribbon toolbar. As discussed in the previous chapter, the first two buttons display the Map and Legend panels. Another button, named the Add Layer, allows you to insert layers stored on your hard disk into the map. These map layers can be in vector or raster formats. Lines or polygons stored in ESRI ShapeFiles (*.shp) can be inserted into the map points under the vector format. You can import images or rasters (grids) from raster formats. As example is DEM the digital elevation model. The current version of Add-in only lets you work with rasters stored as Binary Grids (*.bgd). If you have rasters in another format, you must convert it in other software. For example, I use the SAGA open source tool. The next image shows an example of elevation lines imported from a ShapeFile. The new layer is displayed in a single color when you import it. In addition to the Map panel, there is also a Legend panel (where one item has been added for display purpose). The Legend panel lets you change the position of individual layers using drag-&-drop features


14 If you select one layer in Legend and then click on the Attribute table button in the ribbon toolbar, a window displays data from the ShapeFile attribute table. You can select, filter or edit this data in different ways


15 If you want to edit the visual properties of the map layer, use the functions in the Leged panel. In the example, I have opened the elevation lines. When you double-click on an item in Legend, a dialog appears where you can edit visual properties of all the features in the layer. In the following example, I changed the line color and opacity. Additional visual features can be set by right-clicking an item in the Legend panel. A context menu is displayed and you can choose your option. For example, you can use this to remove layers from the map, zoom to the entire layer extent, export layer attribute data or set feature labels. Comprehensive setup options for layer properties can be found under the Properties menu item. If you want to display labels for elevation lines, click on the Labeling Label Setup item in the context menu. You will see a dialog where you can set labels for the map layer. You can also enter values stored in the ShapeFile Attribute Table as labels


16 You can also set a number of parameters for your labels; such as font, size, transparency, rotation and other things you want to use. An example of displayed labels is shown in the following image


17 In addition to labels, you can also set visual characteristics of each feature (line) in the map layer according to the attribute table data. When you click on the Properties item, a dialog appears where you can set-up multiple features, such as symbols. In the example below, we set line colors related to the VYSKA column in the attribute table (vyska = altitude in English). The map is much easier to read when you use this set-up, and you can set multiple parameters of map layers until your requirements are completed


18 Other GIS functions can be found by right-clicking on the Map Layers root item in the Legend. A context menu displays the following additional features. These features let you zoom the map to the maximum extent; or you can create groups of map layers. One of the most important feature is the last item Projection. Click on this and you can either display information about the map projection you have used, or you can change it. This feature is particularly important if you want to use the function for data export into Google Earth. You need to use projection WGS84 for this function, and this is explained in detail in Chapter 11 Special Features. The last group of functions is contained in the Map panel context menu. You right-click on the map, and a group of functions is displayed in the menu

19 The Add Layer function lets you add new layers to the map from your computer disk. The Pan function allows you to scroll the map with your mouse. The Select option gives you the opportunity to select individual features from the map layer and Zoom and Full Extent functions scale the map. The Open Project and Save as Project options open and store information about current maps layer setups and properties. If you often open the same map layers with the same visual characteristics, you can save these proerpties together and automatically open them in bulk. This simplifies and speeds up your work. The Clear Map function removes all layers from both the Map and the Legend panel. The last three features are the most interesting; the Info function activates your options to idenfity each feature on the map. Click on the map and an auxiliary dialog appears with all the data in the attribute table for the features you clicked


20 The penultimate function Print lets you print your map results easily in map sheet form. Your map will be inserted in the Map panel of your printed map. You can then add things on the paper. For example, you can insert the things you need including the legend, a north arrow, the scale and labels and custom images (logos) from your disk. Finally, you export your finished map as an image file. However, if you don t want to print, and only want to export your map from the Map panel, click on Export the last item in the context menu. This saves your Map panel content in an image file


21 9 Excel to GIS Functions in the Excel to GIS group transfer data between Excel spreadsheets and the GIS interface. In the current version, add-in has two functions in this group. The first is Create New Layer, which creates a new map layer from your Excel table; and the second, Update Layer, lets you update the attribute table in your selected existing map layer using data from an Excel table. 9.1 Data Selection Data selection in your spreadsheet is essential when you are working with GIS.XL add-in. If you want to export Excel data into maps or update an existing map layer, you must know basic technical characteristics about data selection. If you want to select the entire table, just press Ctrl+A., but the first row must always contain descriptions (names) of the selected columns. If the first row has numeric values, the program understands them as labels. If the first selected row is empty, the program uses Excel column descriptors as labels (A, B, C) 20 56

22 You can have dynamic Excel formulas, such as =A2+B2/C2 in your selection, as well as numbers and strings. Another add-in characteristic is the possibility to work with filtered data. If you only want to display selected lines in your map, you can use the Excel Filters built-in feature. If you want to work with filtered selection in your table, you can also use this command, because add-in supports this feature. You can still continue to use individual functions for selected data in your spreadsheet; and the first function described here is creating a new map layer. 9.2 Create new layer You can create a new map layer from selected data in your spreadsheet. Just click the Excel to GIS Create New Layer button in the ribbon toolbar. This displays the following dialog. This dialog has two main parts. The upper part is a definition table describing the selected data. The first column displays the column names in the selection, and the second defines the data format in the individual columns. At this point, you can immediately see whether your data is correctly formatted

23 For example, if you have string values instead of numeric values in columns that include coordinates, you see this fact directly. The map attribute layer is also created from the selection, and the last column of the table defines whether the selection column is to be inserted in the resultant ShapeFile attribute table. The lower part of the dialog enables you to define the character of your new map layer. Although the basic settings for all types of features are identical, this dialog area changes depending on what type of feature you want to create. First, you set-up columns that contain numerical values of your X and Y coordinate in the first two combo boxes. The coordinate system you used in your new ShapeFile is displayed in the next column. The coordinate system will always be the same as you defined in your map panel; but this row only has control purpose and it is not possible to change the coordinate system. You can change the coordinate system by using the Legend panel context menu features. You then select the type of map features you want to create from the next combo box. This version of add-in gives you the choice of 8 types of features you can create from Excel data. However, the next settings in the dialog change when you change the feature type. Finally, you define the new map layer name in the last line. When you have defined all parameters, you click Apply and the program automatically creates your new map layer from Excel data; exactly according to your chosen settings. The following subchapters describe the options and settings for generating individual types of map layers Create point layer The basic type of map layer you can create is composed of points. To use points, you choose the Point option in the Feature Type combo box. If you choose Point, you cannot define any other parameter, and a single line in the selected table defines one point in the map layer. If you want to create a new layer in add-in, you must remember one thing. Columns that contain X and Y coordinate values must not have any empty cells. If you have rows without coordinates in your table, hide them using Filter or remove them. An example of a new created point layer is shown in the following figure
24 This new map layer is formed by simple points. You can change their visual character by substituting values stored in your Map Layer attribute table Create line layer The next simple feature you can create with add-in is lines. As in the previous case, your coordinates are defined in the X and Y combo boxes. When you choose the Line option in the Feature Type combo box, the Grouping Column parameter is displayed. If you leave this combo box empty, a one-line map layer will be created from the table. If you want to create multiple lines in a single layer, you must have a column in the table that separates each line. This column will contain your defined values. When the value in this column is changed, it begins to create a new line, and the points in the current line are inserted in the new line unless the value in the column changes. Attribute table values are always created for the first record for a given line in the table. An example of table structure with two lines to be given values is as follows
25 X Coordinate Y Coordinate Grouping Column Attribute data_1 Attribute data_ Line_1 value value Line_ Line_ Line_2 value value Line_ Line_ Line_2 The two lines, Line 1 and Line 2 in the Grouping Column, in the above table have defined coordinates. Coordinates are stored in the first two columns and the breakdown of each line is defined in the third column. Finally, the last two columns have data used for generating the attribute table layer. A generated line layer example is in the next figure Create polygon layer Another type of vector map you can create is a polygon layer. Its definition is the same as for the line layer
26 Polygon vertex coordinates are defined by the first two combo boxes. You can create multiple polygons from the table using the Grouping Column parameter;-exactly the same way you did for lines. Again, if you leave this combo box empty, only one polygon will be created from selected data.the created polygon layer example is shown in the next figure. Polygon attribute data is created from the first line of your selected Excel spreadsheet; the same as for lines Create convex hull layer Another feature you can create is a convex hull polygon layer. This encloses all coordinates from your Excel spreadsheet in a single polygon. No additional option or parameter setup is required for this map feature

27 An example of the convex hull layer is shown in the next figure Create Delaunay polygon layer Delaunay polygons can also be created from your data. You do not have to define any parameters when you create Delaunay polygons and the result looks like the following figure


28 9.2.6 Create hexagon bins layer The next polygon type you can create from Excel data is called hexagon bins. These polygons statistically summarize values in selected areas. Three configurable parameters are displayed when you select hexagon bins in the Feature Type combo box. Explanation: First, you set the Count parameter. This defines the minimum number of poylgons in a row or column. If the coordinate range is smaller on the x-axis, this parameter will be applied to polygons rows. If the range of scale values is smaller on the y-axis, the minimum number of polygons will be used for the polygon columns


29 The following figure gives an example of created heagonal polygons. It displays the number of points in the Excel spreadsheet which fall under the individual polygons. You also set a value for individual hexagon polygons. Here, you can use the Count of points, or you can use a selected statistical function you can apply to a selected column from your Excel table (For Example; Average value) Create tiles layer The penultimate map features you can create from Excel data are Tiles rectangular polygons. Their character is similar to the previous hexagonal polygons; the only difference is their geometry. Tiles are actually simple squares, similar to rasters, and the only difference is that they are defined in vector form. You will see additional adjustable parameters when you select Tiles in the Feature Type combo box
 or size with the Cells Definition radio button. Then you enter the desired value in the Value text box.")
30 Explanation: The first two adjustable parameters define the number of generated Tiles. You set whether you want to generate tiles based on their minimum number (count) or size with the Cells Definition radio button. Then you enter the desired value in the Value text box. You set the Excel table column from which the values will be processed similar to the hexagons, and you define the statistical function you want to use. Generating Tiles has more feature options than the previous feature types. Here, you can set if you want tiles created in areas where there are no points by using the Allow Empty check box. The Tile map layer example below did not allow empty tiles Create buffer polygon layer The last feature type you can create with add-in are buffer polygons. If you choose this type, it is necessary to set the distance at which are polygons created. The values used for this distance are the same as you use for tiles; and are always defined in the same units as your coordinates. Therefore when you use the metric coordinate system, your values are in meters and when you use the WGS84 coordinate system your values are in degrees
 from your Excel spreadsheet. 9.")

31 When you have defined your buffer distance, click Apply, and add-in will generate a new map layer as in the following figure. The buffer is generated for each individual record (point) from your Excel spreadsheet. 9.3 Update existing GIS layer The second function from the Excel to GIS group will update the attribute table of your existing Map Layer ShapeFile. The following example explains the feature functionality. I loaded a polygon layer of districts into the map panel, and I have a list of springs with their parameters, such as spring yield and temperature in the Excel table. This feature s functionality is explained by the following diagram and the text below it 30 56

32 First you select the data in the Excel table you want to use in the Map Layer update. As in the previous examples, you can use Excel features such as Filters. After your Excel data selection, click on the ribbon button Excel to GIS Update Layer; and the following dialog is displayed. This dialog is similar to the previous one. The upper part of the window has the table characterizing selected Excel data. The nature of the function is defined in the bottom of the dialog. Select the map layer you want to update in the first Map Layer combo box Then you must define the connection between the Excel table and the Map Layer. There are three connection methods. The first is to connect via Coordinates. If you choose this option, the map layer will be updated on the basis of spatial connections. The individual records from your Excel table updates the map layer features if the Excel table record intersects the map feature. If this happens, the row from the table will be used further in the algorithm

33 The second connection is through the values in the Excel table and values in the attribute table of the Map Layer. If the values from the selected columns in the tables are the same, the row from the Excel table will be used to update the feature in the Map Layer. The last connection is called ROW ID. This is a specific link that has great importance during manual editing of the Map Layer attribute table. This connection assumes that a column exists in the Excel table that identifies the individual features in the Map Layer. This identifier is defined as an integer number that indicates the order of features in the Map Layer, and it begins by numbering the first feature 0 (zero). This connection can be used, for example, if you want to directly edit the whole Map Layer attribute table in the Excel spreadsheet. Here, you firstly export the whole attribute table to Excel through the GIS to Excel Eport Layer function. You can easily export the Map Layer attribute table into the Excel spreadsheet, use powerful Excel features such as dynamic formulas or filters and then paste the calculated result back into the map layer attribute table. Exporting is explained in detail in chapter 10 GIS to Excel When you define the connection, you can continue with function setup. If the selected connection is defined through spatial coordinates, you will also see information about the coordinate system used. You then define a column in the Map Layer attribute table you want to update. In addition to the existing column, you can also create a new column here that will be added to the table. Then press the New button and the small dialog Create New Column appears where you define your new column. Its definition is based on data type and name. Click Apply and the new column will be added to your attribute table and you can use it for Map Layer updating. My example above created a new column for numerical values labeled Q_sum. When you select your column for update, you must then select the column from the Excel table that will update the 32 56


34 attribute table. The above example used a column containing values for spring yields. Since one row in the attribute table can be linked with multiple rows in the Excel table, you have to determine the statistical function you want to use to pre-process the result for update. If the tables are linked 1:1, choose the First or Last item from the statistical functions. You can use also use these items if you want to update columns with string data type. The following figure shows the entire dialog with all function parameters. Here, I am going to update a polygon map layer connected to my Excel table through coordinates. I update the newly created column Q_sum, where I want to insert the yields sum of all springs that intersect my polygons. When you have set all parameters, click Apply and add-in automatically updates the Map Layer attribute table. This process can take longer, depending on the number of records in your Excel table and the number of features in the Map Layer. You are then advised that the update is completed in the next message box. When the map layer updating is finished, you can use standard GIS interface features to visualize the results

35 WARNING Changes you make in individual map layers are not automatically saved on computer disk. If you want to save, select the map layer in the Legend panel and then click the Save Layer button inthe ribbon toolbar. This refers to both Excel and GIS functions

36 10 GIS to Excel The GIS to Excel functions have the reverse purpose to the previous Excel to GIS work. They allow you to create or update your Excel table with Map Layer data. This has two functions exporting map data to your new Excel table, and updating your existing Excel table using the spatial data on your map Export map data This Export Map Data function exports your data from the selected map layer onto an Excel spreadsheet. My following extended example of how this funtion works begins with the illustation of digitalized water areas in Slovakia shown below. Here, I have a layer with 1,717 digitized surfaces. When I click-up the layer attribute table, I see that it contains multiple values. [One is the lake/water area name--under NAZVPL]


37 Now I want to export all named lakes from the described map layer, so I select them by clicking on the Selection Query item in the menu. This displays the Expression Editor dialog where I can select the named lakes using the SQL dialog command (Selection-Query Line command [NAZVPL] gives me the lake names. I click the OK button, and all features with a name are selected. Then I close the attribute table window


38 When I want to export only selected features, I create a new map layer using the Selection Create Layer from Selected Features command in the Legend panel context menu The new layer is created in both the Map and Legend panels, and it now contains only the named lakes. If I want to export these features to Excel, I click on the GIS to Excel Export Map Data ribbon toolbar item to display the dialog in the following figure. Now, you can choose the Layer you want to export in the Export Layer top combo box. After selecting the Map Layer, it automatically fills the bottom table. This table contains the values you can 37 56
39 export to the Excel table. The first data in the table shows the layer attribute table columns, and then you have the derived values that can be exported. The Feature$ID indicates the first derived parameter for the vector Map Layer This feature identifier is in the format of an integer number, and it is unique for each feature in the Map Layer. For example, it can be used for connection, if you want to quickly import edited values back from the Excel table to your Map Layer attribute table ( See chapter 9.3 Update Existing GIS Layer). You can also link this value in the connection method named RowID. The following exportable values vary depending on whether you choose to export layers of points, lines or polygons. If you choose points, you can export only the X and Y coordinates of each point, but for lines, you can also export the value of the selected line; and if you choose polygon layers, you can export the coordinates of the centroid feature, the polygon perimeter and also the area values. Checking the box in the second column of the table defines the given values you want to add to the export. When you click Apply, your selected values are exported to the clipboard; and the next message box tells you this process is completed. You can now insert your exported values in a spreadsheet by pressing Ctrl+V. After this, you can work with your values using conventional Excel features, including sorting, filtering, dynamic formulas and cell coloring


40 If you want, you can also import your values back to the Map Layer after editting, using the Excel to GIS Update Layer command Update Excel table The second function from the GIS to Excel group enables you to enrich your existing Excel tables with new data from the Map Layer. An example is shown in the following Excel table. The table has a list of springs with their coordinates; you want to determine the geological unit for all the listed springs and you have stored all the information on the geological units in the evaluated area in your polygon Map Layer

41 As in previous cases, first you select a table in the Excel spreadsheet with a column where you want to insert your geological information. Then you click on the GIS to Excel Update Table ribbon button, and this displays the dialog. Its character is the same as in the previous cases. The top of the window has the names of the selected columns from the Excel spreadsheet and their data format; and you define all the parameters for function in the bottom of the window. In the first combo box you choose the Map Layer with all your data. Then, you set the type of connection between the Excel table and Map layer, and their parameters. [Chapter 9.3--Update Existing GIS Layer tells you all about connection options]. In my example, I connect through the spatial coordinates of the spring positions. Now, I define the Excel table column where I want to insert data. In this case, I can insert data from the map layer attribute table or from the spatial data. For example, I could insert the geological unit ID from the attribute table, or the polygon area, the line length or whatever I want. Finally, I define the function for data processing; if I define 1:1 link between the Excel table and map layer, it is sufficient to use function First. If I define link 1:N, select the most appropriate function for your work (Sum, Average, Maximum). When you define all settings, click Apply; and add-in connects the data and updates the Excel table with your information. In my example, I inserted the geological units where each spring was located in the Geology ID column 40 56


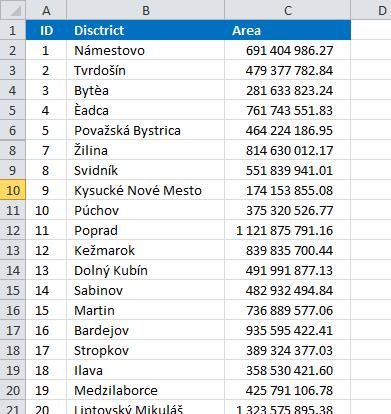
42 You can understand the Update Excel Table function by this example. Here, you have a table with a list of country districts and a map layer of polygons that spatiallybind the districts. Now you can update the Area column in your Excel table with area values for individual districts, as follows;
43 First, select Excel table columns in which you can operate. Then click on the GIS to Excel Update Table ribbon button for the dialog in the next figure; below. You set the individual parameters in this window as you did in the previous example. In the first combo box, Select the Map Layer with district polygons. Your Excel table connects with the Map Layer via columns in the Excel table and the Map Layer attribute table. You specify that your data will be entered in the Area Excel table column. In the By GIS Column combo box, you select the Polygon$Area spatial function at the bottom of the list [Do not select a column from the map layer attribute table; because if add-in finds a line with the same district name in the Excel table as in the Map Layer attribute table, add-in automatically calculates the district area and this value will be used.] Since this is a 1:1 connection one unique district occurs in the Excel table and Map Layer only once; you select First in the With Function combo box. Then just click Apply and the algorithm starts. The settings program determines the necessary values and automatically inserts them in the table. As in previous cases, if you only want to update part of the Excel table, use the Filter Excel function to hide unnecessary rows; and only the visible rows will be updated
44 43 56


45 11 Special Features The Special Features function group includes 4 extra functions with special importance. The first function enables you to export selected Map Layers or the entire map to a KML file that can be opened in Google Earth. The second allows you to calculate various statistical analyses of selected map layers, and the last two features let you clip map layers and create buffer polygons from selected map layers Export to KML The KML file is a specific file format for storing spatial data, and it can be opend in many programs. The most commonly is used in Google Earth. Add-in allows you to export your spatial data from Excel directly to Google Earth using the KML file. You can also export data from ESRI Shapefiles or images to a KML by fulfilling two conditions. The first is, you must set the coordinate system in the Map panel to WGS84. Chapter 8 describes how to change the coordinate system if you want to use a different one. The second condition is, you must have at least one map layer displayed in the Map panel
![You can export one selected Map Layer to a KML file in vector format or all the layers shown in the Map panel as a bitmap. [First we describe how to export one selected layer in vector format].](/docs-images/73/68829545/images/46-0.jpg "When you have at least one layer displayed in the Map panel, click on the ribbon button Special Export to KML to display the following dialog.")
46 You can export one selected Map Layer to a KML file in vector format or all the layers shown in the Map panel as a bitmap. [First we describe how to export one selected layer in vector format]. When you have at least one layer displayed in the Map panel, click on the ribbon button Special Export to KML to display the following dialog. If you want to export only one layer, leave the first check box Export as Image unchecked, and choose the map layer you want to export in the Layer combo-box. You can export points, lines or polygons into Google Earth. After selecting your Map Layer, in the second combo box you select a column from the attribute table that appears in Google Earth map under Label. Finally, click Apply and add-in generates the KML file. After completing this process, which can take longer if you export a large set of features, a message box is displayed asking if you want to open the new layer in Google Earth (if Google Earth is installed in your computer) If you click Yes in message box, new KML file will automatically open in Google Earth. In addition to your spatial data in vector format, all data from the attribute table is also exported into the KML file. Clicking on the selected object displays them in Google Earth


47 This way you can export individual Map Layers in vector format. Add-in also includes one more export option. Imagine that you have displayed multiple Map Layers with defined visual properties in the Map panel, and you can also see them in Google Earth. Click on Special Export to KML to display this dialog

48 If you want to export all the map layers at once, click the first check box Export as Image and click Apply. This command exports themap panel contents as a picture and displays it geo-referenced directly in Google Earth. The great things here are that the map is exported into the program with all visual settings that you made, and the map image is exported in the same resolution as shown in your Map panel Stats in Polygons Another interesting feature is under the button Special Stats in Polygons. Using this feature, you can create statistical analysis and summaries from one map layer of polygons to a second layer. An example is shown in the following figure. One polygon layer displays districts and the second contains springs localized in the area of interest with data stored in the attribute table; such as water temperature, mineralization or the yield of the water sources. The column named T_Kat contains information of the spring s categorization; either above or below 10 C; and this parameter sets all points in the Map Panel in the appropriate color for < 10 C and > 10 C

49 You can use Special Stats in Polygon for the following imagined function. Imagine you want to find the summary of yields for all springs in individual districts, and want to calculate this sum individually for springs with temperature < 10 C and springs with temperature > 10 C. Now click Special Stats in Polygon to display the following dialog. Here, you define your parameters. First choose the Stats for Layer that contains district polygons which delineate the areas. Then define the column from the attribute table that indentifies the individual districts, such as the name of the district. Choose the layer you want to calculate your statistics from in Data Layer. In this example springs are stored in the layer named Springs. If you want to 48 56

50 calculate the yield statistics for all the springs in the district, leave the Group By combo box empty. But, if you want to calculate the sum of yields individually for the < 10 C and > 10 C, put T kat in the Group By combo box. In the Stat Mode combo box you have a choice Attribute Data or Spatial Data. If you want to calculate statistics based on the data stored in attribute table, select the Attribute Data option; and then select the column you want to use for statistics in the Processing Column combo box. In this imaginary case, spring yields are stored in column Q. Finally, select the processing function. Next, choose the Sum function because you want the summary yield. After defining all these parameters, click Apply and addin will compute your stastistical parameters. If you have a lot of data in the layers, this may take longer to process. The next message box informs you that your statistics results will be saved to the clipboard; and you can paste the result into the spreadsheet using the Ctrl+V command. The example result is shown in the figure below. The Item column contains your district names which identify your polygons. When you define the Group By combo box, the Group identification is listed in the next column. Finally, the selected statistical parameter is in the last column under Value. The following example automatically counted the springs yields in individual districts and individually summed values for springs with temperatures above and below 10 C. The next example for your statistical analyses uses the spatial characteristics of layer features and the same district polygons (instead of values from the attribute table layer used in the previous 49 56


51 example). The statistical parameters are computed from the line layer that defines the area s river network. Your imagined task here is to calculate the lengths of all rivers and streams in individual districts. Select the layer for computing vodne_toky (= water-flows ) in the Data Layer combo box for your river network. There are no groups of rivers so leave the Group By combo box empty. Select the Spatial Data item in the Stat Mode combo box which enables you to calculate the spatial characteristics directly from individual features. Then choose the Length item in the Function combo box, and this automatically detects the length of each feature in your polygons. Finally click Apply, and add-in calculates the desired river/stream length values and save them to the clipboard. Pressing Ctrl+V keys then pastes the following table to the Excel spreadsheet 50 56


52 The Item column lists your districts. The Group column remains empty, and the last column contains the summary length of rivers and streams in each district. Be careful of the coordinate system you used here; because if you used WGS84, the length values are in degrees, and the metric coordinate system gives the lengths in meters. This described spatial analysis can be performed on lines, points and polygons; and you can calculate lengths, centroid coordinates, areas and the total number of features in the defined polygons Intersect Layer A further interesting feature is hiden under the Special Intersect Layer button. Imagine again, that you want to cut some items out of your existing rivers and streams map. For example, you want to cut all rivers and streams in one district from your complete rivers and streams map; and you have the district you want to cut ready in a polygon in another Map Layer. Clicking on the defined Intersect Map Layer button displays the dialog below. Choose the layer you want to cut in the first Intersect layer combo box. Select your polygon in the By Layer box and type the new layer name in the New Layer Name box. Be careful here, because if you leave the Clip Layer box 51 56


53 empty, add-in will select all the rivers that fall within the polygon, but it will not crop them along the polygon edges if they exceed the polygon area. Finally, click Apply, and add-in processes the function, and advises you the number of features in your new layer; as below. The result of your defined function is also shown in the following figure

54 If you want to crop the rivers and streams along the edges of the polygon, check the Clip Layer combo box in the dialog. The river and stream lines are now trimmed at the polygon edges; as shown in the following figure Create Buffer Using the last function in the current version of add-in, you can create buffer polygons around features in a selected Map Layer.These buffers can be created for points, lines and polygons. This function is performed in the Map Layer of rivers
55 If you want to create a new Map Layer of buffer zones around the rivers click Special Create Buffer. The add-in feature displays a dialog with three adjustable parameters. In the first combo box choose the map Selected Layer where you want to create buffers. Then type your numerical distance value in the Buffer Distance text box, in the same units as your coordinate system, and finally type the new Map Layer name. Clicking Apply creates a new layer in the Map panel that contains your defined buffer polygons. The following figure shows buffers created at 50, 200 and 600 meters

56 Remember that your newly created map layers exist only in computer memory. If you want to use them after you close Excel, be sure to save them on a disk
57 12 Conclusion The previous chapters defined the functionality of GIS.XL add-in. This add-in includes a number of features and functions that can save you a lot of time if you have stored data with spatial character in Excel spreadsheets. Add-in has been designed to be easy to use, and it contains a number of features to combine with Excel and other large software packages to make your overall work much simpler. By definition, Add-in does not contain all the functionality we are accustomed to in large, robust GIS software solutions. The development of add-in features is still continuing, and in the future you can look forward to new features and improvements. If you have any questions, comments or requests, I will be very happy to help, and Iappreciate all comments and suggestions. Please contact me via at milos.gregor@gisxl.com
MAPLOGIC CORPORATION. GIS Software Solutions. Getting Started. With MapLogic Layout Manager
 MAPLOGIC CORPORATION GIS Software Solutions Getting Started With MapLogic Layout Manager Getting Started with MapLogic Layout Manager 2011 MapLogic Corporation All Rights Reserved 330 West Canton Ave.,
A Practical Guide to Using QGIS
 A Practical Guide to Using QGIS 1.1 INTRODUCTION Quantum GIS (QGIS) is a useful mapping software that enables the compilation and displaying of spatial data in the form of a map. Gaining experience in
Introduction to using QGIS for Archaeology and History Workshop by the Empirical Reasoning Center
 Introduction to using QGIS for Archaeology and History Workshop by the Empirical Reasoning Center In this workshop, we will cover the basics of working with spatial data, as well as its main uses for archaeology.
Introduction to GIS 2011
 Introduction to GIS 2011 Digital Elevation Models CREATING A TIN SURFACE FROM CONTOUR LINES 1. Start ArcCatalog from either Desktop or Start Menu. 2. In ArcCatalog, create a new folder dem under your c:\introgis_2011
_Tutorials. Arcmap. Linking additional files outside from Geodata
 _Tutorials Arcmap Linking additional files outside from Geodata 2017 Sourcing the Data (Option 1): Extracting Data from Auckland Council GIS P1 First you want to get onto the Auckland Council GIS website
GIS Basics for Urban Studies
 GIS Basics for Urban Studies Date: March 21, 2018 Contacts: Mehdi Aminipouri, Graduate Peer GIS Faciliator, SFU Library (maminipo@sfu.ca) Keshav Mukunda, GIS & Map Librarian Librarian for Geography (kmukunda@sfu.ca)
INTRODUCTION TO GIS WORKSHOP EXERCISE
 111 Mulford Hall, College of Natural Resources, UC Berkeley (510) 643-4539 INTRODUCTION TO GIS WORKSHOP EXERCISE This exercise is a survey of some GIS and spatial analysis tools for ecological and natural
Press the Plus + key to zoom in. Press the Minus - key to zoom out. Scroll the mouse wheel away from you to zoom in; towards you to zoom out.
 Navigate Around the Map Interactive maps provide many choices for displaying information, searching for more details, and moving around the map. Most navigation uses the mouse, but at times you may also
Geographical Information Systems Institute. Center for Geographic Analysis, Harvard University. LAB EXERCISE 1: Basic Mapping in ArcMap
 Harvard University Introduction to ArcMap Geographical Information Systems Institute Center for Geographic Analysis, Harvard University LAB EXERCISE 1: Basic Mapping in ArcMap Individual files (lab instructions,
v Getting Started An introduction to GMS GMS Tutorials Time minutes Prerequisite Tutorials None
 v. 10.3 GMS 10.3 Tutorial An introduction to GMS Objectives This tutorial introduces GMS and covers the basic elements of the user interface. It is the first tutorial that new users should complete. Prerequisite
MAPLOGIC CORPORATION. GIS Software Solutions. Getting Started. With MapLogic Layout Manager
 MAPLOGIC CORPORATION GIS Software Solutions Getting Started With MapLogic Layout Manager Getting Started with MapLogic Layout Manager 2008 MapLogic Corporation All Rights Reserved 330 West Canton Ave.,
Importing GPS points and Hyperlinking images.
 Geol 3050 GIS for Geologists Exercise 15 Exercise 15 Making a Virtual Fieldtrip: Importing GPS points and Hyperlinking images. Due: Thursday, March 22. Goal: A) Get familiar with importing GPS points and
v Introduction to WMS WMS 11.0 Tutorial Become familiar with the WMS interface Prerequisite Tutorials None Required Components Data Map
 s v. 11.0 WMS 11.0 Tutorial Become familiar with the WMS interface Objectives Import files into WMS and change modules and display options to become familiar with the WMS interface. Prerequisite Tutorials
Quick Guide to MapWindow GIS Desktop Application
 Quick Guide to MapWindow 1 Quick Guide to MapWindow GIS Desktop Application Version 2 January 2007 Adapted by Tom Croft. This is a summary user guide for commonly used tools and capabilities and does not
EXCEL BASICS: MICROSOFT OFFICE 2010
 EXCEL BASICS: MICROSOFT OFFICE 2010 GETTING STARTED PAGE 02 Prerequisites What You Will Learn USING MICROSOFT EXCEL PAGE 03 Opening Microsoft Excel Microsoft Excel Features Keyboard Review Pointer Shapes
HydroOffice Diagrams
 Hydro Office Software for Water Sciences HydroOffice Diagrams User Manual for Ternary 1.0, Piper 2.0 and Durov 1.0 tool HydroOffice.org Citation: Gregor M. 2013. HydroOffice Diagrams user manual for Ternary1.0,
1. MS EXCEL. a. Charts/Graphs
 1. MS EXCEL 3 tips to make your week easier! (MS Excel) In this guide we will be focusing on some of the unknown and well known features of Microsoft Excel. There are very few people, if any at all, on
Geological mapping using open
 Geological mapping using open source QGIS MOHSEN ALSHAGHDARI -2017- Abstract Geological mapping is very important to display your field work in a map for geologist and others, many geologists face problems
EXCEL BASICS: MICROSOFT OFFICE 2007
 EXCEL BASICS: MICROSOFT OFFICE 2007 GETTING STARTED PAGE 02 Prerequisites What You Will Learn USING MICROSOFT EXCEL PAGE 03 Opening Microsoft Excel Microsoft Excel Features Keyboard Review Pointer Shapes
ArcView QuickStart Guide. Contents. The ArcView Screen. Elements of an ArcView Project. Creating an ArcView Project. Adding Themes to Views
 ArcView QuickStart Guide Page 1 ArcView QuickStart Guide Contents The ArcView Screen Elements of an ArcView Project Creating an ArcView Project Adding Themes to Views Zoom and Pan Tools Querying Themes
City of Richmond Interactive Map (RIM) User Guide for the Public
 User Guide for the Public") Interactive Map (RIM) User Guide for the Public Date: March 26, 2013 Version: 1.0 3479477 3479477 Table of Contents Table of Contents Table of Contents... i About this
Interactive Map (RIM) User Guide for the Public Date: March 26, 2013 Version: 1.0 3479477 3479477 Table of Contents Table of Contents Table of Contents... i About this
Introduction to district compactness using QGIS
 Introduction to district compactness using QGIS Mira Bernstein, Metric Geometry and Gerrymandering Group Designed for MIT Day of Engagement, April 18, 2017 1) First things first: before the session Download
Objectives Learn how to import and display shapefiles with and without ArcObjects. Learn how to convert the shapefiles to GMS feature objects.
 v. 10.0 GMS 10.0 Tutorial Importing, displaying, and converting shapefiles Objectives Learn how to import and display shapefiles with and without ArcObjects. Learn how to convert the shapefiles to GMS
Spreadsheet definition: Starting a New Excel Worksheet: Navigating Through an Excel Worksheet
 Copyright 1 99 Spreadsheet definition: A spreadsheet stores and manipulates data that lends itself to being stored in a table type format (e.g. Accounts, Science Experiments, Mathematical Trends, Statistics,
COPYRIGHTED MATERIAL. Making Excel More Efficient
 Making Excel More Efficient If you find yourself spending a major part of your day working with Excel, you can make those chores go faster and so make your overall work life more productive by making Excel
Data Assembly, Part II. GIS Cyberinfrastructure Module Day 4
 Data Assembly, Part II GIS Cyberinfrastructure Module Day 4 Objectives Continuation of effective troubleshooting Create shapefiles for analysis with buffers, union, and dissolve functions Calculate polygon
Undo Button Clicking this tool will undo the last action. Clicking on this tool multiple times will undo all subsequent changes that were made.
 SMS Featured Icons: Editor Window This document includes a brief description of the tools in the SMS Desktop Software Editor windows, as well as showing you the toolbar shortcuts to easily access these
1 Introduction to Using Excel Spreadsheets
 Survey of Math: Excel Spreadsheet Guide (for Excel 2007) Page 1 of 6 1 Introduction to Using Excel Spreadsheets This section of the guide is based on the file (a faux grade sheet created for messing with)
QUANTUM GIS GUIDE FOR WASH FACILITY DATA COLLECTORS AND -MANAGERS
 COWASH Training Quantum GIS 1 QUANTUM GIS GUIDE FOR WASH FACILITY DATA COLLECTORS AND -MANAGERS Quantum GIS (QGIS) is widely used open source GIS software which usage is very similar to GIS-software market
This user guide covers select features of the desktop site. These include:
 User Guide myobservatory Topics Covered: Desktop Site, Select Features Date: January 27, 2014 Overview This user guide covers select features of the desktop site. These include: 1. Data Uploads... 2 1.1
v TUFLOW-2D Hydrodynamics SMS Tutorials Time minutes Prerequisites Overview Tutorial
 v. 12.2 SMS 12.2 Tutorial TUFLOW-2D Hydrodynamics Objectives This tutorial describes the generation of a TUFLOW project using the SMS interface. This project utilizes only the two dimensional flow calculation
Exercise 1: Getting to know ArcGIS
 The Scenario You are working for the California Visitor s Commission. You have been asked to prepare a map of California for several dignitaries from out of the country. Your map will need to include enough
GIS DATA SUBMISSION USER GUIDE. Innovation and Networks Executive Agency
 Innovation and Networks Executive Agency GIS DATA SUBMISSION USER GUIDE Innovation and Networks Executive Agency (INEA) W910 Chaussée de Wavre 910 B-1049 Brussels, Belgium Tel: +32 (0)2 29 95252 Fax: +32
Google FusionTables for Global Health User Manual
 Google FusionTables for Global Health User Manual Version: January 2015 1 1. Introduction... 3 Use Requirements... 3 Video Tutorials... 3 2. Getting started with Google FusionTables... 4 2.1. Setup...
USING CCCR S AERIAL PHOTOGRAPHY IN YOUR OWN GIS
 USING CCCR S AERIAL PHOTOGRAPHY IN YOUR OWN GIS Background: In 2006, the Centre for Catchment and Coastal Research purchased 40 cm resolution aerial photography for the whole of Wales. This product was
Carlson GIS for Surveyors
 Professional Land Surveyors of Ohio 2016 Annual Conference -- Dayton Ohio Carlson GIS for Surveyors Presented by Who Is That CAD Girl? Jennifer DiBona is a long time CAD consultant and trainer doing business
u D i g W a l k t h r o u g h 2 E d i t w i t h u D i g a n d W F S - T
 E di t wi th ud ig a nd WFS -T Table of Contents 1 Introduction... 3 2 WMS and WFS Integration... 4 3 Editing Geometry with WFS... 8 4 Working with Attributes... 11 5 Exporting to Shape file... 14 6 Take
Building Vector Layers
 Building Vector Layers in QGIS Introduction: Spatially referenced data can be separated into two categories, raster and vector data. This week, we focus on the building of vector features. Vector shapefiles
What s New in Desktop 10.1
 What s New in Desktop 10.1 Damian Spangrud Esri Redlands Trip Down Memory Lane ArcGIS A Complete System for Geographic Information Cloud Web Online Mobile Enterprise Desktop Sharing Information sharing
Technical White Paper
 Technical White Paper Via Excel (VXL) Item Templates This technical white paper is designed for Spitfire Project Management System users. In this paper, you will learn how to create Via Excel Item Templates
User Guide DYMO Label TM v.8
 User Guide DYMO Label TM v.8 Copyright Trademarks 2012-2015 Sanford, L.P. All rights reserved. Revised 9/6/2016. No part of this document or the software may be reproduced or transmitted in any form or
The ArcGIS Integration, User Guide. ArcGISv1.01_GEv4.2_UK_User_Guide, 4Ed,pdf.docNumber of pages: 26 Printed:
 The ArcGIS Integration, User Guide ArcGISv1.01_GEv4.2_UK_User_Guide, 4Ed,pdf.docNumber of pages: 26 Printed: 30-04-03 GeoEnviron 4.2 Table of Contents Table of Contents Introduction...3 Development of
Mid-West ESRI Utility User s Group Conference. March 26, 2014
 Mid-West ESRI Utility User s Group Conference March 26, 2014 Presented by: Hillary Bjorstrom, GIS Analyst STAR Energy Services LLC 1 What are Data Driven Pages? Data Driven Pages Workflow Creating an Index
STUDENT PAGES GIS Tutorial Treasure in the Treasure State
 STUDENT PAGES GIS Tutorial Treasure in the Treasure State Copyright 2015 Bear Trust International GIS Tutorial 1 Exercise 1: Make a Hand Drawn Map of the School Yard and Playground Your teacher will provide
Content provided in partnership with Que, from the book Show Me Microsoft Office Access 2003 by Steve JohnsonÃÃ
 ,PSURYLQJWKH$SSHDUDQFHRI )RUPVDQGHSRUWV Content provided in partnership with Que, from the book Show Me Microsoft Office Access 00 by Steve JohnsonÃÃ Introduction The objects in a database most on display
Sedao Ltd. QuickChange PROject. User Manual for QuickChange PROject version 2.1.5
 Sedao Ltd QuickChange PROject User Manual for QuickChange PROject version 2.1.5 Contents What is QuickChange PROject?... 2 Simple Artwork Creation... 5 Creating a project... 7 QuickChange PROject Template
Tricks and Tips of Creating a Layered, Geo-Enabled Adobe PDF Map
 Tricks and Tips of Creating a Layered, Geo-Enabled Adobe PDF Map John M. Bocan GIS Programmer/Analyst West Virginia Geological and Economic Survey (WVGES) Digital Mapping Techniques Williamsburg, VA. May
Geography 104 Instructors: Judd Curran & Mark Goodman. LAB EXERCISE #3 Data Analysis - Buffering (25pts)
") Instructors: Judd Curran & Mark Goodman Name: LAB EXERCISE #3 Data Analysis - Buffering (25pts) Transformations in GIS are methods that transform GIS objects and databases into more useful products using
Instructors: Judd Curran & Mark Goodman Name: LAB EXERCISE #3 Data Analysis - Buffering (25pts) Transformations in GIS are methods that transform GIS objects and databases into more useful products using
Tutorial 1: Finding and Displaying Spatial Data Using ArcGIS
 Tutorial 1: Finding and Displaying Spatial Data Using ArcGIS This tutorial will introduce you to the following: Websites where you may browse to find geospatial information Identifying spatial data, usable
GIS LAB 8. Raster Data Applications Watershed Delineation
 GIS LAB 8 Raster Data Applications Watershed Delineation This lab will require you to further your familiarity with raster data structures and the Spatial Analyst. The data for this lab are drawn from
Explore some of the new functionality in ArcMap 10
 Explore some of the new functionality in ArcMap 10 Scenario In this exercise, imagine you are a GIS analyst working for Old Dominion University. Construction will begin shortly on renovation of the new
Welcome to the Surface Water Data Viewer!
 1 Welcome to the Surface Water Data Viewer! The Surface Water Data Viewer is a mapping tool for the State of Wisconsin. It provides interactive web mapping tools for a variety of datasets, including chemistry,
Working with Attribute Data and Clipping Spatial Data. Determining Land Use and Ownership Patterns associated with Streams.
 GIS LAB 3 Working with Attribute Data and Clipping Spatial Data. Determining Land Use and Ownership Patterns associated with Streams. One of the primary goals of this course is to give you some hands-on
kalmstrom.com Business Solutions
 Kanban Task Manager for Outlook Manual Table of contents 1 INTRODUCTION...3 1.1 LANGUAGES...4 1.2 REQUIREMENTS...4 1.3 SYSTEMS...4 2 INSTALLATION OF KANBAN TASK MANAGER...6 2.1 INTRODUCTION...6 2.2 PROCESS...6
A Second Look at DEM s
 A Second Look at DEM s Overview Detailed topographic data is available for the U.S. from several sources and in several formats. Perhaps the most readily available and easy to use is the National Elevation
1. Preparing the base map. 2. Creating new shapefiles. Collecting Spatial Data by Digitizing
 Topics: 1. Preparing the base map 2. Creating new shapefiles 3. Digitizing Features 4. Modifying Existing Features 5. Adding Data Fields and editing Feature Attributes 6. Displaying and Labelling features
GIS DATA SUBMISSION USER GUIDE. Innovation and Networks Executive Agency
 Innovation and Networks Executive Agency GIS DATA SUBMISSION USER GUIDE Innovation and Networks Executive Agency (INEA) W910 Chaussée de Wavre 910 B-1049 Brussels, Belgium Tel: +32 (0)2 29 95252 Fax: +32
Map Library ArcView Version 1 02/20/03 Page 1 of 12. ArcView GIS
 Map Library ArcView Version 1 02/20/03 Page 1 of 12 1. Introduction 1 ArcView GIS ArcView is the most popular desktop GIS analysis and map presentation software package.. With ArcView GIS you can create
kalmstrom.com Business Solutions
 Kanban Task Manager Single Manual 1 INTRODUCTION... 3 1.1 LANGUAGES...4 1.2 REQUIREMENTS...4 1.3 SYSTEMS...4 2 INSTALLATION OF KANBAN TASK MANAGER... 5 2.1 INTRODUCTION...5 2.2 PROCESS...5 2.3 FILES...8
GIS Workshop Spring 2016
 1/ 14 GIS Geographic Information System. An integrated collection of computer software and data used to view and manage information about geographic places, analyze spatial relationships, and model spatial
Manitowoc County, WI Advanced Access GIS Viewer User Documentation
 Manitowoc County, WI Advanced Access GIS Viewer User Documentation Introduction Extensive time was put into developing this website both from a display, and from a printing and scaling perspective. This
TABLE OF CONTENTS. TECHNICAL SUPPORT APPENDIX Appendix A Formulas And Cell Links Appendix B Version 1.1 Formula Revisions...
 SPARC S INSTRUCTIONS For Version 1.1 UNITED STATES DEPARTMENT OF AGRICULTURE Forest Service By Todd Rivas December 29, 1999 TABLE OF CONTENTS WHAT IS SPARC S?... 1 Definition And History... 1 Features...
1.a) Go to it should be accessible in all browsers
 Go to it should be accessible in all browsers") ECO 445: International Trade Professor Jack Rossbach Instructions on doing the Least Traded Product Exercise with Excel Step 1 Download Data from Comtrade [This step is done for you] 1.a) Go to http://comtrade.un.org/db/dqquickquery.aspx
ECO 445: International Trade Professor Jack Rossbach Instructions on doing the Least Traded Product Exercise with Excel Step 1 Download Data from Comtrade [This step is done for you] 1.a) Go to http://comtrade.un.org/db/dqquickquery.aspx
D2M2 - GIS USER'S MANUAL
 D2M2 - GIS USER'S MANUAL USACE ERDC, July 2012 1 Content Overview of D2M2... 3 User Interface... 4 Menus... 4 File Menu... 4 Edit Menu... 5 View Menu... 5 Layer Menu... 6 Analysis Menu... 6 Tools Menu...
Creating a Histogram Creating a Histogram
 Creating a Histogram Another great feature of Excel is its ability to visually display data. This Tip Sheet demonstrates how to create a histogram and provides a general overview of how to create graphs,
Introduction to GIS & Mapping: ArcGIS Desktop
 Introduction to GIS & Mapping: ArcGIS Desktop Your task in this exercise is to determine the best place to build a mixed use facility in Hudson County, NJ. In order to revitalize the community and take
Excel Format cells Number Percentage (.20 not 20) Special (Zip, Phone) Font
 Special (Zip, Phone) Font") Excel 2013 Shortcuts My favorites: Ctrl+C copy (C=Copy) Ctrl+X cut (x is the shape of scissors) Ctrl+V paste (v is the shape of the tip of a glue bottle) Ctrl+A - or the corner of worksheet Ctrl+Home Goes
Excel 2013 Shortcuts My favorites: Ctrl+C copy (C=Copy) Ctrl+X cut (x is the shape of scissors) Ctrl+V paste (v is the shape of the tip of a glue bottle) Ctrl+A - or the corner of worksheet Ctrl+Home Goes
Downloading and importing DEM data from ASTER or SRTM (~30m resolution) into ArcMap
 into ArcMap") Downloading and importing DEM data from ASTER or SRTM (~30m resolution) into ArcMap Step 1: ASTER or SRTM? There has been some concerns about the quality of ASTER data, nicely exemplified in the following
Downloading and importing DEM data from ASTER or SRTM (~30m resolution) into ArcMap Step 1: ASTER or SRTM? There has been some concerns about the quality of ASTER data, nicely exemplified in the following
Chapter 4 Determining Cell Size
 Chapter 4 Determining Cell Size Chapter 4 Determining Cell Size The third tutorial is designed to give you a demonstration in using the Cell Size Calculator to obtain the optimal cell size for your circuit
Import, view, edit, convert, and digitize triangulated irregular networks
 v. 10.1 WMS 10.1 Tutorial Import, view, edit, convert, and digitize triangulated irregular networks Objectives Import survey data in an XYZ format. Digitize elevation points using contour imagery. Edit
Getting Started Guide
 SnagIt Getting Started Guide Welcome to SnagIt Thank you for your purchase of SnagIt. SnagIt is the premier application to use for all of your screen capturing needs. Whatever you can see on your screen,
Introduction to GIS software
 Introduction to GIS software There are a wide variety of GIS software packages available. Some of these software packages are freely available for you to download and could be used in your classroom. ArcGIS
MICROSOFT OFFICE. Courseware: Exam: Sample Only EXCEL 2016 CORE. Certification Guide
 MICROSOFT OFFICE Courseware: 3263 2 Exam: 77 727 EXCEL 2016 CORE Certification Guide Microsoft Office Specialist 2016 Series Microsoft Excel 2016 Core Certification Guide Lesson 1: Introducing Excel Lesson
Formatting, Saving and Printing in Word 2013
 Revision 3 (--04) Computer Basics Formatting, Saving and Printing in Word 03 MICROSOFT WORD 03: This program allows you to create new documents, make easy changes, insert media, and effectively save and
Introduction to Microsoft Excel
 Chapter A spreadsheet is a computer program that turns the computer into a very powerful calculator. Headings and comments can be entered along with detailed formulas. The spreadsheet screen is divided
Designed by Jason Wagner, Course Web Programmer, Office of e-learning NOTE ABOUT CELL REFERENCES IN THIS DOCUMENT... 1
 Excel Essentials Designed by Jason Wagner, Course Web Programmer, Office of e-learning NOTE ABOUT CELL REFERENCES IN THIS DOCUMENT... 1 FREQUENTLY USED KEYBOARD SHORTCUTS... 1 FORMATTING CELLS WITH PRESET
Chapter 1 : Getting Started with Integrity... Chapter 2 : Interface Layout... Chapter 3 : Navigation... Chapter 4 : Printing...
 .0 User s Manual Table of Contents Chapter : Getting Started with Integrity... Chapter : Interface Layout... Chapter : Navigation... Chapter : Printing... Chapter : Quick Search and Results Pane... Results
Community Health Maps Lab Series
 Community Health Maps Lab Series Lab 6 Data Visualization with Carto Objective Understand how to upload and style data with Carto to create an online visualization of your data Document Version: 2017-08-28(Final)
Ishida Label Editor USER GUIDE
 Ishida Label Editor USER GUIDE ISHIDA CO., LTD Copyright 2000 Ishida Co. Ltd., Japan Copyright 2000 Interface Translation Ltd., New Zealand No part of this manual may be reproduced or transmitted in any
Geocoding Reference USA data in ArcMap 9.3
 Tufts GIS Tip Sheet Geocoding Reference USA data in ArcMap 9.3 Written by Barbara Parmenter Revised 3/1/2011 In this exercise, you will map businesses or services for a town in the Boston metropolitan
Instructions for Using the Databases
 Appendix D Instructions for Using the Databases Two sets of databases have been created for you if you choose to use the Documenting Our Work forms. One set is in Access and one set is in Excel. They are
GIS LAB 1. Basic GIS Operations with ArcGIS. Calculating Stream Lengths and Watershed Areas.
 GIS LAB 1 Basic GIS Operations with ArcGIS. Calculating Stream Lengths and Watershed Areas. ArcGIS offers some advantages for novice users. The graphical user interface is similar to many Windows packages
Using GIS to Site Minimal Excavation Helicopter Landings
 Using GIS to Site Minimal Excavation Helicopter Landings The objective of this analysis is to develop a suitability map for aid in locating helicopter landings in mountainous terrain. The tutorial uses
Heads-up Digitizing from Scanned Hard-Copy Maps Part II - Vector Point, Segment and Polygon Editing 1
 Data conversion/entry (GIS, databases) February 18-25, 2007 Freetown, Sierra Leone Heads-up Digitizing from Scanned Hard-Copy Maps Part II - Vector Point, Segment and Polygon Editing 1 Objectives: Create
Instructions on Adding Zeros to the Comtrade Data
 Instructions on Adding Zeros to the Comtrade Data Required: An excel spreadshheet with the commodity codes for all products you want included. In this exercise we will want all 4-digit SITC Revision 2
Survey of Math: Excel Spreadsheet Guide (for Excel 2016) Page 1 of 9
 Page 1 of 9") Survey of Math: Excel Spreadsheet Guide (for Excel 2016) Page 1 of 9 Contents 1 Introduction to Using Excel Spreadsheets 2 1.1 A Serious Note About Data Security.................................... 2 1.2
Survey of Math: Excel Spreadsheet Guide (for Excel 2016) Page 1 of 9 Contents 1 Introduction to Using Excel Spreadsheets 2 1.1 A Serious Note About Data Security.................................... 2 1.2
Introduction to Microsoft Publisher
 Introduction to Microsoft Publisher Day One Agenda: Introduction Templates Layout Inserting and Formatting Text Inserting and Formatting Pictures Practice, Questions Day Two Agenda: Review Day One Tables
Exercise 1: An Overview of ArcMap and ArcCatalog
 Exercise 1: An Overview of ArcMap and ArcCatalog Introduction: ArcGIS is an integrated collection of GIS software products for building a complete GIS. ArcGIS enables users to deploy GIS functionality
IMAGE STUDIO LITE. Tutorial Guide Featuring Image Studio Analysis Software Version 3.1
 IMAGE STUDIO LITE Tutorial Guide Featuring Image Studio Analysis Software Version 3.1 Notice The information contained in this document is subject to change without notice. LI-COR MAKES NO WARRANTY OF
Introduction to GIS A Journey Through Gale Crater
 Introduction to GIS A Journey Through Gale Crater In this lab you will be learning how to use ArcMap, one of the most common commercial software packages for GIS (Geographic Information System). Throughout
Exercise 4: Import Tabular GPS Data and Digitizing
 Exercise 4: Import Tabular GPS Data and Digitizing You can create NEW GIS data layers by digitizing on screen with an aerial photograph or other image as a back-drop. You can also digitize using imported
Microsoft Excel 2010 Basic
 Microsoft Excel 2010 Basic Introduction to MS Excel 2010 Microsoft Excel 2010 is a spreadsheet software in the new Microsoft 2010 Office Suite. Excel allows you to store, manipulate and analyze data in
GIS Tools for Hydrology and Hydraulics
 1 OUTLINE GIS Tools for Hydrology and Hydraulics INTRODUCTION Good afternoon! Welcome and thanks for coming. I once heard GIS described as a high-end Swiss Army knife: lots of tools in one little package
This book is about using Microsoft Excel to
 Introducing Data Analysis with Excel This book is about using Microsoft Excel to analyze your data. Microsoft Excel is an electronic worksheet you can use to perform mathematical, financial, and statistical
Basic tasks in Excel 2013
 Basic tasks in Excel 2013 Excel is an incredibly powerful tool for getting meaning out of vast amounts of data. But it also works really well for simple calculations and tracking almost any kind of information.
How to Create a Tile Package
 United States Department of Agriculture Digital Mobile Sketch Mapping (DMSM) How to Create a Tile Package (TPK) Forest Service Introduction A tile package (.tpk) allows you to use a set of packaged tiles
BusinessObjects Frequently Asked Questions
 BusinessObjects Frequently Asked Questions Contents Is there a quick way of printing together several reports from the same document?... 2 Is there a way of controlling the text wrap of a cell?... 2 How
Objective 1: Familiarize yourself with basic database terms and definitions. Objective 2: Familiarize yourself with the Access environment.
 Beginning Access 2007 Objective 1: Familiarize yourself with basic database terms and definitions. What is a Database? A Database is simply defined as a collection of related groups of information. Things
Lab 7 Macros, Modules, Data Access Pages and Internet Summary Macros: How to Create and Run Modules vs. Macros 1. Jumping to Internet
 Lab 7 Macros, Modules, Data Access Pages and Internet Summary Macros: How to Create and Run Modules vs. Macros 1. Jumping to Internet 1. Macros 1.1 What is a macro? A macro is a set of one or more actions
Microsoft Access 2010
 Microsoft Access 2010 Chapter 2 Querying a Database Objectives Create queries using Design view Include fields in the design grid Use text and numeric data in criteria Save a query and use the saved query