3.1 Generating Inverses of Functions 263
|
|
|
- Gwendoline Carpenter
- 6 years ago
- Views:
Transcription


1 3.1 Generating Inverses of Functions FOCUSING QUESTION What is the inverse of a function? LEARNING OUTCOMES I can compare and contrast the key attributes of a function and its inverse when I have the function as a table, graph, or written symbolically. I can represent the domain and range of a linear function in a variety of ways, including interval notation, inequalities, and set builder notation. I can use and select tools, including graphing technology, paper and pencil, and manipulatives like patty paper, to solve problems. ENGAGE Dylan, a computer animator, needs to reflect the figure shown as a part of an animation process. What would be the coordinates of each vertex in the new figure if Dylan reflected the original figure across the y-axis? The x-axis? Provincetown Library Provincetown, Massachusetts EXPLORE The distance required to stop a moving vehicle is a function of the speed of the vehicle. According to the Texas Driver Handbook, the distance required to stop a vehicle moving at a given speed, on dry pavement with good tires, is shown in the table on page Generating Inverses of Functions 263
2 SPEED (MILES PER HOUR) BRAKING DISTANCE (FEET) Source: Texas Department of Public Safety 1. Use finite differences or successive ratios to determine if the data set represents a linear, quadratic, cubic, or exponential function. 2. Make a scatterplot of the braking distance versus speed. 3. Suppose that you knew from a skid mark the length of the braking distance and wanted to know the speed of the moving vehicle. In this situation, what would be the independent variable and what would be the dependent variable? When describing a scatterplot, you can say the scatterplot is the name of the dependent variable versus the name of the independent variable. For example, if you are graphing data where speed is the independent variable and distance is the dependent variable, you can say that you have a scatterplot of distance versus speed. 4. On the same grid, make a scatterplot of speed versus braking distance. What do you notice about the two scatterplots? 5. Draw the line y = x on your graph. Lay a sheet of patty paper on top of the graph. Trace and label the x-axis, y-axis, the line y = x, and the points in the first scatter plot, braking distance versus speed. 6. Use the patty paper to reflect the first scatterplot across the line y = x. (Hint: Hold the patty paper along the top-right corner of the line y = x with your right index finger and thumb. Hold the patty paper along the bottom-left corner of the line y = x with your left index finger and thumb. Flip the patty paper over without moving your fingers and thumbs. Line up the axes on the patty paper with the axes on the graph beneath.) What do you notice? The inverse of a function is a relation in which the domain and range of the original function are switched. The domain of the original function becomes the range of the inverse and the range of the original function becomes the domain of the inverse. The scatterplot of speed versus braking distance is the inverse of the scatterplot of braking distance versus speed. 7. How are the inverse scatterplot and the original scatterplot related? 264 CHAPTER 3: INVERSES OF FUNCTIONS
3 8. A table of values for both scatterplots is shown. Braking Distance vs. Speed SPEED, x (MILES PER HOUR) BRAKING DISTANCE, y (FEET) Speed vs. Braking Distance BRAKING DISTANCE, x (FEET) SPEED, y (MILES PER HOUR) How are the domain and range of the original scatterplot (braking distance versus speed) and the inverse scatterplot (speed versus braking distance) related? 9. Graph the function f(x) = 3x 4. Use a graph and a table of values to represent the inverse of f(x). How do the slope and intercepts of the function compare with the slope and intercepts of the inverse? 10. Graph the function g(x) = (x + 4) Use a graph and a table of values to represent the inverse of g(x). How does the vertex of g(x) compare to the vertex of its inverse? REFLECT How can you use a graph to generate the inverse of a function? How can you use a table to generate the inverse of a function? How are the domain and range of a function related to the domain and range of its inverse? Is the inverse of a function always a new function? Explain your answer. 3.1 Generating Inverses of Functions 265
4 EXPLAIN A function is a relationship between an independent variable and a dependent variable. The values of the independent variable are called the domain of the function and the values of the dependent variable are called the range of the function. But what happens if the relationship is reversed and the range values become the input while the domain values become the output? That situation is called an inverse relation. The range of the original function becomes the domain of the inverse relation, and the domain of the original function becomes the range of the inverse relation. You can generate inverses of functions using tables, graphs, or equations. domain range function inverse range domain INVERSES IN TABLES Fahrenheit and Celsius are two different units that are used to measure temperature. The tables below show some ordered pairs that represent equivalent temperatures in each scale. The left-hand table assumes that you know the temperature in degrees Celsius (i.e., Celsius temperature is the independent variable) and you want to determine the temperature in degrees Fahrenheit (i.e., Fahrenheit temperature is the dependent variable). The right-hand table assumes that you know the temperature in degrees Fahrenheit (i.e., Fahrenheit temperature is the independent variable) and you want to determine the temperature in degrees Celsius (i.e., Celsius temperature is the dependent variable). Watch Explain and You Try It Videos or click here Celsius to Fahrenheit, F(x) IN CELSIUS IN FAHRENHEIT Fahrenheit to Celsius, C(x) IN FAHRENHEIT IN CELSIUS domain range domain range 266 CHAPTER 3: INVERSES OF FUNCTIONS
5 Celsius to Fahrenheit, F(x) IN CELSIUS IN FAHRENHEIT Fahrenheit to Celsius, C(x) IN FAHRENHEIT IN CELSIUS domain range domain range The domain of F(x), the Celsius to Fahrenheit conversion function, becomes the range of C(x), the Fahrenheit to Celsius conversion. The range of F(x), the Celsius to Fahrenheit conversion function, becomes the domain of C(x), the Fahrenheit to Celsius conversion. Thus, C(x) is the inverse of F(x). Also notice that the y-intercept of F(x), (0, 32), becomes the x-intercept of C(x), (32, 0), since the x-values and y-values switch. Likewise, the x-intercept of F(x), ( , 0), becomes the y-intercept of C(x), (0, ). INVERSES IN GRAPHS In a graph, an inverse of a function appears as a reflection of the graph of the original function across the line y = x. This reflection transforms the ordered pairs, (x, y) of the original function into the ordered pairs (y, x) for the inverse function. The x- and y-coordinates of the original function are switched to generate the inverse. The Fahrenheit-Celsius conversion formulas, where F represents the temperature in degrees Fahrenheit and C represents the temperature in degrees Celsius are shown. F = 9 5 C + 32 C = 5 9 (F 32) For each function, let the independent variable be x. Then, F(x) will give you the temperature in degrees Fahrenheit if you know the temperature in Celsius, x. Likewise, C(x) will give you the temperature in degrees Celsius if you know the temperature in degrees Fahrenheit, x. 3.1 Generating Inverses of Functions 267

, represents the equivalent temperatures 50 F and 10 C. This point also lies 28.28 units from the line y = x.")
6 Notice that each line is a reflection of the other across the line y = x. Graphically, reflections have the property that each point on the graph of the function is the same distance from the line of reflection as its image, or reflection, on the graph of the inverse. For example, (10, 50) represents the equivalent temperatures 10 C and 50 F. This point lies units from the line y = x, which is the line of reflection. Its image, (50, 10), represents the equivalent temperatures 50 F and 10 C. This point also lies units from the line y = x. Thus, the points are equidistant, or the same distance, from the line of reflection. Also notice the relationships between the intercepts. The y-intercept of F(x) becomes the x-intercept of C(x). In other words, the point (0, 32) on the graph of the original function becomes the point (32, 0) on the graph of the inverse because the x- and y-coordinates for the inverse are switched from the original function. The x-intercept of F(x) becomes the y-intercept of C(x). In other words, the point ( , 0) on the graph of the original function becomes the point (0, ) on the graph of the inverse because the x- and y-coordinates for the inverse are switched from the original function. INVERSES IN EQUATIONS The Fahrenheit-Celsius conversion formulas, where F represents the temperature in degrees Fahrenheit and C represents the temperature in degrees Celsius are shown. F = 9 5 C + 32 C = 5 9 (F 32) You can determine the inverse of a function from its equation. Because the domain and range of the original function are switched to generate the inverse, switch the variables that represent the independent and dependent variables in the equation and solve for the dependent variable. Begin with the Celsius to Fahrenheit conversion formula written as a function, F(x) = 9 5 x x represents the independent variable and F(x) represents the dependent variable, which can also be rewritten as y. For its inverse, switch x and y and then solve for y. 268 CHAPTER 3: INVERSES OF FUNCTIONS
7 y = 9 5 x + 32 x = 9 5 y + 32 x 32 = 9 5 y x 32 = 9 5 y 5 9 (x 32) = 5 9 ( 9 5 )y 5 9 (x 32) = y In this inverse equation, y represents C(x), which is the temperature in degrees Celsius, and x represents the temperature in degrees Fahrenheit. This equation, which is a linear function, is equivalent to the Fahrenheit to Celsius temperature conversion formula. KEY ATTRIBUTES OF INVERSES OF FUNCTIONS The inverse of a function may or may not be a function itself. However, it does have several important key attributes: The domain of the original function is the range of the inverse. The range of the original function is the domain of the inverse. If the inverse of f(x) is a function, it can be written with the notation f 1 (x), which is read, f inverse of x. The x-intercept(s) of the original function is/are the y-intercept(s) of the inverse. The y-intercept of the original function is the x-intercept of the inverse. The maximum or minimum function value (y-value) of the original function (e.g., vertex of a quadratic function) is the maximum or minimum x-value of the inverse. EXAMPLE 1 Generate the inverse of the exponential function represented in the table that follows. Is the inverse a function? Justify your answer. 3.1 Generating Inverses of Functions 269
8 x 2 1 y STEP 1 Determine the inverse by switching the domain and range values of the original function. x y STEP 2 Evaluate the domain and range of the inverse to determine whether or not the inverse is a function. Each domain value in the inverse s table results in a single range value in the inverse s table. The relationship between the original exponential function s domain and range is related to the relationship of the domain and range of the inverse. Therefore, it is reasonable to conclude that the inverse is also a function. YOU TRY IT! #1 Generate the inverse of the absolute value function represented in the table to the right. If the inverse is a function, write the equation of the inverse function. If the inverse is not a function, explain why not. x y CHAPTER 3: INVERSES OF FUNCTIONS

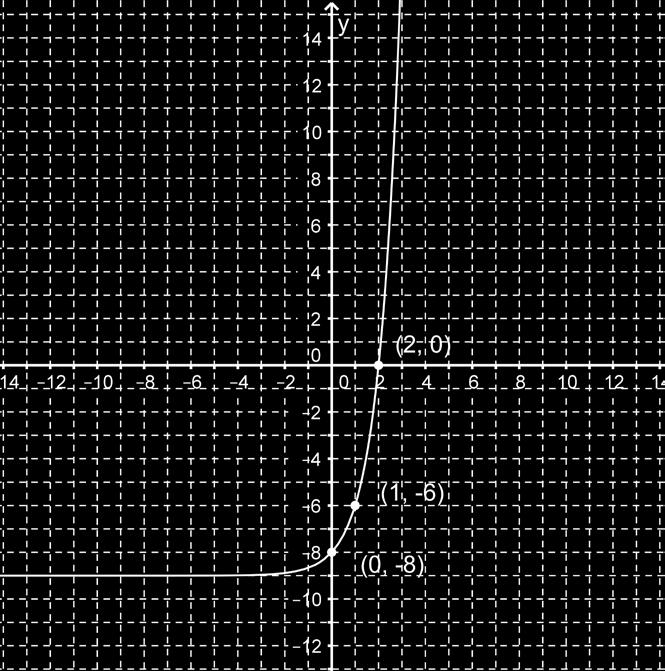
9 EXAMPLE 2 Generate the graph of the inverse of the cubic function f(x) = (x + 2) whose graph is shown below. STEP 1 Determine several points on the original graph that represent the general shape of the curve as well as key attributes of the function, such as intercepts. STEP 2 Switch the x- and y-values of each of the chosen points from the original graph and graph them on the coordinate plane. Then draw the curve of the inverse through the points you graphed on the coordinate plane. STEP 3 Verify visually that the graphs are reflections of one another across the line y = x and that the graphed points are the same distance from the line y = x. Notice that the y-intercept of the original function is the x-intercept of the inverse and the x-intercept(s) of the original function are the y-intercept(s) of the inverse. 3.1 Generating Inverses of Functions 271
, the inverse of the quadratic function h(x) = 3(2x + 1) 2 7. STEP 1 Rewrite the function using x as the independent variable and y as the dependent variable.")
10 The graph of the inverse of f 1 (x) is shown. YOU TRY IT! #2 Generate the graph of the inverse of the rational function g(x) = 3 x whose graph is shown below. EXAMPLE 3 Generate the equation of h 1 (x), the inverse of the quadratic function h(x) = 3(2x + 1) 2 7. STEP 1 Rewrite the function using x as the independent variable and y as the dependent variable. y = 3(2x + 1) 2 7 STEP 2 Reverse the variables x and y in the equation and solve the equation for y. 272 CHAPTER 3: INVERSES OF FUNCTIONS
11 x = 3(2y + 1) 2 7 x + 7 = 3(2y + 1) x + 7 = 3(2y + 1) ± x + 7 = (2y + 1) ± x = 2y ± x = 2y ± x = y STEP 3 Rewrite the inverse as an equation. inverse of h(x) is y = 1 ± x YOU TRY IT! #3 Generate the equation of p 1 (x), the inverse of the linear function p(x) = 2 5 (x 3) + 4. PRACTICE/HOMEWORK Use Table 1 to answer questions 1 and 2. x y TABLE 1 1. Generate the inverse of the linear function. 2. Determine if the inverse is a function. Explain your answer. 3.1 Generating Inverses of Functions 273

12 Use Table 2 to answer questions 3 and 4. x y Generate the inverse of the quadratic function. 4. Determine if the inverse is a function. Explain your answer. TABLE 2 Use Table 3 to answer questions 5 and 6. x y Generate the inverse of the cubic function. 6. Determine if the inverse is a function. Explain your answer. TABLE 3 Use Table 4 to answer questions 7 and 8. x y Generate the inverse of the exponential function. 8. Determine if the inverse is a function. Explain your answer. TABLE 4 Use the equation and graph below to answer questions 9 and 10. f(x) = 4x 2 9. Generate the graph of the inverse of the linear function. 10. Determine the x-intercept(s) and y-intercept(s) of the original function and the x-intercept(s) and y-intercept(s) of the inverse of the function. 274 CHAPTER 3: INVERSES OF FUNCTIONS

 and y-intercept(s) of the inverse of the function.")


 = 2(3x + 1) 2 18. f(x) = 1 4 (8x + 2) 20. f(x) = 1 2 (2x + 5) 2 3.")
13 Use the equation and graph below to answer questions 11 and 12. f(x) = 2x Generate the graph of the inverse of the quadratic function. 12. Determine the x-intercept(s) and y-intercept(s) of the original function and the x-intercept(s) and y-intercept(s) of the inverse of the function. Use the equation and graph below to answer questions 13 and 14. f(x) = 1 2 (x + 3) Generate the graph of the inverse of the cubic function. 14. Determine the x-intercept(s) and y-intercept(s) of the original function and the x-intercept(s) and y-intercept(s) of the inverse of the function. Use the equation and graph below to answer questions 15 and 16. f(x) = 3 x Generate the graph of the inverse of the exponential function. 16. Determine the x-intercept(s) and y-intercept(s) of the original function and the x-intercept(s) and y-intercept(s) of the inverse of the function. For questions 17 20, generate f 1 (x), the equation of the inverse of the function given. 17. f(x) = 3x f(x) = 2(3x + 1) f(x) = 1 4 (8x + 2) 20. f(x) = 1 2 (2x + 5) Generating Inverses of Functions 275
Section 18-1: Graphical Representation of Linear Equations and Functions
 Section 18-1: Graphical Representation of Linear Equations and Functions Prepare a table of solutions and locate the solutions on a coordinate system: f(x) = 2x 5 Learning Outcome 2 Write x + 3 = 5 as
UNIT 3 EXPRESSIONS AND EQUATIONS Lesson 3: Creating Quadratic Equations in Two or More Variables
 Guided Practice Example 1 Find the y-intercept and vertex of the function f(x) = 2x 2 + x + 3. Determine whether the vertex is a minimum or maximum point on the graph. 1. Determine the y-intercept. The
Final Exam Review Algebra Semester 1
 Final Exam Review Algebra 015-016 Semester 1 Name: Module 1 Find the inverse of each function. 1. f x 10 4x. g x 15x 10 Use compositions to check if the two functions are inverses. 3. s x 7 x and t(x)
Quadratic Functions CHAPTER. 1.1 Lots and Projectiles Introduction to Quadratic Functions p. 31
 CHAPTER Quadratic Functions Arches are used to support the weight of walls and ceilings in buildings. Arches were first used in architecture by the Mesopotamians over 4000 years ago. Later, the Romans
9.1 Linear Inequalities in Two Variables Date: 2. Decide whether to use a solid line or dotted line:
 9.1 Linear Inequalities in Two Variables Date: Key Ideas: Example Solve the inequality by graphing 3y 2x 6. steps 1. Rearrange the inequality so it s in mx ± b form. Don t forget to flip the inequality
Test 3 review SHORT ANSWER. Write the word or phrase that best completes each statement or answers the question.
 Test 3 review SHORT ANSWER. Write the word or phrase that best completes each statement or answers the question. Approximate the coordinates of each turning point by graphing f(x) in the standard viewing
Math 370 Exam 1 Review Name. Use the vertical line test to determine whether or not the graph is a graph in which y is a function of x.
 Math 370 Exam 1 Review Name Determine whether the relation is a function. 1) {(-6, 6), (-6, -6), (1, 3), (3, -8), (8, -6)} Not a function The x-value -6 corresponds to two different y-values, so this relation
Unit #3: Quadratic Functions Lesson #13: The Almighty Parabola. Day #1
 Algebra I Unit #3: Quadratic Functions Lesson #13: The Almighty Parabola Name Period Date Day #1 There are some important features about the graphs of quadratic functions we are going to explore over the
Part I. Problems in this section are mostly short answer and multiple choice. Little partial credit will be given. 5 points each.
 Math 106/108 Final Exam Page 1 Part I. Problems in this section are mostly short answer and multiple choice. Little partial credit will be given. 5 points each. 1. Factor completely. Do not solve. a) 2x
Properties of Quadratic functions
 Name Today s Learning Goals: #1 How do we determine the axis of symmetry and vertex of a quadratic function? Properties of Quadratic functions Date 5-1 Properties of a Quadratic Function A quadratic equation
Unit 12 Special Functions
 Algebra Notes Special Functions Unit 1 Unit 1 Special Functions PREREQUISITE SKILLS: students should be able to describe a relation and a function students should be able to identify the domain and range
Other Functions and their Inverses
 CHAPTER Other Functions and their Inverses Water tanks have been used throughout human history to store water for consumption. Many municipal water tanks are placed on top of towers so that water drawn
1.1 Pearson Modeling and Equation Solving
 Date:. Pearson Modeling and Equation Solving Syllabus Objective:. The student will solve problems using the algebra of functions. Modeling a Function: Numerical (data table) Algebraic (equation) Graphical
Algebra II Notes Unit Two: Linear Equations and Functions
 Syllabus Objectives:.1 The student will differentiate between a relation and a function.. The student will identify the domain and range of a relation or function.. The student will derive a function rule
Voluntary State Curriculum Algebra II
 Algebra II Goal 1: Integration into Broader Knowledge The student will develop, analyze, communicate, and apply models to real-world situations using the language of mathematics and appropriate technology.
MATHEMATICS Grade 7 Advanced Standard: Number, Number Sense and Operations
 Standard: Number, Number Sense and Operations Number and Number Systems A. Use scientific notation to express large numbers and numbers less than one. 1. Use scientific notation to express large numbers
9.1: GRAPHING QUADRATICS ALGEBRA 1
 9.1: GRAPHING QUADRATICS ALGEBRA 1 OBJECTIVES I will be able to graph quadratics: Given in Standard Form Given in Vertex Form Given in Intercept Form What does the graph of a quadratic look like? https://www.desmos.com/calculator
Unit 2: Function Transformation Chapter 1. Basic Transformations Reflections Inverses
 Unit 2: Function Transformation Chapter 1 Basic Transformations Reflections Inverses Section 1.1: Horizontal and Vertical Transformations A transformation of a function alters the equation and any combination
Sec 4.1 Coordinates and Scatter Plots. Coordinate Plane: Formed by two real number lines that intersect at a right angle.
 Algebra I Chapter 4 Notes Name Sec 4.1 Coordinates and Scatter Plots Coordinate Plane: Formed by two real number lines that intersect at a right angle. X-axis: The horizontal axis Y-axis: The vertical
Warm - Up. Sunday, February 1, HINT: plot points first then connect the dots. Draw a graph with the following characteristics:
 Warm - Up Sunday, February 1, 2015 Draw a graph with the following characteristics: Maximums at (-3,4) and (2,2) Minimum at (-1,-3) X intercepts at (-4,0), (-2,0), (1,0), and (3,0) Y intercept at (0,-2)
Integrated Mathematics I Performance Level Descriptors
 Limited A student performing at the Limited Level demonstrates a minimal command of Ohio s Learning Standards for Integrated Mathematics I. A student at this level has an emerging ability to demonstrate
Chapter 1. Linear Equations and Straight Lines. 2 of 71. Copyright 2014, 2010, 2007 Pearson Education, Inc.
 Chapter 1 Linear Equations and Straight Lines 2 of 71 Outline 1.1 Coordinate Systems and Graphs 1.4 The Slope of a Straight Line 1.3 The Intersection Point of a Pair of Lines 1.2 Linear Inequalities 1.5
Name: Chapter 7 Review: Graphing Quadratic Functions
 Name: Chapter Review: Graphing Quadratic Functions A. Intro to Graphs of Quadratic Equations: = ax + bx+ c A is a function that can be written in the form = ax + bx+ c where a, b, and c are real numbers
PR3 & PR4 CBR Activities Using EasyData for CBL/CBR Apps
 Summer 2006 I2T2 Process Page 23. PR3 & PR4 CBR Activities Using EasyData for CBL/CBR Apps The TI Exploration Series for CBR or CBL/CBR books, are all written for the old CBL/CBR Application. Now we can
A function: A mathematical relationship between two variables (x and y), where every input value (usually x) has one output value (usually y)
, where every input value (usually x) has one output value (usually y)") SESSION 9: FUNCTIONS KEY CONCEPTS: Definitions & Terminology Graphs of Functions - Straight line - Parabola - Hyperbola - Exponential Sketching graphs Finding Equations Combinations of graphs TERMINOLOGY
SESSION 9: FUNCTIONS KEY CONCEPTS: Definitions & Terminology Graphs of Functions - Straight line - Parabola - Hyperbola - Exponential Sketching graphs Finding Equations Combinations of graphs TERMINOLOGY
Math Analysis Chapter 1 Notes: Functions and Graphs
 Math Analysis Chapter 1 Notes: Functions and Graphs Day 6: Section 1-1 Graphs Points and Ordered Pairs The Rectangular Coordinate System (aka: The Cartesian coordinate system) Practice: Label each on the
Lesson 19: The Graph of a Linear Equation in Two Variables is a Line
 Lesson 19: The Graph of a Linear Equation in Two Variables is a Line Classwork Exercises Theorem: The graph of a linear equation y = mx + b is a non-vertical line with slope m and passing through (0, b),
3. parallel: (b) and (c); perpendicular (a) and (b), (a) and (c)
 and (c); perpendicular (a) and (b), (a) and (c)") SECTION 1.1 1. Plot the points (0, 4), ( 2, 3), (1.5, 1), and ( 3, 0.5) in the Cartesian plane. 2. Simplify the expression 13 7 2. 3. Use the 3 lines whose equations are given. Which are parallel? Which
SECTION 1.1 1. Plot the points (0, 4), ( 2, 3), (1.5, 1), and ( 3, 0.5) in the Cartesian plane. 2. Simplify the expression 13 7 2. 3. Use the 3 lines whose equations are given. Which are parallel? Which
2. Solve for x when x < 22. Write your answer in interval notation. 3. Find the distance between the points ( 1, 5) and (4, 3).
 and (4, 3).") Math 6 Practice Problems for Final. Find all real solutions x such that 7 3 x = 5 x 3.. Solve for x when 0 4 3x
Math 6 Practice Problems for Final. Find all real solutions x such that 7 3 x = 5 x 3.. Solve for x when 0 4 3x
MAC Rev.S Learning Objectives. Learning Objectives (Cont.) Module 4 Quadratic Functions and Equations
 Module 4 Quadratic Functions and Equations") MAC 1140 Module 4 Quadratic Functions and Equations Learning Objectives Upon completing this module, you should be able to 1. understand basic concepts about quadratic functions and their graphs.. complete
MAC 1140 Module 4 Quadratic Functions and Equations Learning Objectives Upon completing this module, you should be able to 1. understand basic concepts about quadratic functions and their graphs.. complete
QUESTIONS 1 10 MAY BE DONE WITH A CALCULATOR QUESTIONS ARE TO BE DONE WITHOUT A CALCULATOR. Name
 QUESTIONS 1 10 MAY BE DONE WITH A CALCULATOR QUESTIONS 11 5 ARE TO BE DONE WITHOUT A CALCULATOR Name 2 CALCULATOR MAY BE USED FOR 1-10 ONLY Use the table to find the following. x -2 2 5-0 7 2 y 12 15 18
DIOCESE OF HARRISBURG MATHEMATICS CURRICULUM GRADE 8
 MATHEMATICS CURRICULUM GRADE 8 8A Numbers and Operations 1. Demonstrate an numbers, ways of representing numbers, relationships among numbers and number systems. 2. Compute accurately and fluently. a.
Math Analysis Chapter 1 Notes: Functions and Graphs
 Math Analysis Chapter 1 Notes: Functions and Graphs Day 6: Section 1-1 Graphs; Section 1- Basics of Functions and Their Graphs Points and Ordered Pairs The Rectangular Coordinate System (aka: The Cartesian
Polynomial and Rational Functions. Copyright Cengage Learning. All rights reserved.
 2 Polynomial and Rational Functions Copyright Cengage Learning. All rights reserved. 2.1 Quadratic Functions Copyright Cengage Learning. All rights reserved. What You Should Learn Analyze graphs of quadratic
Practice Test - Chapter 1
 Determine whether the given relation represents y as a function of x. 1. y 3 x = 5 When x = 1, y = ±. Therefore, the relation is not one-to-one and not a function. not a function 4. PARKING The cost of
Algebra I. Slide 1 / 137. Slide 2 / 137. Slide 3 / 137. Quadratic & Non-Linear Functions. Table of Contents
 Slide 1 / 137 Slide 2 / 137 Algebra I Quadratic & Non-Linear Functions 2015-11-04 www.njctl.org Table of Contents Slide 3 / 137 Click on the topic to go to that section Key Terms Explain Characteristics
The x-intercept can be found by setting y = 0 and solving for x: 16 3, 0
 y=-3/4x+4 and y=2 x I need to graph the functions so I can clearly describe the graphs Specifically mention any key points on the graphs, including intercepts, vertex, or start/end points. What is the
Common Core Algebra 2. Chapter 1: Linear Functions
 Common Core Algebra 2 Chapter 1: Linear Functions 1 1.1 Parent Functions and Transformations Essential Question: What are the characteristics of some of the basic parent functions? What You Will Learn
Middle School Math Course 3
 Middle School Math Course 3 Correlation of the ALEKS course Middle School Math Course 3 to the Texas Essential Knowledge and Skills (TEKS) for Mathematics Grade 8 (2012) (1) Mathematical process standards.
Module 3: Graphing Quadratic Functions
 Haberman MTH 95 Section V Quadratic Equations and Functions Module 3 Graphing Quadratic Functions In this module, we'll review the graphing quadratic functions (you should have studied the graphs of quadratic
Section 3.3. Analyzing Graphs of Quadratic Functions
 Section 3.3 Analyzing Graphs of Quadratic Functions Introduction Definitions A quadratic function is a function with the form f (x) = ax 2 + bx + c, where a 0. Definitions A quadratic function is a function
September 18, B Math Test Chapter 1 Name: x can be expressed as: {y y 0, y R}.
 September 8, 208 62B Math Test Chapter Name: Part : Objective Questions [ mark each, total 2 marks]. State whether each of the following statements is TRUE or FALSE a) The mapping rule (x, y) (-x, y) represents
Warm-Up Exercises. Find the x-intercept and y-intercept 1. 3x 5y = 15 ANSWER 5; y = 2x + 7 ANSWER ; 7
 Warm-Up Exercises Find the x-intercept and y-intercept 1. 3x 5y = 15 ANSWER 5; 3 2. y = 2x + 7 7 2 ANSWER ; 7 Chapter 1.1 Graph Quadratic Functions in Standard Form A quadratic function is a function that
GSE Algebra 1 Name Date Block. Unit 3b Remediation Ticket
 Unit 3b Remediation Ticket Question: Which function increases faster, f(x) or g(x)? f(x) = 5x + 8; two points from g(x): (-2, 4) and (3, 10) Answer: In order to compare the rate of change (roc), you must
3.1 INTRODUCTION TO THE FAMILY OF QUADRATIC FUNCTIONS
 3.1 INTRODUCTION TO THE FAMILY OF QUADRATIC FUNCTIONS Finding the Zeros of a Quadratic Function Examples 1 and and more Find the zeros of f(x) = x x 6. Solution by Factoring f(x) = x x 6 = (x 3)(x + )
3, 10,( 2, 4) Name. CP Algebra II Midterm Review Packet Unit 1: Linear Equations and Inequalities. Solve each equation. 3.
 Name. CP Algebra II Midterm Review Packet Unit 1: Linear Equations and Inequalities. Solve each equation. 3.") Name CP Algebra II Midterm Review Packet 018-019 Unit 1: Linear Equations and Inequalities Solve each equation. 1. x. x 4( x 5) 6x. 8x 5(x 1) 5 4. ( k ) k 4 5. x 4 x 6 6. V lhw for h 7. x y b for x z Find
Name CP Algebra II Midterm Review Packet 018-019 Unit 1: Linear Equations and Inequalities Solve each equation. 1. x. x 4( x 5) 6x. 8x 5(x 1) 5 4. ( k ) k 4 5. x 4 x 6 6. V lhw for h 7. x y b for x z Find
A-SSE.1.1, A-SSE.1.2-
 Putnam County Schools Curriculum Map Algebra 1 2016-2017 Module: 4 Quadratic and Exponential Functions Instructional Window: January 9-February 17 Assessment Window: February 20 March 3 MAFS Standards
Foundations of Math II
 Foundations of Math II Unit 6b: Toolkit Functions Academics High School Mathematics 6.6 Warm Up: Review Graphing Linear, Exponential, and Quadratic Functions 2 6.6 Lesson Handout: Linear, Exponential,
Unit 2: Linear Functions
 Unit 2: Linear Functions 2.1 Functions in General Functions Algebra is the discipline of mathematics that deals with functions. DEF. A function is, essentially, a pattern. This course deals with patterns
Part I. Fill in the blank. 2 points each. No calculators. No partial credit
 Math 108 (105) Final Exam Page 1 Spring 2015 Part I. Fill in the blank. 2 points each. No calculators. No partial credit 1) Fill in the blank a) 2 8 h) 5 0 21 4 b) 5 7 i) 8 3 c) 2 3 = j) 2 7 d) The additive
Unit 2: Functions and Graphs
 AMHS Precalculus - Unit 16 Unit : Functions and Graphs Functions A function is a rule that assigns each element in the domain to exactly one element in the range. The domain is the set of all possible
2.1 Solutions to Exercises
 Last edited 9/6/17.1 Solutions to Exercises 1. P(t) = 1700t + 45,000. D(t) = t + 10 5. Timmy will have the amount A(n) given by the linear equation A(n) = 40 n. 7. From the equation, we see that the slope
Exam 2 Review. 2. What the difference is between an equation and an expression?
 Exam 2 Review Chapter 1 Section1 Do You Know: 1. What does it mean to solve an equation? 2. What the difference is between an equation and an expression? 3. How to tell if an equation is linear? 4. How
1 of 49 11/30/2017, 2:17 PM
 1 of 49 11/30/017, :17 PM Student: Date: Instructor: Alfredo Alvarez Course: Math 134 Assignment: math134homework115 1. The given table gives y as a function of x, with y = f(x). Use the table given to
Unit 6 Part I. Quadratic Functions 2/9/2017 2/23/2017
 Unit 6 Part I Quadratic Functions 2/9/2017 2/23/2017 By DeviantArt user MagicFiretrucks Name: By the end of this unit, you will be able to Analyze the characteristics of graphs of quadratic functions Graph
UNIT 3B CREATING AND GRAPHING EQUATIONS Lesson 4: Solving Systems of Equations Instruction
 Prerequisite Skills This lesson requires the use of the following skills: graphing multiple equations on a graphing calculator graphing quadratic equations graphing linear equations Introduction A system
CCNY Math Review Chapter 2: Functions
 CCN Math Review Chapter : Functions Section.1: Functions.1.1: How functions are used.1.: Methods for defining functions.1.3: The graph of a function.1.: Domain and range.1.5: Relations, functions, and
Where we are. HOW do we apply the concepts of quadratics to better understand higher order polynomials?
 A. Lesson Context BIG PICTURE of this UNIT: How & why do we build NEW knowledge in Mathematics? What NEW IDEAS & NEW CONCEPTS can we now explore with specific references to POLYNOMIAL FUNCTIONS AND RATIONAL
Quadratic Functions In Standard Form In Factored Form In Vertex Form Transforming Graphs. Math Background
 Graphing In Standard Form In Factored Form In Vertex Form Transforming Graphs Math Background Previousl, ou Identified and graphed linear functions Applied transformations to parent functions Graphed quadratic
Algebra 1 Semester 2 Final Review
 Team Awesome 011 Name: Date: Period: Algebra 1 Semester Final Review 1. Given y mx b what does m represent? What does b represent?. What axis is generally used for x?. What axis is generally used for y?
You used set notation to denote elements, subsets, and complements. (Lesson 0-1)
") You used set notation to denote elements, subsets, and complements. (Lesson 0-1) Describe subsets of real numbers. Identify and evaluate functions and state their domains. set-builder notation interval
You used set notation to denote elements, subsets, and complements. (Lesson 0-1) Describe subsets of real numbers. Identify and evaluate functions and state their domains. set-builder notation interval
Planting the Seeds Exploring Cubic Functions
 295 Planting the Seeds Exploring Cubic Functions 4.1 LEARNING GOALS In this lesson, you will: Represent cubic functions using words, tables, equations, and graphs. Interpret the key characteristics of
Chapter P: Preparation for Calculus
 1. Which of the following is the correct graph of y = x x 3? E) Copyright Houghton Mifflin Company. All rights reserved. 1 . Which of the following is the correct graph of y = 3x x? E) Copyright Houghton
ALGEBRA 2 W/ TRIGONOMETRY MIDTERM REVIEW
 Name: Block: ALGEBRA W/ TRIGONOMETRY MIDTERM REVIEW Algebra 1 Review Find Slope and Rate of Change Graph Equations of Lines Write Equations of Lines Absolute Value Functions Transformations Piecewise Functions
2. The diagram shows part of the graph of y = a (x h) 2 + k. The graph has its vertex at P, and passes through the point A with coordinates (1, 0).
 2 + k. The graph has its vertex at P, and passes through the point A with coordinates (1, 0).") Quadratics Vertex Form 1. Part of the graph of the function y = d (x m) + p is given in the diagram below. The x-intercepts are (1, 0) and (5, 0). The vertex is V(m, ). (a) Write down the value of (i)
Quadratics Vertex Form 1. Part of the graph of the function y = d (x m) + p is given in the diagram below. The x-intercepts are (1, 0) and (5, 0). The vertex is V(m, ). (a) Write down the value of (i)
Math 2 Spring Unit 5 Bundle Transformational Graphing and Inverse Variation
 Math 2 Spring 2017 Unit 5 Bundle Transformational Graphing and Inverse Variation 1 Contents Transformations of Functions Day 1... 3 Transformations with Functions Day 1 HW... 10 Transformations with Functions
SHORT ANSWER. Write the word or phrase that best completes each statement or answers the question.
 Pre-Calculus Mid Term Review. January 2014 Name SHORT ANSWER. Write the word or phrase that best completes each statement or answers the question. Use the graph of the function f, plotted with a solid
Integrated Math I. IM1.1.3 Understand and use the distributive, associative, and commutative properties.
 Standard 1: Number Sense and Computation Students simplify and compare expressions. They use rational exponents and simplify square roots. IM1.1.1 Compare real number expressions. IM1.1.2 Simplify square
4.3 Quadratic functions and their properties
 4.3 Quadratic functions and their properties A quadratic function is a function defined as f(x) = ax + x + c, a 0 Domain: the set of all real numers x-intercepts: Solutions of ax + x + c = 0 y-intercept:
Section 2.2 Graphs of Linear Functions
 Section. Graphs of Linear Functions Section. Graphs of Linear Functions When we are working with a new function, it is useful to know as much as we can about the function: its graph, where the function
Archbold Area Schools Math Curriculum Map
 Math 8 August - May Mathematical Processes Formulate a problem or mathematical model in response to a specific need or situation, determine information required to solve the problem, choose method for
5.1 Introduction to the Graphs of Polynomials
 Math 3201 5.1 Introduction to the Graphs of Polynomials In Math 1201/2201, we examined three types of polynomial functions: Constant Function - horizontal line such as y = 2 Linear Function - sloped line,
Graphing Absolute Value Functions
 Graphing Absolute Value Functions To graph an absolute value equation, make an x/y table and plot the points. Graph y = x (Parent graph) x y -2 2-1 1 0 0 1 1 2 2 Do we see a pattern? Desmos activity: 1.
Visual Formula, Important Graphs, Inequalities, and Other Things
 flynt_1598632914_ch10, 4/8/6, 12:3191 chapter 10 Visual Formula, Important Graphs, Inequalities, and Other Things The activities this chapter covers allow you to use Visual Formula to work with many of
ALGEBRA 1 NOTES. Quarter 3. Name: Block
 2016-2017 ALGEBRA 1 NOTES Quarter 3 Name: Block Table of Contents Unit 8 Exponent Rules Exponent Rules for Multiplication page 4 Negative and Zero Exponents page 8 Exponent Rules Involving Quotients page
Situation #1: Translating Functions Prepared at University of Georgia William Plummer EMAT 6500 Date last revised: July 28, 2013
 Situation #1: Translating Functions Prepared at University of Georgia William Plummer EMAT 6500 Date last revised: July 28, 2013 Prompt An Algebra class is discussing the graphing of quadratic functions
More Functions, More Features ALGEBRA I. A Learning Cycle Approach MODULE 8
 ALGEBRA I A Learning Cycle Approach MODULE 8 More Functions, More Features The Scott Hendrickson, Joleigh Honey, Barbara Kuehl, Travis Lemon, Janet Sutorius 2016 All rights reserved. MORE FUNCTIONS, MORE
College Pre Calculus A Period. Weekly Review Sheet # 1 Assigned: Monday, 9/9/2013 Due: Friday, 9/13/2013
 College Pre Calculus A Name Period Weekly Review Sheet # 1 Assigned: Monday, 9/9/013 Due: Friday, 9/13/013 YOU MUST SHOW ALL WORK FOR EVERY QUESTION IN THE BOX BELOW AND THEN RECORD YOUR ANSWERS ON THE
Function Transformations and Symmetry
 CHAPTER Function Transformations and Symmetry The first well-documented postal system was in ancient Rome, where mail was carried by horsedrawn carriages and ox-drawn wagons. The US Postal Service delivers
Quickstart for Web and Tablet App
 Quickstart for Web and Tablet App What is GeoGebra? Dynamic Mathematic Software in one easy-to-use package For learning and teaching at all levels of education Joins interactive 2D and 3D geometry, algebra,
College Algebra Exam File - Fall Test #1
 College Algebra Exam File - Fall 010 Test #1 1.) For each of the following graphs, indicate (/) whether it is the graph of a function and if so, whether it the graph of one-to one function. Circle your
But a vertex has two coordinates, an x and a y coordinate. So how would you find the corresponding y-value?
 We will work with the vertex, orientation, and x- and y-intercepts of these functions. Intermediate algebra Class notes More Graphs of Quadratic Functions (section 11.6) In the previous section, we investigated
3. Solve the following. Round to the nearest thousandth.
 This review does NOT cover everything! Be sure to go over all notes, homework, and tests that were given throughout the semester. 1. Given g ( x) i, h( x) x 4x x, f ( x) x, evaluate the following: a) f
1 of 34 7/9/2018, 8:08 AM
 of 34 7/9/08, 8:08 AM Student: Date: Instructor: Alfredo Alvarez Course: Math 040 Spring 08 Assignment: Math 040 Homework3bbbbtsilittle. Graph each integer in the list on the same number line. 3, 3, 5,
Course Number 432/433 Title Algebra II (A & B) H Grade # of Days 120
 H Grade # of Days 120") Whitman-Hanson Regional High School provides all students with a high- quality education in order to develop reflective, concerned citizens and contributing members of the global community. Course Number
Whitman-Hanson Regional High School provides all students with a high- quality education in order to develop reflective, concerned citizens and contributing members of the global community. Course Number
Vertical Line Test a relationship is a function, if NO vertical line intersects the graph more than once
 Algebra 2 Chapter 2 Domain input values, X (x, y) Range output values, Y (x, y) Function For each input, there is exactly one output Example: Vertical Line Test a relationship is a function, if NO vertical
I. Function Characteristics
 I. Function Characteristics Interval of possible x values for a given function. (Left,Right) Interval of possible y values for a given function. (down, up) What is happening at the far ends of the graph?
Math 2 Coordinate Geometry Part 1 Slope & Transformations
 Math 2 Coordinate Geometry Part 1 Slope & Transformations 1 MATH 1 REVIEW: THE NUMBER LINE A number line is a visual representation of all real numbers. Each of the images below are examples of number
Honors Algebra 2 Unit 4 Notes
 Honors Algebra Unit 4 Notes Day 1 Graph Quadratic Functions in Standard Form GOAL: Graph parabolas in standard form y = ax + bx + c Quadratic Function - Parabola - Vertex - Axis of symmetry - Minimum and
Math 3 Coordinate Geometry part 1 Unit November 3, 2016
 Reviewing the basics The number line A number line is a visual representation of all real numbers. Each of the images below are examples of number lines. The top left one includes only positive whole numbers,
Math 111: Midterm 1 Review
 Math 111: Midterm 1 Review Prerequisite material (see review section for additional problems) 1. Simplify the following: 20a 2 b 4a 2 b 1 ( 2x 3 y 2 ) 2 8 2 3 + ( 1 4 ) 1 2 2. Factor the following: a)
Introduction to Quadratic Functions
 Introduction to Quadratic Functions The St. Louis Gateway Arch was constructed from 1963 to 1965. It cost 13 million dollars to build..1 Up and Down or Down and Up Exploring Quadratic Functions.................
Unit Essential Questions: Does it matter which form of a linear equation that you use?
 Unit Essential Questions: Does it matter which form of a linear equation that you use? How do you use transformations to help graph absolute value functions? How can you model data with linear equations?
MATHEMATICS Geometry Standard: Number, Number Sense and Operations
 Standard: Number, Number Sense and Operations Number and Number A. Connect physical, verbal and symbolic representations of 1. Connect physical, verbal and symbolic representations of Systems integers,
Assignment Assignment for Lesson 9.1
 Assignment Assignment for Lesson.1 Name Date Shifting Away Vertical and Horizontal Translations 1. Graph each cubic function on the grid. a. y x 3 b. y x 3 3 c. y x 3 3 2. Graph each square root function
Sample: Do Not Reproduce QUAD4 STUDENT PAGES. QUADRATIC FUNCTIONS AND EQUATIONS Student Pages for Packet 4: Quadratic Functions and Applications
 Name Period Date QUADRATIC FUNCTIONS AND EQUATIONS Student Pages for Packet 4: Quadratic Functions and Applications QUAD 4.1 Vertex Form of a Quadratic Function 1 Explore how changing the values of h and
f( x ), or a solution to the equation f( x) 0. You are already familiar with ways of solving
, or a solution to the equation f( x) 0. You are already familiar with ways of solving") The Bisection Method and Newton s Method. If f( x ) a function, then a number r for which f( r) 0 is called a zero or a root of the function f( x ), or a solution to the equation f( x) 0. You are already
The Bisection Method and Newton s Method. If f( x ) a function, then a number r for which f( r) 0 is called a zero or a root of the function f( x ), or a solution to the equation f( x) 0. You are already
AP Calculus Summer Review Packet School Year. Name
 AP Calculus Summer Review Packet 016-017 School Year Name Objectives for AP/CP Calculus Summer Packet 016-017 I. Solving Equations & Inequalities (Problems # 1-6) Using the properties of equality Solving
NO CALCULATOR ON ANYTHING EXCEPT WHERE NOTED
 Algebra II (Wilsen) Midterm Review NO CALCULATOR ON ANYTHING EXCEPT WHERE NOTED Remember: Though the problems in this packet are a good representation of many of the topics that will be on the exam, this
Mid Term Pre Calc Review
 Mid Term 2015-13 Pre Calc Review I. Quadratic Functions a. Solve by quadratic formula, completing the square, or factoring b. Find the vertex c. Find the axis of symmetry d. Graph the quadratic function