1-5 Parent Functions and Transformations
|
|
|
- Abraham Cummings
- 6 years ago
- Views:
Transcription


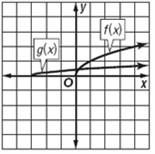


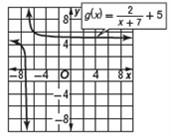

1 Describe the following characteristics of the graph of each parent function: domain, range, intercepts, symmetry, continuity, end behavior, and intervals on which the graph is increasing/decreasing. 1. f (x) = x D = {x x R}, R = {y y Z}. The graph has a y-intercept at (0, 0) and x-intercepts for {x 0 x < 1, x R}. The graph has no symmetry. The graph has a jump discontinuity for {x x Z}. = and =. The graph is constant for {x x Z}. The graph increases for {x x Z}. 3. f (x) = x 3 D = {x x R}, R = {y y R}. The graph has an intercept at (0, 0). The graph is symmetric with respect to the origin. The graph is continuous. = and =. The graph is increasing on (, ). 5. f (x) = c D = {x x R}, R = {y y = c, c R}. If c = 0, all real numbers are x-intercepts. If c 0, there are no x- intercepts. The graph has a y-intercept at (0, c). If c 0, the graph is symmetric with respect to the y-axis. If c = 0, the graph is symmetric with respect to the x-axis, y-axis, and origin. The graph is continuous. and. The graph is constant on (, ). Use the graph of f (x) = to graph each function. 7. g(x) = g(x) = f (x 4). Therefore, g(x) is the graph of f (x) = translated 4 units to the right. esolutions Manual - Powered by Cognero Page 1
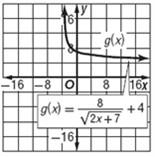
2 9. g(x) = 4 g(x) = f (x + 6) 4. Therefore, g(x) is the graph of f (x) = translated 6 units left and 4 units down. Use the graph of f (x) = to graph each function. 11. g(x) = + 4 g(x) = f (x) + 4. Therefore, g(x) is the graph of f (x) = translated 4 units up. esolutions Manual - Powered by Cognero Page 2
3 13. g(x) = + 8 g(x) = f (x 6) + 8. Therefore, g(x) is the graph of f (x) = translated 6 units right and 8 units up. Describe how the graphs of f (x) = x and g(x) are related. Then write an equation for g(x). 15. The graph of g(x) is the graph of f (x) translated 5 units to the right when g(x) = [[x 5]], or translated 5 units down when g(x) = [[x]] The graph of g(x) is the graph of f (x) reflected in the y-axis and translated 5 units right when g(x) = [[5 x]], or reflected in the y-axis and translated 5 units up when g(x) = [[ x]] + 5. esolutions Manual - Powered by Cognero Page 3
4 19. PROFIT An automobile company experienced an unexpected two-month delay on manufacturing of a new car. The projected profit of the car sales before the delay p (x) is shown below. Describe how the graph of p (x) and the graph of a projection including the delay d(x) are related. Then write an equation for d(x). Since there is a two-month delay, the graph of g(x) is the graph of p (x) translated 2 units (months) to the right. The equation for d(x) can be written by replacing x with x 2 in p (x). So, d(x) = 10(x 2) 3 70(x 2) (x 2) 2. Describe how the graphs of f (x) = x and g(x) are related. Then write an equation for g(x). 21. The graph of g(x) is the graph of f (x) translated 5 units down; g(x) = x The graph of g(x) is the graph of f (x) translated 1 unit to the right and 2 units down; g(x) = x 1 2. esolutions Manual - Powered by Cognero Page 4
5 Identify the parent function f (x) of g(x), and describe how the graphs of g(x) and f (x) are related. Then graph f (x) and g(x) on the same axes. 25. g(x) = 3 g(x) = 3f (x + 8), the graph of g(x) is the graph of f (x) translated 8 units to the left and expanded vertically. The translation left is represented by the addition of 8 on the inside of f (x). The expansion is represented by the coefficient of 3 on the outside of f (x). 27. g(x) = 2[[x 6]] g(x) = 2f (x 6), so the graph of g(x) is the graph of f (x) translated 6 units to the right and expanded vertically. The translation left is represented by the subtraction of 6 on the inside of f (x). The expansion is represented by the coefficient of 2 on the outside of f (x). 29. g(x) = 2 x + 5 g(x) = 2f (x + 5), so g(x) is the graph of f (x) translated 5 units to the left, expanded vertically, and reflected in the x- axis. The translation left is represented by the addition of 5 on the inside of f (x). The expansion is represented by th coefficient of 2 on the outside of f (x). The reflection is represented by the negative coefficient on the outside of f (x). esolutions Manual - Powered by Cognero Page 5
6 31. g(x) = g(x) = f (x + 3), so g(x) is the graph of f (x) translated 3 units to the left and compressed vertically. The translation left is represented by the addition of 3 on the inside of f (x). The compression is represented by the coefficient of on the outside of f (x). Graph each function. 33. Draw circles at ( 6, 2) and (4, 0.25). Draw dots at ( 6, 0.16) and (2, 6) because g( 6) = 0.16 and g(2) = 6. esolutions Manual - Powered by Cognero Page 6
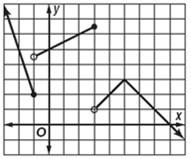
7 35. Draw circles at ( 3, 8) and (3, 9). Draw dots at ( 1, 7) and (4, 2) because h( 1) = 7 and h(4) = Draw circles at ( 1, 4.5) and (3, 1). Draw dots at ( 1, 2) and (3, 6.5) because f ( 1) = 2 and f (3) = 6.5. esolutions Manual - Powered by Cognero Page 7
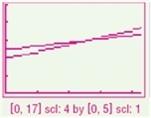
8 39. BUSINESS A no-contract cell phone company charges a flat rate for daily access and $0.10 for each minute. The cost of the plan can be modeled by c(x) = [[x]], where x is the number of minutes used. a. Describe the transformation(s) of the parent function f (x) = [[x]] used to graph c(x). b. The company offers another plan in which the daily access rate is $2.49, and the per-minute rate is $0.05. What function c(x) can be used to describe the second plan? c. Graph both functions on the same graphing calculator screen. d. Would the cost of the plans ever equal each other? If so, at how many minutes? a. The graph of c(x) is the graph of f (x) compressed vertically and translated 1.99 units up. b. The per-minute rate is the rate that is affected by the variable, so c(x) = [[x]]. c. d. Yes; the plans will equal each other at 10 minutes. Use the zoom function of the calculator to find the intersection of the graphs. Notice that the intersection is the segment from x = 10 to x = 11. esolutions Manual - Powered by Cognero Page 8
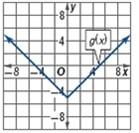
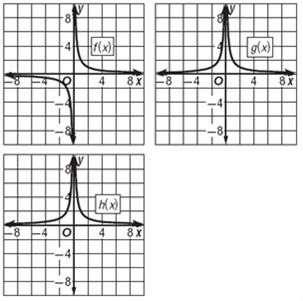
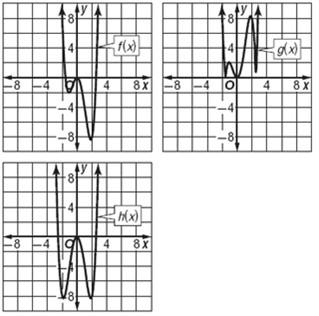
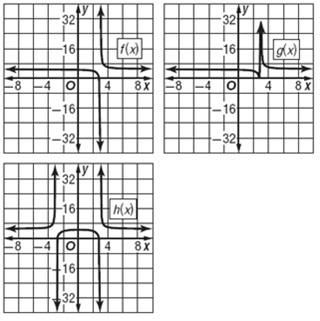
9 Use the graph of f (x) to graph g(x) = f (x) and h(x) = f ( x ). 41. f (x) = To graph g(x) = f (x), reflect the range with respect to the x-axis for all elements of the domain where f (x) is less than zero. To graph h(x) = f ( x ), replace the range for x < 0 with a reflection of the range for x > 0 with respect to the y-axis. esolutions Manual - Powered by Cognero Page 9
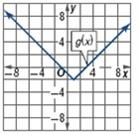
10 43. f (x) = x 4 x 3 4x 2 To graph g(x) = f (x), reflect the range with respect to the x-axis for all elements of the domain where f (x) is less than zero. To graph h(x) = f ( x ), replace the range for x < 0 with a reflection of the range for x > 0 with respect to the y-axis. esolutions Manual - Powered by Cognero Page 10
11 45. f (x) = + 5 To graph g(x) = f (x), reflect the range with respect to the x-axis for all elements of the domain where f (x) is less than zero. To graph h(x) = f ( x ), replace the range for x < 0 with a reflection of the range for x > 0 with respect to the y-axis. esolutions Manual - Powered by Cognero Page 11
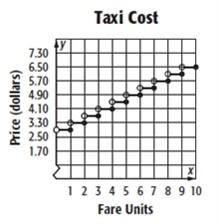
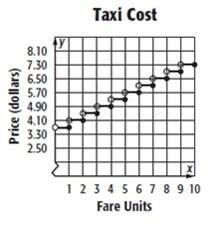
12 47. TRANSPORTATION In New York City, the standard cost for taxi fare is shown. One unit is equal to a distance of 0.2 mile or a time of 60 seconds, when the car is not in motion. a. Write a greatest integer function f (x) that would represent the cost for x units of cab fare, where x > 0. Round to the nearest unit. b. Graph the function. c. How would the graph of f (x) change if the fare for the first unit increased to $3.70? Graph the new function. a. When there is only a fraction of a unit, we must round up. For example, if 3.4 units are used, the customer will be chard for 4 units. To accomplish this, use [[x + 1]] when x is not a whole number. b. c. The graph of f (x) is translated 0.5 unit up. esolutions Manual - Powered by Cognero Page 12
13 Write and graph the function with the given parent function and characteristics. 49. f (x) = ; expanded vertically by a factor of 2, translated 7 units to the left and 5 units up g(x) = + 5 The shift 5 units up is represented by an addition of 5 after f (x), or f (x) + 5. The shift 7 units left is represented by the addition of 7 inside f (x), or f (x + 7). The vertical expansion by a factor of 2 is represented by the coefficient 2 outside f (x), or 2f (x). Therefore, g(x) = 2f (x + 7) + 5. PHYSICS The distance an object travels as a function of time is given by f (t) = at 2 + v 0 t + x 0, where a is the acceleration, v 0 is the initial velocity, and x 0 is the initial position of the object. Describe the transformation(s) of the parent function f (t) = t 2 used to graph f (t) for each of the following. 51. a = 2, v 0 = 2, x 0 = 0 Substitute the values then complete the square to identify the transformations. translated one unit left; translated one unit down esolutions Manual - Powered by Cognero Page 13
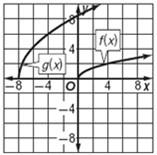
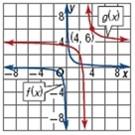
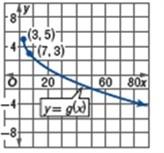
14 53. a = 4, v 0 = 8, x 0 = 1 translated 2 units to the left; expanded vertically; translated 7 units down Write an equation for each g(x). 55. The parent function is f (x) = Therefore, we have g(x) =. The graph of g(x) appears to be f (x) shifted 4 units up and 3 units to the right Use (4, 6) to determine if there is a dilation. There appears to be no dilation, so g(x) = + 4. esolutions Manual - Powered by Cognero Page 14
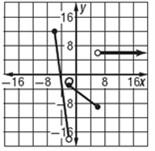
15 57. The parent function is f (x) =. The graph of g(x) appears to be f (x) shifted 4 units left and 6 units down. There is also an obvious dilation. So far, we have g(x) = 6. Let a represent the dilation and use (0, 2) to solve for a. There is no reflection, so a = 4 and g(x) = SHOPPING The management of a new shopping mall originally predicted that attendance in thousands would follow f (x) = for the first 60 days of operation, where x is the number of days after opening and x = 1 corresponds with opening day. Write g(x) in terms of f (x) for each situation below. a. Attendance was consistently 12% higher than expected. b. The opening was delayed 30 days due to construction. c. Attendance was consistently 450 less than expected. a. A consistent percentage change is represented by a dilation, or a coefficient in front of f (x). Therefore, g(x) = 1.12f (x). b. There is no affect on f (x). While the opening is delayed, the number of days after the opening, which determines the domain of the function, is unaffected. c. To represent a consistently less value, subtract the difference from f (x). Therefore, g(x) = f (x) esolutions Manual - Powered by Cognero Page 15
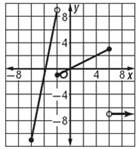
16 Identify the parent function f (x) of g(x), and describe the transformation of f (x) used to graph g(x). 61. The parent function is f (x) = x 3. The graph is reflected in the x-axis because it resembles an upside-down version of the parent graph. Use like points to gauge the translation. In the parent graph, the point of inflection, or the point where the graph appears to curve in at the middle is located at x = 0. The point of inflection of g(x) is 2 units up and 4 units to the right. So far, we have g(x) = a(x 4) where a represents the unknown compression or expansion. Use the given point to identify the value of a. Substituting 3 for a, g(x) = 3(x 4) 3 + 2, which means that the parent graph was expanded vertically. Therefore, the graph of g(x) is the graph of f (x) translated 4 units to the right, expanded vertically, reflected in the x- axis, and translated 2 units up.. esolutions Manual - Powered by Cognero Page 16
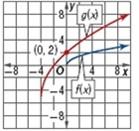
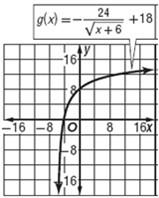
17 63. The parent function is f (x) = of the parent graph.. The graph is reflected in the x-axis because it resembles an upside-down version Use like points to gauge the translation. In the parent graph, the point where the graph begins is located at x = 0. In g(x), this point located 3 units to the right and 5 units up. So far, we have g(x) = a + 5 where a represents the unknown compression or expansion. Use the given point to identify the value of a. Therefore, the graph of g(x) is the graph of f (x) translated 3 units to the right, reflected in the x-axis, and translated 5 units up. esolutions Manual - Powered by Cognero Page 17
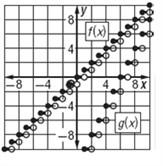
18 Use f (x) to graph g(x). 65. g(x) = 3f (x) 6 f(x) is dilated by a factor of 3 and then translated down 6. Do this to each piece of the graph. Remember that in the graph of f (x), (x, y) = (x, f (x)). Therefore, in the graph of g(x), (x, y) = (x, g(x)) or (x, 3f (x) 6). 1 st Segment 2 nd (x, f (x)) ( 6, 6) to ( 2, 4) (x, g(x)) ( 6, 12) to ( 2, 18) ( 2, 1) to (6, ( 2, 3) to (6, Segment 1) 9) Ray (6, 4) (6, 6) esolutions Manual - Powered by Cognero Page 18
19 67. g(x) = 2f (x) + 1 f(x) is dilated by a factor of 2 and then translated up 1. Do this to each piece of the graph. Remember that in the graph of f (x), (x, y) = (x, f (x)). Therefore, in the graph of g(x), (x, y) = (x, g(x)) or (x, 2f (x) + 1). 1 st Segment 2 nd (x, f (x)) ( 6, 6) to ( 2, 4) (x, g(x)) ( 6, 11) to ( 2, 9) ( 2, 1) to (6, ( 2, 1) to (6, Segment 1) 3) Ray (6, 4) (6, 7) esolutions Manual - Powered by Cognero Page 19
20 Use f (x) = 4 to graph each function. 69. g(x) = 3f (x) g(x) = f (2x + 1) + 8 esolutions Manual - Powered by Cognero Page 20
21 73. ERROR ANALYSIS Danielle and Miranda are describing the transformation g(x) = [[x + 4]]. Danielle says that the graph is shifted 4 units to the left, while Miranda says that the graph is shifted 4 units up. Is either of them correct? Explain. Sample answer: Both; for the greatest integer function, a shift of a units left is identical to a shift of a units up. 75. Writing in Math Explain why order is important when transforming a function with reflections and translations. Sample answer: Order is important because different graphs can be obtained depending on the order the transformations are performed. For example, if (a, b) is on the original graph and there is a translation 6 units up and then a reflection in the x-axis, the resulting point will be (a, b 6). However, if (a, b) is reflected in the x-axis first and then translated 6 units up, the resulting point will be (a, b + 6). REASONING Determine whether the following statements are sometimes, always, or never true. Explain your reasoning. 77. If f (x) is an odd function, then f ( x) = f (x). Sometimes; sample answer: f (x) = x 3 is an odd function and f ( x) f (x) when x = 1. However, f (x) = 0 is an odd function and f ( x) = f (x) for all x. 79. CHALLENGE Describe the transformation of f (x) = if ( 2, 6) lies on the curve. Sample answer: The graph of g(x) = is the graph of f (x) = translated 6 units to the left and 8 units down. 81. Writing in Math Use words, graphs, tables, and equations to relate parent functions and transformations. Show this relationship through a specific example. See students work. Find the average rate of change of each function on the given interval. 83. g(x) = x 2 6x + 1; [4, 8] esolutions Manual - Powered by Cognero Page 21
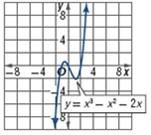
22 Use the graph of each function to describe its end behavior. Support the conjecture numerically. 85. q(x) = 0; Sample answer: As x, the denominator of the fraction will increase and the value of the fraction will approach 0, so g(x) will approach p (x) = 1; Sample answer: As x, the fraction will get closer and closer to, so p (x) will approach 1. Use the graph of each function to estimate its y-intercept and zero(s). Then find these values algebraically. 89. From the graph, it appears that f (x) will intersect the y-axis at (0, 0). Find f (0). Because f (0) = 0, there is a y-intercept at (0, 0). From the graph, it appears that there is an x-intercept near x = 1, x = 0, and x = 2. Let f (x) = 0 and solve for x. Therefore, the zeros of f are 0, 2, and 1. esolutions Manual - Powered by Cognero Page 22
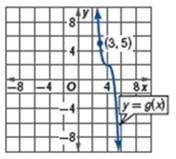
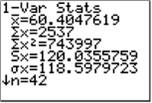
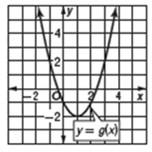
23 91. GOVERNMENT The number of times each of the first 42 presidents vetoed bills are listed below. What is the standard deviation of the data? 2, 0, 0, 7, 1, 0, 12, 1, 0, 10, 3, 0, 0, 9, 7, 6, 29, 93, 13, 0, 12, 414, 44, 170, 42, 82, 39, 44, 6, 50, 37, 635, 250, 181, 21, 30, 43, 66, 31, 78, 44, 25 Enter the data in your calculator and find the standard deviation of the population of data. The standard deviation is about SAT/ACT The figure shows the graph of y = g(x), which has a minimum located at (1, 2.5). What is the maximum value of the function h(x) = 3g(x) 1? A 0 B 1 C 2 D 3 E It can not be determined from the information given The graph of h(x) is the graph of g(x) expanded vertically by a factor of 3, reflected in the x-axis, and translated 1 unit down. The reflection maps the minimum located at (1, 2) to (1, 2), and the translation shifts the point down 1 unit to (1, 1). Due to the reflection, this point is now the location of the maximum of h(x). The vertical expansion does not affect the maximum point on the graph. So, the maximum value of h(x) is 1, and the correct answer is B. esolutions Manual - Powered by Cognero Page 23
24 95. What is the range of y =? F {y y ±2 } G {y y 4} H {y y 0} J {y y 0} The smallest possible value for x 2 is 0. Therefore, the smallest possible value of is or 4. As x approaches positive or negative infinity, x 2 approaches positive infinity. Therefore, the value of approaches infinity. The correct choice is G. also esolutions Manual - Powered by Cognero Page 24
1-3 Continuity, End Behavior, and Limits
 Determine whether each function is continuous at the given x-value(s). Justify using the continuity test. If discontinuous, identify the type of discontinuity as infinite, jump, or removable. 1. f (x)
Study Guide and Review - Chapter 1
 State whether each sentence is true or false If false, replace the underlined term to make a true sentence 1 A function assigns every element of its domain to exactly one element of its range A function
Practice Test - Chapter 1
 Determine whether the given relation represents y as a function of x. 1. y 3 x = 5 When x = 1, y = ±. Therefore, the relation is not one-to-one and not a function. not a function 4. PARKING The cost of
2-1 Power and Radical Functions
 Graph and analyze each function. Describe the domain, range, intercepts, end behavior, continuity, and where the function is increasing or decreasing. 35. Evaluate the function for several x-values in
1-2 Analyzing Graphs of Functions and Relations
 Use the graph of each function to estimate the indicated function values. Then confirm the estimate algebraically. Round to the nearest hundredth, if necessary. The function value at x = 1 appears to be
You used set notation to denote elements, subsets, and complements. (Lesson 0-1)
") You used set notation to denote elements, subsets, and complements. (Lesson 0-1) Describe subsets of real numbers. Identify and evaluate functions and state their domains. set-builder notation interval
You used set notation to denote elements, subsets, and complements. (Lesson 0-1) Describe subsets of real numbers. Identify and evaluate functions and state their domains. set-builder notation interval
2-5 Graphing Special Functions. Graph each function. Identify the domain and range. SOLUTION:
 Graph each function Identify the domain and range Write the piecewise-defined function shown in each graph 1 3 The left portion of the graph is the line g(x) = x + 4 There is an open circle at ( 2, 2),
Mid Term Pre Calc Review
 Mid Term 2015-13 Pre Calc Review I. Quadratic Functions a. Solve by quadratic formula, completing the square, or factoring b. Find the vertex c. Find the axis of symmetry d. Graph the quadratic function
Math Analysis Chapter 1 Notes: Functions and Graphs
 Math Analysis Chapter 1 Notes: Functions and Graphs Day 6: Section 1-1 Graphs Points and Ordered Pairs The Rectangular Coordinate System (aka: The Cartesian coordinate system) Practice: Label each on the
1.1 Pearson Modeling and Equation Solving
 Date:. Pearson Modeling and Equation Solving Syllabus Objective:. The student will solve problems using the algebra of functions. Modeling a Function: Numerical (data table) Algebraic (equation) Graphical
Common Core Algebra 2. Chapter 1: Linear Functions
 Common Core Algebra 2 Chapter 1: Linear Functions 1 1.1 Parent Functions and Transformations Essential Question: What are the characteristics of some of the basic parent functions? What You Will Learn
1-7 Inverse Relations and Functions
 Graph each function using a graphing calculator, and apply the horizontal line test to determine whether its inverse function exists. Write yes or no. 1. f (x) = x 2 + 6x + 9 The graph of f (x) = x 2 +
Math Analysis Chapter 1 Notes: Functions and Graphs
 Math Analysis Chapter 1 Notes: Functions and Graphs Day 6: Section 1-1 Graphs; Section 1- Basics of Functions and Their Graphs Points and Ordered Pairs The Rectangular Coordinate System (aka: The Cartesian
GRAPHING CALCULATOR - WINDOW SIZING
 Section 1.1 GRAPHING CALCULATOR - WINDOW SIZING WINDOW BUTTON. Xmin= Xmax= Xscl= Ymin= Ymax= Yscl= Xres=resolution, smaller number= clearer graph Larger number=quicker graphing Xscl=5, Yscal=1 Xscl=10,
Mid-Chapter Quiz: Lessons 2-1 through 2-3
 Graph and analyze each function. Describe its domain, range, intercepts, end behavior, continuity, and where the function is increasing or decreasing. 1. f (x) = 2x 3 2 16 1.5 6.75 1 2 0 0 1 2 1.5 6.75
Quadratic Functions CHAPTER. 1.1 Lots and Projectiles Introduction to Quadratic Functions p. 31
 CHAPTER Quadratic Functions Arches are used to support the weight of walls and ceilings in buildings. Arches were first used in architecture by the Mesopotamians over 4000 years ago. Later, the Romans
Mid-Chapter Quiz: Lessons 1-1 through 1-4
 Determine whether each relation represents y as a function of x. 1. 3x + 7y = 21 This equation represents y as a function of x, because for every x-value there is exactly one corresponding y-value. The
5-3 Polynomial Functions
 For each graph, a. describe the end behavior, b. determine whether it represents an odd-degree or an even-degree function, and c. state the number of real zeros. 35. a. As the x-values approach negative
Graphs of Exponential
 Graphs of Exponential Functions By: OpenStaxCollege As we discussed in the previous section, exponential functions are used for many realworld applications such as finance, forensics, computer science,
2-1 Power and Radical Functions
 Graph and analyze each function. Describe the domain, range, intercepts, end behavior, continuity, and where the function is increasing or decreasing. 15. h(x) = x 3 Evaluate the function for several x-values
UNIT 3 EXPRESSIONS AND EQUATIONS Lesson 3: Creating Quadratic Equations in Two or More Variables
 Guided Practice Example 1 Find the y-intercept and vertex of the function f(x) = 2x 2 + x + 3. Determine whether the vertex is a minimum or maximum point on the graph. 1. Determine the y-intercept. The
2-5 Rational Functions
 Find the domain of each function and the equations of the vertical or horizontal asymptotes, if any. 3. f (x) = The function is undefined at the real zeros of the denominator b(x) = (x + 3)(x 4). The real
3.1 INTRODUCTION TO THE FAMILY OF QUADRATIC FUNCTIONS
 3.1 INTRODUCTION TO THE FAMILY OF QUADRATIC FUNCTIONS Finding the Zeros of a Quadratic Function Examples 1 and and more Find the zeros of f(x) = x x 6. Solution by Factoring f(x) = x x 6 = (x 3)(x + )
UNIT 8 STUDY SHEET POLYNOMIAL FUNCTIONS
 UNIT 8 STUDY SHEET POLYNOMIAL FUNCTIONS KEY FEATURES OF POLYNOMIALS Intercepts of a function o x-intercepts - a point on the graph where y is zero {Also called the zeros of the function.} o y-intercepts
Graphing Techniques. Domain (, ) Range (, ) Squaring Function f(x) = x 2 Domain (, ) Range [, ) f( x) = x 2
 Range (, ) Squaring Function f(x) = x 2 Domain (, ) Range [, ) f( x) = x 2") Graphing Techniques In this chapter, we will take our knowledge of graphs of basic functions and expand our ability to graph polynomial and rational functions using common sense, zeros, y-intercepts, stretching
Graphing Techniques In this chapter, we will take our knowledge of graphs of basic functions and expand our ability to graph polynomial and rational functions using common sense, zeros, y-intercepts, stretching
Algebra 2 Semester 1 (#2221)
") Instructional Materials for WCSD Math Common Finals The Instructional Materials are for student and teacher use and are aligned to the 2016-2017 Course Guides for the following course: Algebra 2 Semester
Instructional Materials for WCSD Math Common Finals The Instructional Materials are for student and teacher use and are aligned to the 2016-2017 Course Guides for the following course: Algebra 2 Semester
Standard Form v. Vertex Form
 Standard Form v. Vertex Form The Standard Form of a quadratic equation is:. The Vertex Form of a quadratic equation is where represents the vertex of an equation and is the same a value used in the Standard
2.1 Solutions to Exercises
 Last edited 9/6/17.1 Solutions to Exercises 1. P(t) = 1700t + 45,000. D(t) = t + 10 5. Timmy will have the amount A(n) given by the linear equation A(n) = 40 n. 7. From the equation, we see that the slope
Unit 12 Special Functions
 Algebra Notes Special Functions Unit 1 Unit 1 Special Functions PREREQUISITE SKILLS: students should be able to describe a relation and a function students should be able to identify the domain and range
Section Graphs and Lines
 Section 1.1 - Graphs and Lines The first chapter of this text is a review of College Algebra skills that you will need as you move through the course. This is a review, so you should have some familiarity
Determine if the lines defined by the given equations are parallel, perpendicular, or neither. 1) -4y = 2x + 5
 -4y = 2x + 5") Review test 3 -College Algebra Math1314 - Spring 2017 - Houston Community College Name Date MULTIPLE CHOICE. Choose the one alternative that best completes the statement or answers the question. Determine
Review test 3 -College Algebra Math1314 - Spring 2017 - Houston Community College Name Date MULTIPLE CHOICE. Choose the one alternative that best completes the statement or answers the question. Determine
Function Transformations and Symmetry
 CHAPTER Function Transformations and Symmetry The first well-documented postal system was in ancient Rome, where mail was carried by horsedrawn carriages and ox-drawn wagons. The US Postal Service delivers
2.4. A LIBRARY OF PARENT FUNCTIONS
 2.4. A LIBRARY OF PARENT FUNCTIONS 1 What You Should Learn Identify and graph linear and squaring functions. Identify and graph cubic, square root, and reciprocal function. Identify and graph step and
Final Exam Review Algebra Semester 1
 Final Exam Review Algebra 015-016 Semester 1 Name: Module 1 Find the inverse of each function. 1. f x 10 4x. g x 15x 10 Use compositions to check if the two functions are inverses. 3. s x 7 x and t(x)
Chapter 3 Practice Test
 1. Complete parts a c for each quadratic function. a. Find the y-intercept, the equation of the axis of symmetry, and the x-coordinate of the vertex. b. Make a table of values that includes the vertex.
Math 3 Coordinate Geometry Part 2 Graphing Solutions
 Math 3 Coordinate Geometry Part 2 Graphing Solutions 1 SOLVING SYSTEMS OF EQUATIONS GRAPHICALLY The solution of two linear equations is the point where the two lines intersect. For example, in the graph
Assignment Assignment for Lesson 9.1
 Assignment Assignment for Lesson.1 Name Date Shifting Away Vertical and Horizontal Translations 1. Graph each cubic function on the grid. a. y x 3 b. y x 3 3 c. y x 3 3 2. Graph each square root function
Lesson 10 Rational Functions and Equations
 Lesson 10 Rational Functions and Equations Lesson 10 Rational Functions and Equations In this lesson, you will embark on a study of rational functions. Rational functions look different because they are
Study Guide and Review - Chapter 10
 State whether each sentence is true or false. If false, replace the underlined word, phrase, expression, or number to make a true sentence. 1. A triangle with sides having measures of 3, 4, and 6 is a
Study Guide and Review - Chapter 10
 State whether each sentence is true or false. If false, replace the underlined word, phrase, expression, or number to make a true sentence. 1. A triangle with sides having measures of 3, 4, and 6 is a
Section 2.2 Graphs of Linear Functions
 Section. Graphs of Linear Functions Section. Graphs of Linear Functions When we are working with a new function, it is useful to know as much as we can about the function: its graph, where the function
Unit 1 and Unit 2 Concept Overview
 Unit 1 and Unit 2 Concept Overview Unit 1 Do you recognize your basic parent functions? Transformations a. Inside Parameters i. Horizontal ii. Shift (do the opposite of what feels right) 1. f(x+h)=left
The x-intercept can be found by setting y = 0 and solving for x: 16 3, 0
 y=-3/4x+4 and y=2 x I need to graph the functions so I can clearly describe the graphs Specifically mention any key points on the graphs, including intercepts, vertex, or start/end points. What is the
Module 3: Graphing Quadratic Functions
 Haberman MTH 95 Section V Quadratic Equations and Functions Module 3 Graphing Quadratic Functions In this module, we'll review the graphing quadratic functions (you should have studied the graphs of quadratic
WHAT YOU SHOULD LEARN
 GRAPHS OF EQUATIONS WHAT YOU SHOULD LEARN Sketch graphs of equations. Find x- and y-intercepts of graphs of equations. Use symmetry to sketch graphs of equations. Find equations of and sketch graphs of
Solutions of Equations An ordered pair will be a solution to an equation if the equation is when the numbers are substituted into the equation.
 1 CA-Fall 2011-Jordan College Algebra, 4 th edition, Beecher/Penna/Bittinger, Pearson/Addison Wesley, 2012 Chapter 1: Graphs, Functions, and Models Section 1.1 Introduction to Graphing Solutions of Equations
Unit 2: Functions and Graphs
 AMHS Precalculus - Unit 16 Unit : Functions and Graphs Functions A function is a rule that assigns each element in the domain to exactly one element in the range. The domain is the set of all possible
Solve the following system of equations. " 2x + 4y = 8 # $ x 3y = 1. 1 cont d. You try:
 1 Solve the following system of equations. " 2x + 4y = 8 # $ x 3y = 1 Method 1: Substitution 1. Solve for x in the second equation. 1 cont d Method 3: Eliminate y 1. Multiply first equation by 3 and second
Unit 6 Quadratic Functions
 Unit 6 Quadratic Functions 12.1 & 12.2 Introduction to Quadratic Functions What is A Quadratic Function? How do I tell if a Function is Quadratic? From a Graph The shape of a quadratic function is called
Quadratic Functions. *These are all examples of polynomial functions.
 Look at: f(x) = 4x-7 f(x) = 3 f(x) = x 2 + 4 Quadratic Functions *These are all examples of polynomial functions. Definition: Let n be a nonnegative integer and let a n, a n 1,..., a 2, a 1, a 0 be real
AH Properties of Functions.notebook April 19, 2018
 Functions Rational functions are of the form where p(x) and q(x) are polynomials. If you can sketch a function without lifting the pencil off the paper, it is continuous. E.g. y = x 2 If there is a break
Essential Questions. Key Terms. Algebra. Arithmetic Sequence
 Linear Equations and Inequalities Introduction Average Rate of Change Coefficient Constant Rate of Change Continuous Discrete Domain End Behaviors Equation Explicit Formula Expression Factor Inequality
9.1: GRAPHING QUADRATICS ALGEBRA 1
 9.1: GRAPHING QUADRATICS ALGEBRA 1 OBJECTIVES I will be able to graph quadratics: Given in Standard Form Given in Vertex Form Given in Intercept Form What does the graph of a quadratic look like? https://www.desmos.com/calculator
MAT 124 Solutions Sample Questions for Exam 2
 MAT 124 Solutions Sample Questions for Exam 2 Note: Most of these results can be checked graphically. 1. a) The slope of l " is computed as follows: m " = & '(& ) * ' (* ) = +(, -(. = /, = 2. So the equation
3-2. Families of Graphs. Look Back. OBJECTIVES Identify transformations of simple graphs. Sketch graphs of related functions.
 3-2 BJECTIVES Identif transformations of simple graphs. Sketch graphs of related functions. Families of Graphs ENTERTAINMENT At some circuses, a human cannonball is shot out of a special cannon. In order
The equation of the axis of symmetry is. Therefore, the x-coordinate of the vertex is 2.
 1. Find the y-intercept, the equation of the axis of symmetry, and the x-coordinate of the vertex for f (x) = 2x 2 + 8x 3. Then graph the function by making a table of values. Here, a = 2, b = 8, and c
THS Step By Step Calculus Chapter 3
 Name: Class Period: Throughout this packet there will be blanks you are expected to fill in prior to coming to class. This packet follows your Larson Textbook. Do NOT throw away! Keep in 3 ring-binder
A I only B II only C II and IV D I and III B. 5 C. -8
 1. (7A) Points (3, 2) and (7, 2) are on the graphs of both quadratic functions f and g. The graph of f opens downward, and the graph of g opens upward. Which of these statements are true? I. The graphs
Test 3 review SHORT ANSWER. Write the word or phrase that best completes each statement or answers the question.
 Test 3 review SHORT ANSWER. Write the word or phrase that best completes each statement or answers the question. Approximate the coordinates of each turning point by graphing f(x) in the standard viewing
ALGEBRA 1 NOTES. Quarter 3. Name: Block
 2016-2017 ALGEBRA 1 NOTES Quarter 3 Name: Block Table of Contents Unit 8 Exponent Rules Exponent Rules for Multiplication page 4 Negative and Zero Exponents page 8 Exponent Rules Involving Quotients page
UNIT 1: NUMBER LINES, INTERVALS, AND SETS
 ALGEBRA II CURRICULUM OUTLINE 2011-2012 OVERVIEW: 1. Numbers, Lines, Intervals and Sets 2. Algebraic Manipulation: Rational Expressions and Exponents 3. Radicals and Radical Equations 4. Function Basics
Section 4.1 Review of Quadratic Functions and Graphs (3 Days)
") Integrated Math 3 Name What can you remember before Chapter 4? Section 4.1 Review of Quadratic Functions and Graphs (3 Days) I can determine the vertex of a parabola and generate its graph given a quadratic
Integrated Math 3 Name What can you remember before Chapter 4? Section 4.1 Review of Quadratic Functions and Graphs (3 Days) I can determine the vertex of a parabola and generate its graph given a quadratic
Algebra I Notes Absolute Value Functions Unit 04c
 OBJECTIVES: F.IF.B.4 Interpret functions that arise in applications in terms of the context. For a function that models a relationship between two quantities, interpret key features of graphs and tables
Chapter 3 Transformations of Graphs and Data
 Chapter 3 Transformations of Graphs and Data 3.1 Graphs of Parent Functions Parent Function the simplest equation of a particular type of function o Ex: Quadratic Function: y = x 2 There are EIGHT important
Math 135: Intermediate Algebra Homework 10 Solutions December 18, 2007
 Math 135: Intermediate Algebra Homework 10 Solutions December 18, 007 Homework from: Akst & Bragg, Intermediate Algebra through Applications, 006 Edition, Pearson/Addison-Wesley Subject: Linear Systems,
. As x gets really large, the last terms drops off and f(x) ½x
 ½x") Pre-AP Algebra 2 Unit 8 -Lesson 3 End behavior of rational functions Objectives: Students will be able to: Determine end behavior by dividing and seeing what terms drop out as x Know that there will be
Pre-AP Algebra 2 Unit 8 -Lesson 3 End behavior of rational functions Objectives: Students will be able to: Determine end behavior by dividing and seeing what terms drop out as x Know that there will be
Math 2 Spring Unit 5 Bundle Transformational Graphing and Inverse Variation
 Math 2 Spring 2017 Unit 5 Bundle Transformational Graphing and Inverse Variation 1 Contents Transformations of Functions Day 1... 3 Transformations with Functions Day 1 HW... 10 Transformations with Functions
Determine whether the relation represents a function. If it is a function, state the domain and range. 1)
") MAT 103 TEST 2 REVIEW NAME Determine whether the relation represents a function. If it is a function, state the domain and range. 1) 3 6 6 12 9 18 12 24 Circle the correct response: Function Not a function
MAT 103 TEST 2 REVIEW NAME Determine whether the relation represents a function. If it is a function, state the domain and range. 1) 3 6 6 12 9 18 12 24 Circle the correct response: Function Not a function
3.2 Graphs of Linear Equations
 3.2 Graphs of Linear Equations Learning Objectives Graph a linear function using an equation. Write equations and graph horizontal and vertical lines. Analyze graphs of linear functions and read conversion
UNIT 4 DESCRIPTIVE STATISTICS Lesson 2: Working with Two Categorical and Quantitative Variables Instruction
 Prerequisite Skills This lesson requires the use of the following skills: plotting points on the coordinate plane, given data in a table plotting the graph of a linear function, given an equation plotting
The shortest distance from point K to line is the length of a segment perpendicular to from point K. Draw a perpendicular segment from K to.
 8. Find the distance between each pair of parallel lines with the given equations. Copy each figure. Construct the segment that represents the distance indicated. 12. K to The shortest distance from point
Name: Algebra. Unit 8. Quadratic. Functions
 Name: Algebra Unit 8 Quadratic Functions Quadratic Function Characteristics of the Graph: Maximum Minimum Parent Function Equation: Vertex How many solutions can there be? They mean what? What does a do?
Algebra II Chapter 4: Quadratic Functions and Factoring Part 1
 Algebra II Chapter 4: Quadratic Functions and Factoring Part 1 Chapter 4 Lesson 1 Graph Quadratic Functions in Standard Form Vocabulary 1 Example 1: Graph a Function of the Form y = ax 2 Steps: 1. Make
Chapter 3A Rectangular Coordinate System
 Fry Texas A&M University! Math 150! Spring 2015!!! Unit 4!!! 1 Chapter 3A Rectangular Coordinate System A is any set of ordered pairs of real numbers. The of the relation is the set of all first elements
1. How many white tiles will be in Design 5 of the pattern? Explain your reasoning.
 Algebra 2 Semester 1 Review Answer the question for each pattern. 1. How many white tiles will be in Design 5 of the pattern Explain your reasoning. 2. What is another way to represent the expression 3.
1.1 THIS IS LINES 1.2 FUNCTIONS
 GOOGLE SHEETS 1.1 THIS IS LINES 1.2 FUNCTIONS I CAN LEARN HOW TO EVALUATE FUNCTIONS AND FIND THEIR DOMAINS. I HAVE A VIDEO POSTED ONLINE THAT HELPS YOU THROUGH THE MIRE OF GOOGLE SHEETS. ON THE VIDEO I
Y. Butterworth Lehmann & 9.2 Page 1 of 11
 Pre Chapter 9 Coverage Quadratic (2 nd Degree) Form a type of graph called a parabola Form of equation we'll be dealing with in this chapter: y = ax 2 + c Sign of a determines opens up or down "+" opens
MAFS Algebra 1. Quadratic Functions. Day 17 - Student Packet
 MAFS Algebra 1 Quadratic Functions Day 17 - Student Packet Day 17: Quadratic Functions MAFS.912.F-IF.3.7a, MAFS.912.F-IF.3.8a I CAN graph a quadratic function using key features identify and interpret
Core Mathematics 3 Functions
 http://kumarmaths.weebly.com/ Core Mathematics 3 Functions Core Maths 3 Functions Page 1 Functions C3 The specifications suggest that you should be able to do the following: Understand the definition of
2.1 Basics of Functions and Their Graphs
 .1 Basics of Functions and Their Graphs Section.1 Notes Page 1 Domain: (input) all the x-values that make the equation defined Defined: There is no division by zero or square roots of negative numbers
Other Functions and their Inverses
 CHAPTER Other Functions and their Inverses Water tanks have been used throughout human history to store water for consumption. Many municipal water tanks are placed on top of towers so that water drawn
2-3 Graphing Rational Functions
 2-3 Graphing Rational Functions Factor What are the end behaviors of the Graph? Sketch a graph How to identify the intercepts, asymptotes and end behavior of a rational function. How to sketch the graph
Notes Packet on Quadratic Functions and Factoring Graphing quadratic equations in standard form, vertex form, and intercept form.
 Notes Packet on Quadratic Functions and Factoring Graphing quadratic equations in standard form, vertex form, and intercept form. A. Intro to Graphs of Quadratic Equations:! = ax + bx + c A is a function
Section 1.6 & 1.7 Parent Functions and Transformations
 Math 150 c Lynch 1 of 8 Section 1.6 & 1.7 Parent Functions and Transformations Piecewise Functions Example 1. Graph the following piecewise functions. 2x + 3 if x < 0 (a) f(x) = x if x 0 1 2 (b) f(x) =
STRAIGHT LINE GRAPHS THE COORDINATES OF A POINT. The coordinates of any point are written as an ordered pair (x, y)
") THE COORDINATES OF A POINT STRAIGHT LINE GRAPHS The coordinates of any point are written as an ordered pair (x, y) Point P in the diagram has coordinates (2, 3). Its horizontal distance along the x axis
THE COORDINATES OF A POINT STRAIGHT LINE GRAPHS The coordinates of any point are written as an ordered pair (x, y) Point P in the diagram has coordinates (2, 3). Its horizontal distance along the x axis
Math 2 Final Exam Study Guide. Translate down 2 units (x, y-2)
") Math 2 Final Exam Study Guide Name: Unit 2 Transformations Translation translate Slide Moving your original point to the left (-) or right (+) changes the. Moving your original point up (+) or down (-)
Math 2 Final Exam Study Guide Name: Unit 2 Transformations Translation translate Slide Moving your original point to the left (-) or right (+) changes the. Moving your original point up (+) or down (-)
Math 2 Coordinate Geometry Part 3 Inequalities & Quadratics
 Math 2 Coordinate Geometry Part 3 Inequalities & Quadratics 1 DISTANCE BETWEEN TWO POINTS - REVIEW To find the distance between two points, use the Pythagorean theorem. The difference between x 1 and x
Section 1.1: Functions and Models
 Section 1.1: Functions and Models Definition: A function is a rule that assigns to each element of one set (called the domain) exactly one element of a second set (called the range). A function can be
Math 370 Exam 1 Review Name. Use the vertical line test to determine whether or not the graph is a graph in which y is a function of x.
 Math 370 Exam 1 Review Name Determine whether the relation is a function. 1) {(-6, 6), (-6, -6), (1, 3), (3, -8), (8, -6)} Not a function The x-value -6 corresponds to two different y-values, so this relation
Test # 1 Review. to the line x y 5. y 64x x 3. y ( x 5) 4 x 2. y x2 2 x. Á 3, 4 ˆ 2x 5y 9. x y 2 3 y x 1. Á 6,4ˆ and is perpendicular. x 9. g(t) t 10.
 4 x 2. y x2 2 x. Á 3, 4 ˆ 2x 5y 9. x y 2 3 y x 1. Á 6,4ˆ and is perpendicular. x 9. g(t) t 10.") Name: Class: Date: ID: A Test # 1 Review Short Answer 1. Find all intercepts: y 64x x 3 2. Find all intercepts: y ( x 5) 4 x 2 3. Test for symmetry with respect to each axis and to the origin. y x2 2 x
Name: Class: Date: ID: A Test # 1 Review Short Answer 1. Find all intercepts: y 64x x 3 2. Find all intercepts: y ( x 5) 4 x 2 3. Test for symmetry with respect to each axis and to the origin. y x2 2 x
Slide 2 / 222. Algebra II. Quadratic Functions
 Slide 1 / 222 Slide 2 / 222 Algebra II Quadratic Functions 2014-10-14 www.njctl.org Slide 3 / 222 Table of Contents Key Terms Explain Characteristics of Quadratic Functions Combining Transformations (review)
minutes/question 26 minutes
 st Set Section I (Multiple Choice) Part A (No Graphing Calculator) 3 problems @.96 minutes/question 6 minutes. What is 3 3 cos cos lim? h hh (D) - The limit does not exist.. At which of the five points
Chapter 1 Polynomials and Modeling
 Chapter 1 Polynomials and Modeling 1.1 Linear Functions Recall that a line is a function of the form y = mx+ b, where m is the slope of the line (how steep the line is) and b gives the y-intercept (where
State the domain and range of the relation. EX: {(-1,1), (1,5), (0,3)} 1 P a g e Province Mathematics Southwest TN Community College
, (1,5), (0,3)} 1 P a g e Province Mathematics Southwest TN Community College") A relation is a set of ordered pairs of real numbers. The domain, D, of a relation is the set of all first coordinates of the ordered pairs in the relation (the xs). The range, R, of a relation is the
A relation is a set of ordered pairs of real numbers. The domain, D, of a relation is the set of all first coordinates of the ordered pairs in the relation (the xs). The range, R, of a relation is the
Precalculus Chapter 2A Practice Guide Name
 Precalculus Chapter A Practice Guide Name Day 1 Day.1 (page 96). (page 108 ).3 (page 1) 15,1,,3,7,33 37,4,49,50,5,55 17,30,38,47,53,61 67,85 Day 3 43,48,51,68 1,4,6,7,13,16,18,19.4 Worksheets.5 (page 145)
MATHS METHODS QUADRATICS REVIEW. A reminder of some of the laws of expansion, which in reverse are a quick reference for rules of factorisation
 MATHS METHODS QUADRATICS REVIEW LAWS OF EXPANSION A reminder of some of the laws of expansion, which in reverse are a quick reference for rules of factorisation a) b) c) d) e) FACTORISING Exercise 4A Q6ace,7acegi
Algebra 2 Honors Lesson 10 Translating Functions
 Algebra 2 Honors Lesson 10 Translating Functions Objectives: The students will be able to translate a base function horizontally and vertically. Students will be able to describe the translation of f(x)
Pre-Calculus Notes: Chapter 3 The Nature of Graphs
 Section Families of Graphs Name: Pre-Calculus Notes: Chapter 3 The Nature of Graphs Family of graphs Parent graph A group of graphs that share similar properties The most basic graph that s transformed
Sample tasks from: Algebra Assessments Through the Common Core (Grades 6-12)
") Sample tasks from: Algebra Assessments Through the Common Core (Grades 6-12) A resource from The Charles A Dana Center at The University of Texas at Austin 2011 About the Dana Center Assessments More than
Sample tasks from: Algebra Assessments Through the Common Core (Grades 6-12) A resource from The Charles A Dana Center at The University of Texas at Austin 2011 About the Dana Center Assessments More than
Section 3.7 Notes. Rational Functions. is a rational function. The graph of every rational function is smooth (no sharp corners)
") Section.7 Notes Rational Functions Introduction Definition A rational function is fraction of two polynomials. For example, f(x) = x x + x 5 Properties of Rational Graphs is a rational function. The graph
Section.7 Notes Rational Functions Introduction Definition A rational function is fraction of two polynomials. For example, f(x) = x x + x 5 Properties of Rational Graphs is a rational function. The graph