Gridded Data Speedwell Derived Gridded Products
|
|
|
- Hugh Gregory
- 6 years ago
- Views:
Transcription
1 Gridded Data Speedwell Derived Gridded Products Introduction Speedwell Weather offers access to a wide choice of gridded data series. These datasets are sourced from the originating agencies in their native resolution. For many users, these native resolution datasets will be sufficient to meet their needs, however, some projects may require increased spatial or temporal resolution. In order to enhance the native gridded data, Speedwell processes the data through a proprietary methodology to generate a new series at higher spatial resolutions and specific vertical heights. These are called Speedwell Derived Products and can be found in the Speedwell Gridded Data catalogue. The following is a guide to how these are produced. Background The term Gridded data can mean many things. Here at Speedwell we define gridded data as a geospatial dataset that has been produced via the interpolation of regular/irregular meteorological observations or reanalysis products. Reanalysis is a relatively young field in meteorology and is a product of the development in numerical forecast modelling which relies on establishing a uniform set of initial conditions to run the forecast. It provides a multivariate, spatially complete, and coherent record of the global atmospheric circulation. The two main (but not exclusive) sources for the generation of these hi-resolution derived products are the global North American and European reanalysis MERRA2 and ERA-Interim (transitioning to ERA5) respectively. These two series are selected as they have global coverage at several atmospheric layers (pressure levels). Using these, it is possible to generate higher resolution products anywhere in the world at any height Note: Speedwell Weather only uses official sources when downloading native gridded products. Methodology The production of proprietary high resolution datasets with custom vertical heights follows the following steps. Step #1 Native resolution gridded datasets are downloaded from the originating institutions. The accuracy of these datasets vs. surface observations are analysed where overlapping data is available. The findings of the analysis are published as a dataset specific white paper available to Speedwell clients. Step #2 Upon confirming the accuracy (as compared with surface observations) of a dataset we then proceed with generating our own proprietary dataset. The main workflow is: o o Application of a high resolution algorithm that takes into account the spatial gradient in both dimensions XX and YY to generate higher horizontal resolution products (high resolution statistical downscale); If the derived product is to be set on a specific height other than the surface, then a vertical interpolation algorithm is also computed (for example, this technique would be applied when generating wind speed data for wind turbines at various heights above the ground);
2 Step #3 The accuracy of the high resolution (or vertically adjusted) datasets are then reviewed vs. surface observations. The purpose is to check for added value and for interpolation artifacts, i.e. smoothing data without degrading the native grid extreme values. The findings of the analysis are published as a dataset specific white paper available to Speedwell clients. Details Vertical Interpolation Vertical interpolation is carried out assuming that some quantities (like wind, temperature, humidity, etc.) vary linearly with log pressure/height. The value of field F at pressure/height p i is given by the formula: Fi = αf j + (1 α)f j 1 (1) where j and j -1 are levels at which the field F is known immediately above and below level i, and α = ln[ p i p j 1 ] ln[ p j p j 1 ] For the vertical interpolation, we use model levels instead of pressure levels, as they are terrain following levels, i.e. they take into account the orography effect Horizontal Interpolation Bicubic Interpolation Bicubic interpolation is cubic interpolation in two dimensions. In contrast to bilinear interpolation, which only takes 4 points (2 2) into account, bicubic interpolation considers 16 points (4 4). Data resampled with bicubic interpolation is smoother and have fewer interpolation artifacts, and preserves fine detail better than the common bilinear algorithm : (2)


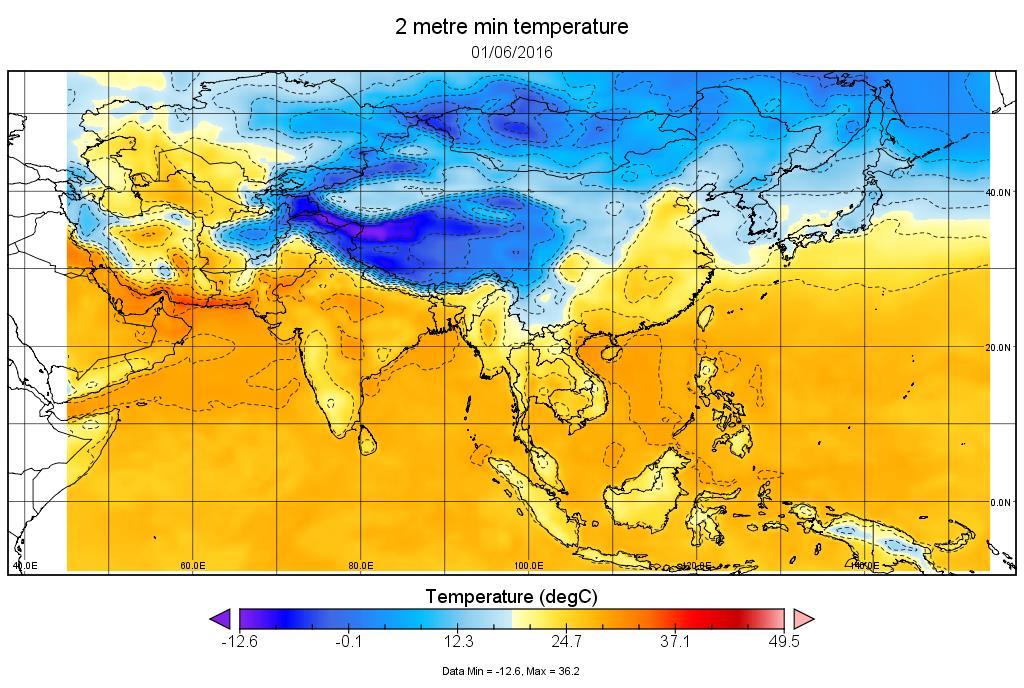
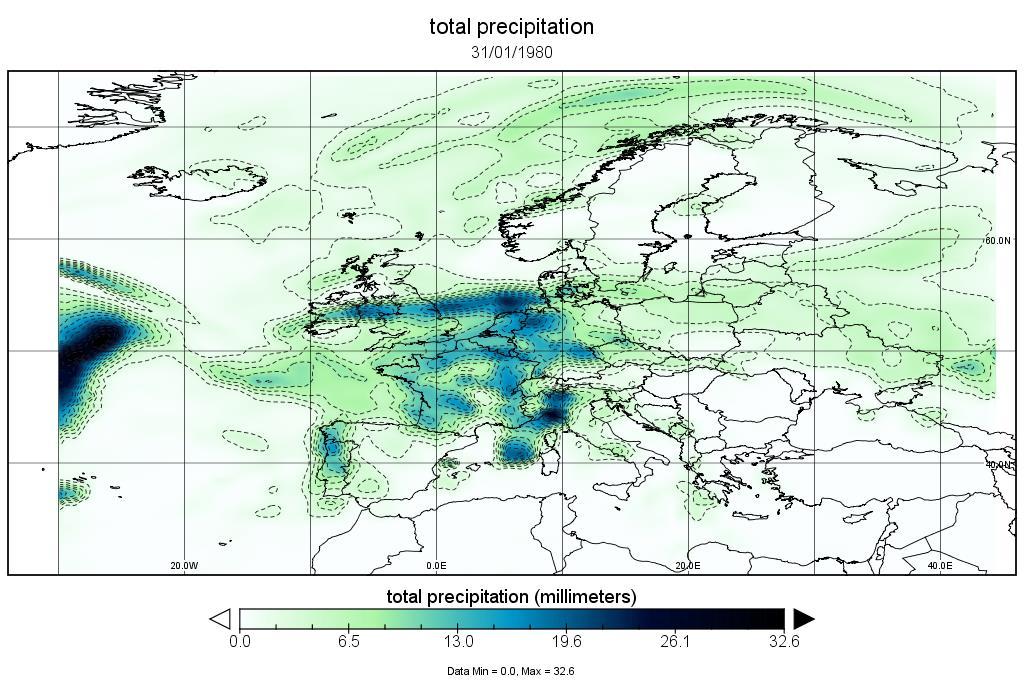
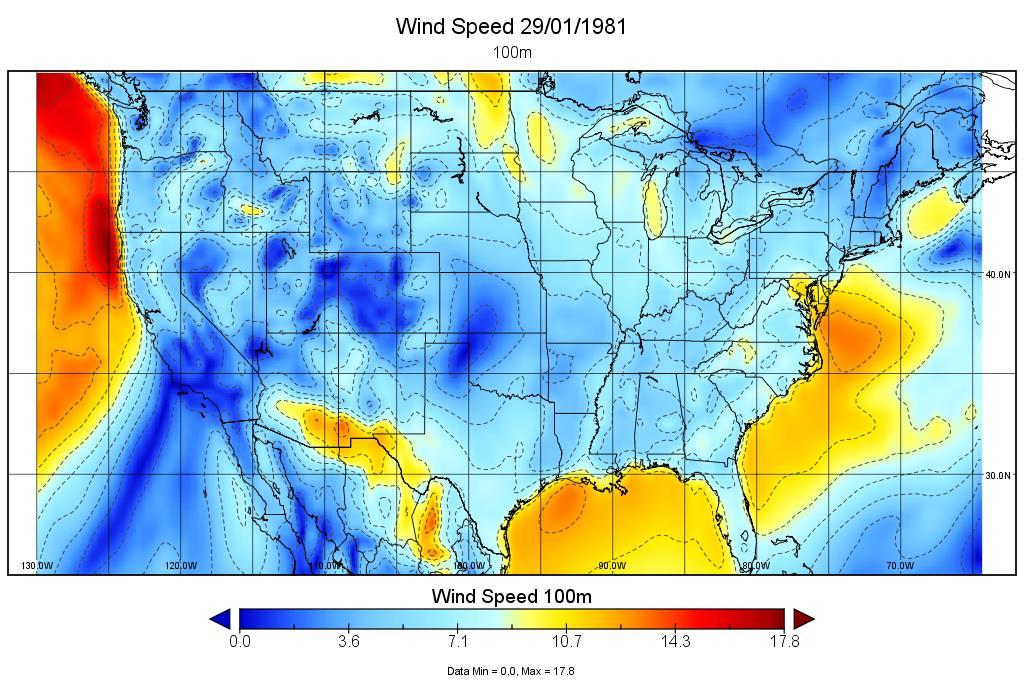
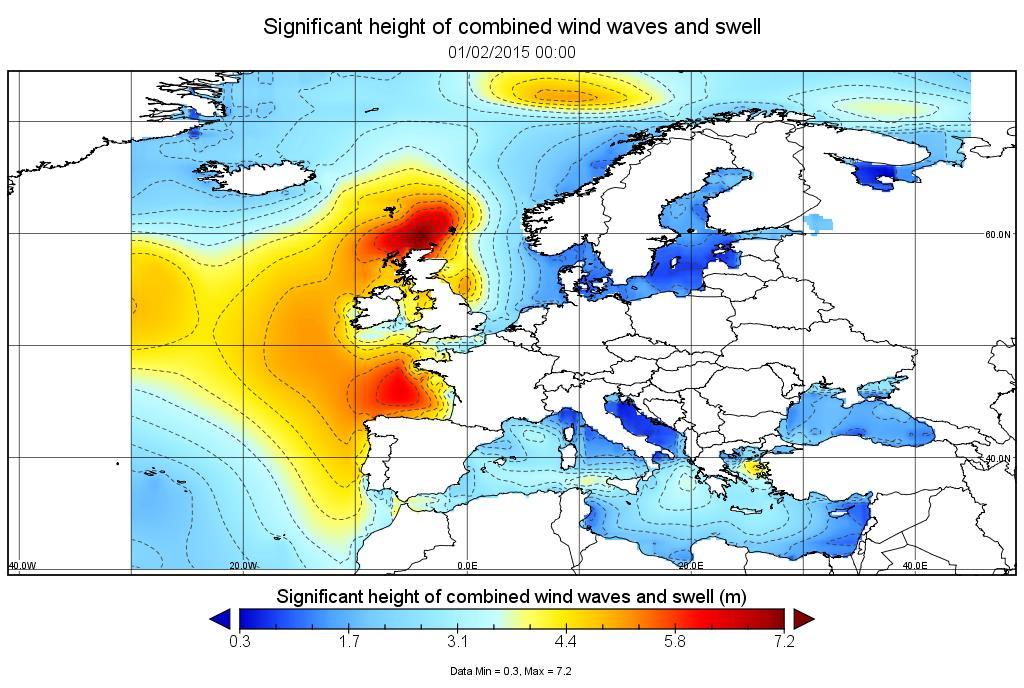
3 Image #1 The two images below demonstrate the difference between bilinear (left) and bicubic (right) interpolation for wind at 80m height: Red circles illustrate some of the smoothing problems with bilinear interpolation that are not present in the bicubic. Hence bicubic interpolation is able to smooth data without degrading extreme values. Image #2 The following images depict 5km x 5km resolution Speedwell derived gridded datasets.
4
5
 PDF: buoy vs derived 5km, 40km from Ireland shore correl BIAS MAE 95% -0.10 0.")
6 Image #3 The following images demonstrate the comparison of gridded observations vs. surface observations Significant Wave height (m) PDF: buoy vs derived 5km, 40km from Ireland shore correl BIAS MAE 95% Wind speed at 10 and 50 m (m/s) daily time series series: ground obs10m vs derived10m 5km over Dagget US BIAS MAE CORR %
 correl BIAS MAE 95% 66.01 197.")
7 Surface Solar Radiation daily time series (J/cm2): ground obs vs derived 5km over Stuttgart (Germany) correl BIAS MAE 95%
Scientific Applications of the Regional Climate Model Evaluation System (RCMES)
") Scientific Applications of the Regional Climate Model Evaluation System (RCMES) Paul C. Loikith, Duane E. Waliser, Chris Mattmann, Jinwon Kim, Huikyo Lee, Paul M. Ramirez, Andrew F. Hart, Cameron E. Goodale,
Scientific Applications of the Regional Climate Model Evaluation System (RCMES) Paul C. Loikith, Duane E. Waliser, Chris Mattmann, Jinwon Kim, Huikyo Lee, Paul M. Ramirez, Andrew F. Hart, Cameron E. Goodale,
Integration of Economic and Construction Outlooks: A Case Study. Lorenz Kleist Consultant October 6, 2009
 Integration of Economic and Construction Outlooks: A Case Study Lorenz Kleist Consultant October 6, 2009 The Client The European Rental Association (ERA) ERA is a young European association ERA represents
Interpolation of gridded data using Geostrophic Balance. Lennon O Naraigh *
 Interpolation of gridded data using Geostrophic Balance Lennon O Naraigh * Date: 6 th September 2004 Abstract: In this report, a method of interpolating data from the grid of a global climate model (GCM)
User Guide. Table of Contents How it Works Data & Maps Wind Resource Grid Time Series Reports For More Questions
 User Guide All information in this document is subject to change without notice. This document is provided for informational purposes only and AWS Truepower, a UL company, makes no guarantees, representations
DEVELOPMENT OF A TOOL FOR OFFSHORE WIND RESOURCE ASSESSMENT FOR WIND INDUSTRY
 DEVELOPMENT OF A TOOL FOR OFFSHORE WIND RESOURCE ASSESSMENT FOR WIND INDUSTRY Alberto Rabaneda Dr. Matthew Stickland University of Strathclyde Mechanical and Aerospace Engineering Department Wind resource
Global Soil Wetness Project Phase 3 Atmospheric Boundary Conditions (Experiment
 Global Soil Wetness Project Phase 3 Atmospheric Boundary Conditions (Experiment 1) 1. IDENTIFICATION INFORMATION Edition Version 1 Abbreviation DOI Metadata Identifier 2. CONTACT Global Soil Wetness Project
Introduction to Objective Analysis
 Chapter 4 Introduction to Objective Analysis Atmospheric data are routinely collected around the world but observation sites are located rather randomly from a spatial perspective. On the other hand, most
Two strategies for the mitigation of coordinate singularities of a spherical polyhedral grid
 Two strategies for the mitigation of coordinate singularities of a spherical polyhedral grid R. James Purser, Miodrag Rancic, Dusan Jovic IMSG at NOAA/NCEP/EMC, College Park, and Dragan Latinovic CPTEC,
Training i Course Remote Sensing Basic Theory & Image Processing Methods September 2011
 Training i Course Remote Sensing Basic Theory & Image Processing Methods 19 23 September 2011 Geometric Operations Michiel Damen (September 2011) damen@itc.nl ITC FACULTY OF GEO-INFORMATION SCIENCE AND
WRF-NMM Standard Initialization (SI) Matthew Pyle 8 August 2006
 Matthew Pyle 8 August 2006") WRF-NMM Standard Initialization (SI) Matthew Pyle 8 August 2006 1 Outline Overview of the WRF-NMM Standard Initialization (SI) package. More detailed look at individual SI program components. SI software
WRF-NMM Standard Initialization (SI) Matthew Pyle 8 August 2006 1 Outline Overview of the WRF-NMM Standard Initialization (SI) package. More detailed look at individual SI program components. SI software
REQUEST FOR A SPECIAL PROJECT
 REQUEST FOR A SPECIAL PROJECT 2018 2020 MEMBER STATE: Germany, Greece, Italy This form needs to be submitted via the relevant National Meteorological Service. Principal Investigator 1 Amalia Iriza (NMA,Romania)
QUALITY CONTROL FOR UNMANNED METEOROLOGICAL STATIONS IN MALAYSIAN METEOROLOGICAL DEPARTMENT
 QUALITY CONTROL FOR UNMANNED METEOROLOGICAL STATIONS IN MALAYSIAN METEOROLOGICAL DEPARTMENT By Wan Mohd. Nazri Wan Daud Malaysian Meteorological Department, Jalan Sultan, 46667 Petaling Jaya, Selangor,
A ONE-STOP SERVICE HUB INTEGRATING ESSENTIAL WEATHER AND GEOPHYSICAL INFORMATION ON A GIS PLATFORM. Hong Kong Observatory
 A ONE-STOP SERVICE HUB INTEGRATING ESSENTIAL WEATHER AND GEOPHYSICAL INFORMATION ON A GIS PLATFORM Hong Kong Observatory Mission HONG KONG OBSERVATORY To provide people-oriented quality services in meteorology
Application of ray-tracing through the high resolution numerical weather model HIRLAM for the analysis of European VLBI data
 Application of ray-tracing through the high resolution numerical weather model HIRLAM for the analysis of European VLBI data Susana Garcia-Espada(1,2) Rüdiger Haas(2) Francisco Colomer(1) (1) Instituto
Blacksburg, VA July 24 th 30 th, 2010 Georeferencing images and scanned maps Page 1. Georeference
 George McLeod Prepared by: With support from: NSF DUE-0903270 in partnership with: Geospatial Technician Education Through Virginia s Community Colleges (GTEVCC) Georeference The process of defining how
Ecography. Supplementary material
 Ecography ECOG-03031 Fordham, D. A., Saltré, F., Haythorne, S., Wigley, T. M. L., Otto-Bliesner, B. L., Chan, K. C. and Brooks, B. W. 2017. PaleoView: a tool for generating continuous climate projections
First experiences of using WC(P)S at ECMWF
S at ECMWF") Earth Server-2 First experiences of using WC(P)S at ECMWF Julia Wagemann and Stephan Siemen European Centre for Medium-Range Weather Forecasts Workshop on Meteorological Operational Systems #OpenDataWeek
Earth Server-2 First experiences of using WC(P)S at ECMWF Julia Wagemann and Stephan Siemen European Centre for Medium-Range Weather Forecasts Workshop on Meteorological Operational Systems #OpenDataWeek
Supplemental Material Deep Fluids: A Generative Network for Parameterized Fluid Simulations
 Supplemental Material Deep Fluids: A Generative Network for Parameterized Fluid Simulations 1. Extended Results 1.1. 2-D Smoke Plume Additional results for the 2-D smoke plume example are shown in Figures
Paralleliza(on Challenges for Ensemble Data Assimila(on
 Paralleliza(on Challenges for Ensemble Data Assimila(on Helen Kershaw Institute for Mathematics Applied to Geophysics, National Center for Atmospheric Research Email: hkershaw@ucar.edu What am I going
Clouds in global models are variable
 Clouds in global models are variable There s explicit variability within grid columns: Vertical structure ( overlap ) + fractional cloudiness = internally variable columns Let s take a look at how overlap
Manual MARS web viewer
 Manual MARS web viewer 08 July 2010 Document Change Log Issue Date Description of changes 0.1 03-FEB-2009 Initial version 0.2 13-MAR-2009 Manual for viewer version 16-3-2009 1.0 20-MAY-2009 Manual for
Wireless Solution by v2.01
 9-52 Ashihara-cho, Nisinomiya, 662-8580, Japan Phone: +81 (0)798 63-1071 / Fax: +81 (0)798 65-4200, 66-4622 www.furuno.co.jp Sales Bulletin Attention : All Furuno Distributors/Subsidiaries Date : July
NEXTMap World 30 Digital Surface Model
 NEXTMap World 30 Digital Surface Model Intermap Technologies, Inc. 8310 South Valley Highway, Suite 400 Englewood, CO 80112 083013v3 NEXTMap World 30 (top) provides an improvement in vertical accuracy
Remote Sensing in an
 Chapter 2: Adding Data to a Map Document Remote Sensing in an ArcMap Environment Remote Sensing Analysis in an ArcMap Environment Tammy E. Parece Image source: landsat.usgs.gov Tammy Parece James Campbell
Edges, interpolation, templates. Nuno Vasconcelos ECE Department, UCSD (with thanks to David Forsyth)
") Edges, interpolation, templates Nuno Vasconcelos ECE Department, UCSD (with thanks to David Forsyth) Gradients and edges edges are points of large gradient magnitude edge detection strategy 1. determine
Edges, interpolation, templates Nuno Vasconcelos ECE Department, UCSD (with thanks to David Forsyth) Gradients and edges edges are points of large gradient magnitude edge detection strategy 1. determine
Variability in Annual Temperature Profiles
 Variability in Annual Temperature Profiles A Multivariate Spatial Analysis of Regional Climate Model Output Tamara Greasby, Stephan Sain Institute for Mathematics Applied to Geosciences, National Center
Beate Klinger and Torsten Mayer-Gürr Institute of Geodesy NAWI Graz, Graz University of Technology
 and Torsten Mayer-Gürr Institute of Geodesy NAWI Graz, Graz University of Technology Outline Motivation GRACE Preprocessing GRACE sensor fusion Accelerometer simulation & calibration Impact on monthly
Induction zone measurements and simulations at Perdigão. Alexander Meyer Forsting, Niels Troldborg, Andreas Bechmann, Nikolas Angelou
 Induction zone measurements and simulations at Perdigão Alexander Meyer Forsting, Niels Troldborg, Andreas Bechmann, Nikolas Angelou Overview The induction zone Power curve measurements The UniTTe project
ALADIN-2007-Oslo (Norway) April 2007
 April 2007") Improving the SURFEX/TEB scheme: 1 D validation in a street canyon R. Hamdi and V. Masson SURFEX coupled off line to ALADIN: preliminary results over Belgium R. Hamdi and A. Deckmyn ALADIN-2007-Oslo (Norway)
Improving the SURFEX/TEB scheme: 1 D validation in a street canyon R. Hamdi and V. Masson SURFEX coupled off line to ALADIN: preliminary results over Belgium R. Hamdi and A. Deckmyn ALADIN-2007-Oslo (Norway)
A FAST METHOD FOR SCALING COLOR IMAGES
 7th European Signal Processing Conference (EUSIPCO 9) Glasgow, Scotland, August 4-8, 9 A FAST METHOD FOR SCALING COLOR IMAGES Jaana Parkkinen, Mikko Haukijärvi, Petri Nenonen Nokia Corporation P.O. Bo,
A Real-time Algorithm for Atmospheric Turbulence Correction
 Logic Fruit Technologies White Paper 806, 8 th Floor, BPTP Park Centra, Sector 30, Gurgaon. Pin: 122001 T: +91-124-4117336 W: http://www.logic-fruit.com A Real-time Algorithm for Atmospheric Turbulence
Rendering Smoke & Clouds
 Rendering Smoke & Clouds Game Design Seminar 2007 Jürgen Treml Talk Overview 1. Introduction to Clouds 2. Virtual Clouds based on physical Models 1. Generating Clouds 2. Rendering Clouds using Volume Rendering
Using Hierarchical Warp Stereo for Topography. Introduction
 Using Hierarchical Warp Stereo for Topography Dr. Daniel Filiberti ECE/OPTI 531 Image Processing Lab for Remote Sensing Introduction Topography from Stereo Given a set of stereoscopic imagery, two perspective
A GLOBAL BACKSCATTER MODEL FOR C-BAND SAR
 A GLOBAL BACKSCATTER MODEL FOR C-BAND SAR Daniel Sabel (1), Marcela Doubková (1), Wolfgang Wagner (1), Paul Snoeij (2), Evert Attema (2) (1) Vienna University of Technology, Institute of Photogrammetry
Image Processing and Analysis
 Image Processing and Analysis 3 stages: Image Restoration - correcting errors and distortion. Warping and correcting systematic distortion related to viewing geometry Correcting "drop outs", striping and
Lab 10: Raster Analyses
 Lab 10: Raster Analyses What You ll Learn: Spatial analysis and modeling with raster data. You will estimate the access costs for all points on a landscape, based on slope and distance to roads. You ll
HPC Performance Advances for Existing US Navy NWP Systems
 HPC Performance Advances for Existing US Navy NWP Systems Timothy Whitcomb, Kevin Viner Naval Research Laboratory Marine Meteorology Division Monterey, CA Matthew Turner DeVine Consulting, Monterey, CA
Three-Dimensional Oceanic Flows from Eulerian Velocity Data
 Second-year Ph.D. student, Applied Math and Scientific Computing Project Advisor: Kayo Ide Department of Atmospheric and Oceanic Science Center for Scientific Computation and Mathematical Modeling Earth
PC-Cluster Operation Manual
 PC-Cluster Operation Manual 1. Start PC-Cluster 1.1. Power ON (1) Confirm power cables Connected OUTLET AVR UPS PC-Cluster (2) Switch ON AVR Switch ON (3) Switch ON UPS Switch ON PC-Cluster Operation Manual
Creating Surfaces. Steve Kopp Steve Lynch
 Steve Kopp Steve Lynch Overview Learn the types of surfaces and the data structures used to store them Emphasis on surface interpolation Learn the interpolation workflow Understand how interpolators work
IR Performance Surfaces
 IR Performance Surfaces WIDA 14 March 2012 Mr. Christian Borden-AER Dr. Guy Seeley-AER Mr. Steven Lowe-AER Dr. Andreas Goroch-NRL 1 Outline Typical IR Sensor Performance Products Performance Surfaces Current
DECONFLICTION AND SURFACE GENERATION FROM BATHYMETRY DATA USING LR B- SPLINES
 DECONFLICTION AND SURFACE GENERATION FROM BATHYMETRY DATA USING LR B- SPLINES IQMULUS WORKSHOP BERGEN, SEPTEMBER 21, 2016 Vibeke Skytt, SINTEF Jennifer Herbert, HR Wallingford The research leading to these
About the SPEEDY model (from Miyoshi PhD Thesis):
:") SPEEDY EXPERIMENTS. About the SPEEDY model (from Miyoshi PhD Thesis): The SPEEDY model (Molteni 2003) is a recently developed atmospheric general circulation model (AGCM) with a spectral primitive-equation
SPEEDY EXPERIMENTS. About the SPEEDY model (from Miyoshi PhD Thesis): The SPEEDY model (Molteni 2003) is a recently developed atmospheric general circulation model (AGCM) with a spectral primitive-equation
Sensitivity of resolved and parameterized surface drag to changes in resolution and parameterization
 Sensitivity of resolved and parameterized surface drag to changes in resolution and parameterization Annelize van Niekerk Ted Shepherd With thanks to: Simon Vosper, Stuart Webster, Andy Elvidge, Irina
BODY / SYSTEM Specifically, the website consists of the following pages:
 GULF OF MEXICO MODELING SYSTEM WEBSITE http://www7330.nrlssc.navy.mil/gomms/index.html R. Holladay*, S. Holladay*, S. derada Naval Research Laboratory, Stennis Space Center, MS, USA *Student Intern SUMMARY
National Offshore Wind Energy Resource and Design Data Campaign Analysis and Collaboration
 Workshop on Offshore Wind Energy Standards & Guidelines June 2014, Arlington, VA National Offshore Wind Energy Resource and Design Data Campaign Analysis and Collaboration Bruce H. Bailey, PhD, CCM President/CEO
Estimation of Evapotranspiration Over South Florida Using Remote Sensing Data. Shafiqul Islam Le Jiang Elfatih Eltahir
 Estimation of Evapotranspiration Over South Florida Using Remote Sensing Data Shafiqul Islam Le Jiang Elfatih Eltahir Outline Introduction Proposed methodology Step-by by-step procedure Demonstration of
Enabling Legacy Applications on Service Grids. Asvija B, C-DAC, Bangalore
 Enabling Legacy Applications on Service Grids Asvija B, C-DAC, 1 Legacy Applications Service enablement of existing legacy applications is difficult No source code available Proprietary code fragments
Decision Support for Extreme Weather Impacts on Critical Infrastructure
 Decision Support for Extreme Weather Impacts on Critical Infrastructure B. W. Bush Energy & Infrastructure Analysis Group Los Alamos National Laboratory Research Applications Laboratory and Computational
Version 3 Updated: 10 March Distributed Oceanographic Match-up Service (DOMS) User Interface Design
 User Interface Design") Distributed Oceanographic Match-up Service (DOMS) User Interface Design Shawn R. Smith 1, Jocelyn Elya 1, Adam Stallard 1, Thomas Huang 2, Vardis Tsontos 2, Benjamin Holt 2, Steven Worley 3, Zaihua Ji
Distributed Oceanographic Match-up Service (DOMS) User Interface Design Shawn R. Smith 1, Jocelyn Elya 1, Adam Stallard 1, Thomas Huang 2, Vardis Tsontos 2, Benjamin Holt 2, Steven Worley 3, Zaihua Ji
DATA MODELS IN GIS. Prachi Misra Sahoo I.A.S.R.I., New Delhi
 DATA MODELS IN GIS Prachi Misra Sahoo I.A.S.R.I., New Delhi -110012 1. Introduction GIS depicts the real world through models involving geometry, attributes, relations, and data quality. Here the realization
Watershed Sciences 4930 & 6920 GEOGRAPHIC INFORMATION SYSTEMS
 HOUSEKEEPING Watershed Sciences 4930 & 6920 GEOGRAPHIC INFORMATION SYSTEMS CONTOURS! Self-Paced Lab Due Friday! WEEK SIX Lecture RASTER ANALYSES Joe Wheaton YOUR EXCERCISE Integer Elevations Rounded up
Isophote-Based Interpolation
 Isophote-Based Interpolation Bryan S. Morse and Duane Schwartzwald Department of Computer Science, Brigham Young University 3361 TMCB, Provo, UT 84602 {morse,duane}@cs.byu.edu Abstract Standard methods
Technical English -I 5 th week SURVEYING AND MAPPING
 Technical English -I 5 th week SURVEYING AND MAPPING What is surveying? It is the art of defining the positions of natural and man-made made features on the Earth s surface. Basic Tasks and Features in
KAshima RAy-Tracing Service (KARATS)
") KAshima RAy-Tracing Service (KARATS) Fast ray-tracing algorithms through numerical weather models for real-time positioning applications in East Asia T. Hobiger, R. Ichikawa, Y. Koyama, T. Kondo Overview
KAshima RAy-Tracing Service (KARATS) Fast ray-tracing algorithms through numerical weather models for real-time positioning applications in East Asia T. Hobiger, R. Ichikawa, Y. Koyama, T. Kondo Overview
In order to minimize the impact of rain, snow, ice and solar radiation on the measurement the EE33-M must be mounted inside a radiation shield.
 Humidity and Temperature Transmitter for High-end Meteorological Applications E33-M is optimized for reliable measurement under demanding weather conditions. Besides accurate measurement of relative humidity
L7 Raster Algorithms
 L7 Raster Algorithms NGEN6(TEK23) Algorithms in Geographical Information Systems by: Abdulghani Hasan, updated Nov 216 by Per-Ola Olsson Background Store and analyze the geographic information: Raster
The Regional Climate Model Evalua4on System (RCMES): Introduc4on and Demonstra4on
: Introduc4on and Demonstra4on") The Regional Climate Model Evalua4on System (RCMES): Introduc4on and Demonstra4on Paul C. Loikith, Duane E. Waliser, Chris MaEmann, Jinwon Kim, Huikyo Lee, Paul M. Ramirez, Andrew F. Hart, Cameron E. Goodale,
The Regional Climate Model Evalua4on System (RCMES): Introduc4on and Demonstra4on Paul C. Loikith, Duane E. Waliser, Chris MaEmann, Jinwon Kim, Huikyo Lee, Paul M. Ramirez, Andrew F. Hart, Cameron E. Goodale,
Sampling and Reconstruction
 Sampling and Reconstruction Sampling and Reconstruction Sampling and Spatial Resolution Spatial Aliasing Problem: Spatial aliasing is insufficient sampling of data along the space axis, which occurs because
Towards a Lower Helicopter Noise Interference in Human Life
 Towards a Lower Helicopter Noise Interference in Human Life Fausto Cenedese Acoustics and Vibration Department AGUSTA, Via G. Agusta 520, 21017 Cascina Costa (VA), Italy Noise Regulation Workshop September
SES 123 Global and Regional Energy Lab Procedures
 SES 123 Global and Regional Energy Lab Procedures Introduction An important aspect to understand about our planet is global temperatures, including spatial variations, such as between oceans and continents
Advanced Numerical Methods for Numerical Weather Prediction
 Advanced Numerical Methods for Numerical Weather Prediction Francis X. Giraldo Naval Research Laboratory Monterey, CA 93943-5502 phone: (831) 656-4882 fax: (831) 656-4769 e-mail: giraldo@nrlmry.navy.mil
methods for resizing medical images for tablets
 Retina Visual Interpretation Displays: Image with Three-Dimensional interpolation Annotations (VITA) : Open source automated 3D visual summary application using AIM (Annotation Imaging Markup) tablets
McIDAS-V Tutorial Displaying Gridded Data updated January 2016 (software version 1.5)
") McIDAS-V Tutorial Displaying Gridded Data updated January 2016 (software version 1.5) McIDAS-V is a free, open source, visualization and data analysis software package that is the next generation in SSEC's
McIDAS-V Tutorial Displaying Gridded Data updated January 2016 (software version 1.5) McIDAS-V is a free, open source, visualization and data analysis software package that is the next generation in SSEC's
PSI Precision, accuracy and validation aspects
 PSI Precision, accuracy and validation aspects Urs Wegmüller Charles Werner Gamma Remote Sensing AG, Gümligen, Switzerland, wegmuller@gamma-rs.ch Contents Aim is to obtain a deeper understanding of what
Climate model-based probabilistic wind risk assessment under future climate
 Climate model-based probabilistic wind risk assessment under future climate Kazuyoshi Nishijima Associate Professor of Engineering Decision Analysis CERDA CERDA Areas and current focuses Structural reliability
Each of these methods is described in detail in the following chapters.
 1.2 Interpolation of meteorological input data WaSiM-ETH provides various methods to interpolate input data with a sparse spatial resolution to the model grid resolution. Usually, input data are given
RAL IASI MetOp-A TIR Methane Dataset User Guide. Reference : RAL_IASI_TIR_CH4_PUG Version : 1.0 Page Date : 17 Aug /12.
 Date : 17 Aug 2016 1/12 Prepared by : D.Knappett Date: 17/08/2016 Date : 17 Aug 2016 2/12 Table of Contents Change Log... 3 Acronyms... 3 1 Introduction... 4 1.1 Purpose and Scope... 4 1.2 Background...
M.Sc. in Computational Science. Fundamentals of Atmospheric Modelling
 M.Sc. in Computational Science Fundamentals of Atmospheric Modelling Peter Lynch, Met Éireann Mathematical Computation Laboratory (Opp. Room 30) Dept. of Maths. Physics, UCD, Belfield. January April, 2004.
Measuring Turbulence with Lidars
 Measuring Turbulence with Lidars Experiences from the Technical University of Denmark, Wind Energy Department A. Sathe DTU Wind Energy Outline Introduction 2 Risø DTU Lidar Turbulence 28.5.215 Outline
KAshima RAy-Tracing Service (KARATS)
") KAshima RAy-Tracing Service (KARATS) Fast ray-tracing through numerical weather models for real-time positioning applications ホビガートーマス 市川隆一 小山泰弘 近藤哲朗 第 6 回 IVS 技術開発センターシンポジウム 平成 19 年 3 月 9 日 Overview 1.
KAshima RAy-Tracing Service (KARATS) Fast ray-tracing through numerical weather models for real-time positioning applications ホビガートーマス 市川隆一 小山泰弘 近藤哲朗 第 6 回 IVS 技術開発センターシンポジウム 平成 19 年 3 月 9 日 Overview 1.
PARAMETERIZATION OF DRAG FORCES IN URBAN CANOPY MODELS USING MICROSCALE-CFD MODELS FOR DIFFERENT WIND DIRECTIONS
 PARAMETERIZATION OF DRAG FORCES IN URBAN CANOPY MODELS USING MICROSCALE-CFD MODELS FOR DIFFERENT WIND DIRECTIONS J. L. Santiago 1, O. Coceal 2 and A. Martilli 1 1 Atmospheric Pollution Division, Environmental
McIDAS-V Tutorial Displaying Gridded Data updated June 2015 (software version 1.5)
") McIDAS-V Tutorial Displaying Gridded Data updated June 2015 (software version 1.5) McIDAS-V is a free, open source, visualization and data analysis software package that is the next generation in SSEC's
McIDAS-V Tutorial Displaying Gridded Data updated June 2015 (software version 1.5) McIDAS-V is a free, open source, visualization and data analysis software package that is the next generation in SSEC's
ECMWF contribution to the SMOS mission
 contribution to the SMOS mission J. Muñoz Sabater, P. de Rosnay, M. Drusch & G. Balsamo Monitoring Assimilation Remote Sensing and Modeling of Surface Properties 09-11 June 2009 slide 1 Outline Global
Downscaling tools for adapting climate predictions to the user's needs: Challenges for their integration into climate services
 Downscaling tools for adapting climate predictions to the user's needs: Challenges for their integration into climate services A.S. Cofiño, J.M. Gutiérrez, J. Fernández, J. Bedia, M. Vega, S. Herrera,
Introduction to Image Super-resolution. Presenter: Kevin Su
 Introduction to Image Super-resolution Presenter: Kevin Su References 1. S.C. Park, M.K. Park, and M.G. KANG, Super-Resolution Image Reconstruction: A Technical Overview, IEEE Signal Processing Magazine,
Images Reconstruction using an iterative SOM based algorithm.
 Images Reconstruction using an iterative SOM based algorithm. M.Jouini 1, S.Thiria 2 and M.Crépon 3 * 1- LOCEAN, MMSA team, CNAM University, Paris, France 2- LOCEAN, MMSA team, UVSQ University Paris, France
Watershed Sciences 4930 & 6920 GEOGRAPHIC INFORMATION SYSTEMS
 HOUSEKEEPING Watershed Sciences 4930 & 6920 GEOGRAPHIC INFORMATION SYSTEMS Quizzes Lab 8? WEEK EIGHT Lecture INTERPOLATION & SPATIAL ESTIMATION Joe Wheaton READING FOR TODAY WHAT CAN WE COLLECT AT POINTS?
The descriptions of the elements and measures are based on Annex D of ISO/DIS Geographic information Data quality.
 7 Data quality This chapter includes a description of the data quality elements and sub-elements as well as the corresponding data quality measures that should be used to evaluate and document data quality
Accuracy Assessment of Ames Stereo Pipeline Derived DEMs Using a Weighted Spatial Dependence Model
 Accuracy Assessment of Ames Stereo Pipeline Derived DEMs Using a Weighted Spatial Dependence Model Intro Problem Statement A successful lunar mission requires accurate, high resolution data products to
Geometric Accuracy Evaluation, DEM Generation and Validation for SPOT-5 Level 1B Stereo Scene
 Geometric Accuracy Evaluation, DEM Generation and Validation for SPOT-5 Level 1B Stereo Scene Buyuksalih, G.*, Oruc, M.*, Topan, H.*,.*, Jacobsen, K.** * Karaelmas University Zonguldak, Turkey **University
Tuning an Algorithm for Identifying and Tracking Cells
 Tuning an Algorithm for Identifying and Tracking Cells VA L L I A P PA L A K S H M A N A N N AT I O N A L S E V E R E S T O R M S L A B O R AT O R Y / U N I V E R S I T Y O F O K L A H O M A J U LY, 2
SOLWEIG1D. User Manual - Version 2015a. Date: Fredrik Lindberg Göteborg Urban Climate Group, University of Gothenburg
 Göteborg Urban Climate Group Department of Earth Sciences University of Gothenburg SOLWEIG1D User Manual - Version 2015a Date: 2015 06 17 Fredrik Lindberg Göteborg Urban Climate Group, University of Gothenburg
Sampling, Aliasing, & Mipmaps
 Sampling, Aliasing, & Mipmaps Last Time? Monte-Carlo Integration Importance Sampling Ray Tracing vs. Path Tracing source hemisphere What is a Pixel? Sampling & Reconstruction Filters in Computer Graphics
Sampling, Aliasing, & Mipmaps
 Last Time? Sampling, Aliasing, & Mipmaps 2D Texture Mapping Perspective Correct Interpolation Common Texture Coordinate Projections Bump Mapping Displacement Mapping Environment Mapping Texture Maps for
Regional Cooperation for Limited Area Modeling in Central Europe. Dynamics in LACE. Petra Smolíková thanks to many colleagues
 Dynamics in LACE Petra Smolíková thanks to many colleagues Outline 1 1. VFE NH Design of vertical finite elements scheme for NH version of the model 2. SL scheme Application of ENO technique to SL interpolations
inter.noise 2000 The 29th International Congress and Exhibition on Noise Control Engineering August 2000, Nice, FRANCE
 Copyright SFA - InterNoise 2000 1 inter.noise 2000 The 29th International Congress and Exhibition on Noise Control Engineering 27-30 August 2000, Nice, FRANCE I-INCE Classification: 2.4 NORD 2000. STATE-OF-THE-ART
Scalar Visualization
 Scalar Visualization 5-1 Motivation Visualizing scalar data is frequently encountered in science, engineering, and medicine, but also in daily life. Recalling from earlier, scalar datasets, or scalar fields,
GEOG 4110/5100 Advanced Remote Sensing Lecture 4
 GEOG 4110/5100 Advanced Remote Sensing Lecture 4 Geometric Distortion Relevant Reading: Richards, Sections 2.11-2.17 Geometric Distortion Geometric Distortion: Errors in image geometry, (location, dimensions,
(Towards) A metadata model for atmospheric data resources
 A metadata model for atmospheric data resources") (Towards) A metadata model for atmospheric data resources Anne De Rudder and Jean-Christopher Lambert Belgian Institute for Space Aeronomy (IASB-BIRA), Brussels The context EU FP7 Ground-based atmospheric
(Towards) A metadata model for atmospheric data resources Anne De Rudder and Jean-Christopher Lambert Belgian Institute for Space Aeronomy (IASB-BIRA), Brussels The context EU FP7 Ground-based atmospheric
User Guide for the WegenerNet Data Portal
 User Guide for the WegenerNet Data Portal (v9/18feb2010) The WegenerNet Data Portal provides access to measurement data from the climate stations as well as detailed information about the project. Quality-checked
Terrain Analysis. Using QGIS and SAGA
 Terrain Analysis Using QGIS and SAGA Tutorial ID: IGET_RS_010 This tutorial has been developed by BVIEER as part of the IGET web portal intended to provide easy access to geospatial education. This tutorial
DTM GENERATION FROM RUSSIAN TK-350 SPACE IMAGERY IN THE PC-BASED PHOTOGRAMMETRIC SYSTEM Z-SPACE
 DTM GENERATION FROM RUSSIAN TK-350 SPACE IMAGERY IN THE PC-BASED PHOTOGRAMMETRIC SYSTEM Z-SPACE Alexander SIBIRYAKOV State Research Institute of Aviation Systems (GosNIIAS), Moscow, Russia sibiryakov@mtu-net.ru
RainMachine Touch - User Manual
 RainMachine Touch - User Manual Package Contents... 3 Wiring Diagram... 4 Hardware Installation... 5 First Time Setup... 6 Operation... 7 Creating first program... 7 Zones... 9 Dashboard... 10 How it works...
DHI Metocean Data Portal (MOOD) What is it and what s in it for me!?
 What is it and what s in it for me!?") DHI Metocean Data Portal www.metocean-on-demand.com (MOOD) What is it and what s in it for me!? Patrick Dich Grode (PDG), Senior Metocean Specialist, DK-POT MIKE User Meeting, Rungstedgård, 31 st Oct.
DHI Metocean Data Portal www.metocean-on-demand.com (MOOD) What is it and what s in it for me!? Patrick Dich Grode (PDG), Senior Metocean Specialist, DK-POT MIKE User Meeting, Rungstedgård, 31 st Oct.
Semi-Lagrangian Advection. The Basic Idea. x 1.
 3.2.6. Semi-Lagrangian Advection We have studied the Eulerian leapfrog scheme and found it to be conditionally stable. The criterion for stability was the CFL condition µ c t x 1. For high spatial resolution
Error propagation analysis of XPS and CRTN to help develop a noise mapping data standard
 Error propagation analysis of XPS 31-133 and CRTN to help develop a noise mapping data standard Simon Shilton Acustica Ltd, Trident One, Styal Road, Manchester, United Kingdom, Simon.Shilton@acustica.co.uk
Lecture 21 - Chapter 8 (Raster Analysis, part2)
") GEOL 452/552 - GIS for Geoscientists I Lecture 21 - Chapter 8 (Raster Analysis, part2) Today: Digital Elevation Models (DEMs), Topographic functions (surface analysis): slope, aspect hillshade, viewshed,
GEOL 452/552 - GIS for Geoscientists I Lecture 21 - Chapter 8 (Raster Analysis, part2) Today: Digital Elevation Models (DEMs), Topographic functions (surface analysis): slope, aspect hillshade, viewshed,
WaveNet: A Web-Based Metocean Data Access, Processing and Analysis Tool; Part 4 GLOS/GLCFS Database
 WaveNet: A Web-Based Metocean Data Access, Processing and Analysis Tool; Part 4 GLOS/GLCFS Database by Zeki Demirbilek, Lihwa Lin, and Derek Wilson PURPOSE: This Coastal and Hydraulics Engineering Technical
ERAD Optical flow in radar images. Proceedings of ERAD (2004): c Copernicus GmbH 2004
: c Copernicus GmbH 2004") Proceedings of ERAD (2004): 454 458 c Copernicus GmbH 2004 ERAD 2004 Optical flow in radar images M. Peura and H. Hohti Finnish Meteorological Institute, P.O. Box 503, FIN-00101 Helsinki, Finland Abstract.
Proceedings of ERAD (2004): 454 458 c Copernicus GmbH 2004 ERAD 2004 Optical flow in radar images M. Peura and H. Hohti Finnish Meteorological Institute, P.O. Box 503, FIN-00101 Helsinki, Finland Abstract.