Fondamenti di Informatica Examples: Plotting 2013/06/13
|
|
|
- Ashley Greene
- 6 years ago
- Views:
Transcription


1 Fondamenti di Informatica Examples: Plotting 2013/06/13 Prof. Emiliano Casalicchio


2 Objectives This chapter presents the principles and practice of plotting in the following forms: Basic two-dimensional line plots Two-dimensional parametric plots Three-dimensional line and parametric plots Basic three-dimensional surface plots 1-2
3 Plot Enhancements % Listing Creating a subplot clf x = -2*pi:.05:2*pi; subplot(2,3,1) plot(x, sin(x)) title('1 - sin(x)'); subplot(2,3,2) plot(x, cos(x)) title('2 - cos(x)'); subplot(2,3,3) plot(x, tan(x)) title('3 - tan(x)'); subplot(2,3,4) plot(x, x.^2) title('4 - x^2'); subplot(2,3,5) plot(x, sqrt(x)) title('5 - sqrt(x)'); subplot(2,3,6) plot(x, exp(x)) title('4 - e^x'); 1-3


4 Functions for enhancing plots n axis n colormap n grid on/off n hold on/off n legend n shading n text n title n xlabel n ylabel 4
5 Multiple 2-D Plots % Listing Simple 2-D plots clear clc close all x = linspace(-1.5, 1.5, 30); y1 = x; y2 = x.^2; y3 = x.^3; y4 = x.^4; plot(x,y1,x,y2,x,y3,x,y4) xlabel('x') ylabel('value') title('powers of x') legend({'1','2','3','4'},... 'Location','SouthEast') 1-5
6 Special 2-D Effects % Listing Demonstrating plot options clear clc close all x = linspace(0, 2*pi); subplot(2, 3, 1) plot(x, sin(x)) axis([0 2*pi ]) title('changing Data Range on an Axis') subplot(2, 3, 2) plot(x, sin(x)) hold on plot(x, cos(x)) axis tight title('multiple Plots with hold on') subplot(2, 3, 3) plot(x, sin(x),'-- ) hold on plot(x, cos(x), 'r: ) axis tight title('multiple Plots with hold on') 1-6
7 Special 2-D Effects % Listing Demonstrating plot options % Continued... subplot(2, 3, 4) N = 16; xr = linspace(0, 1, N); yr = xr + rand(1,n) - 0.5; plot(xr, yr, 'r+ ) title('symbols for Real Data') subplot(2, 3, 5) x = 0:0.01:20; y1 = 20*exp(-0.05*x).*sin(x); y2 = 0.8*exp(-0.5*x).*sin(3*x); plotyy(x,y1,x,y2,'plot'); xlabel('zero to 20 \musec. ) title('plotting on the Second Axis') subplot(2, 3, 6) pow = linspace(0, 1); w = 10.^pow; fr = complex(0, w); h = (fr.^ *fr + 7.5)..../ (fr.^ *fr.^3 + 9*fr.^2); loglog(w, abs(h)) title('log - log plots') 1-7
8 Transforming a Circle to an Airfoil % Listing Parametric plots clear clc close all th = linspace(0, 2*pi, 40); r = 1.1; g =.1; cx = sqrt(r^2-g^2) - 1; cy = g; x = r*cos(th) + cx; y = r*sin(th) + cy; plot( x, y, 'r' ) axis equal grid on hold on z = complex(x, y); w = z + 1./z; plot( real(w), imag(w), 'k' ); 1-8
 n pie(y) n polar(th,y) n semilogx(x,y) n semilogy(x,y) 9")
9 2-D plot capabilities n bar(x,y) n barh(x,y) n fill(x,y,n) n hist(x,y) n loglog(x,y) n pie(y) n polar(th,y) n semilogx(x,y) n semilogy(x,y) 9
10 3-D View of a 2-D Plot 1-10
; z3=sin(3.*x); y3=ones(size(x)); y2=y3.")
11 3-D Line plots % Listing % Simple 3-D line plots clear clc close all x=0:0.1:3.*pi; y1=zeros(size(x)); z1=sin(x); z2=sin(2.*x); z3=sin(3.*x); y3=ones(size(x)); y2=y3./2; plot3(x,y1,z1,'r',x,y2,z2,'b',x,y3,z3,'g ) grid on xlabel('x-axis ) ylabel('y-axis ) zlabel('z-axis') 1-11
12 Parametric Line Plots 1-12
13 Parametric Line Plots % Listing Linear parametric 3-D plots clear clc close all subplot(1, 2, 1) theta = 0:0.1:10.*pi; plot3(sin(theta),cos(theta),theta) title('parametric curve based on angle'); grid on 1-13
14 Parametric Line Plots % Listing Linear parametric 3-D plots subplot(1, 2, 2) N = 20; dvx = rand(1, N) % random v changes dvy = rand(1, N) dvz = rand(1, N) vx = cumsum(dvx); % integrate to get v vy = cumsum(dvy); vz = cumsum(dvz); x = cumsum(vx); % integrate to get pos y = cumsum(vy); z = cumsum(vz); plot3(x,y,z) grid on title('all 3 axes varying with parameter t') text(0,0,0,'start'); text(x(n),y(n),z(n),'end'); 1-14
15 Designing a Cube Surface plot 1-15
16 Cube Surfaces 1-16
17 Cube Surfaces % Listing Simple solid cube clear clc close all xx = [ % A-B-C-D-A ] % D-E-F-G-D yy = [ % A-B-C-D-A ] % D-E-F-G-D zz = [ % A-B-C-D-A ] % D-E-F-G-D subplot(1, 2, 1) surf(xx, yy, zz) axis equal shading interp view(-36, 44) axis off 1-17
18 Cube Surfaces xx = [ % P-P-P-P-P % A-B-C-D-A % D-E-F-G-D ] % Q-Q-Q-Q-Q yy = [ % P-P-P-P-P % A-B-C-D-A % D-E-F-G-D ] % Q-Q-Q-Q-Q zz = [ % P-P-P-P-P % A-B-C-D-A % D-E-F-G-D ] % Q-Q-Q-Q-Q subplot(1, 2, 2) surf(xx, yy, zz) axis equal shading interp view(-36, 44) axis off 1-18
19 Simple Surface Plot % Listing Simple surface plot clear clc close all x=-3:3; y = x ; [xx,yy]=meshgrid(x,y); zz=xx.^2 + yy.^2; mesh(xx,yy,zz) axis tight title('z = x^2 + y^2 ) xlabel('x'),ylabel('y'),zlabel('z') 1-19

20 Homework n Completare il capitolo 11 studiando gli altri esempi di plotting 20
21 Compound Surface Plot 1-21

22 Using External Illumination 1-22
23 Designing a Cylinder Plot 1-23

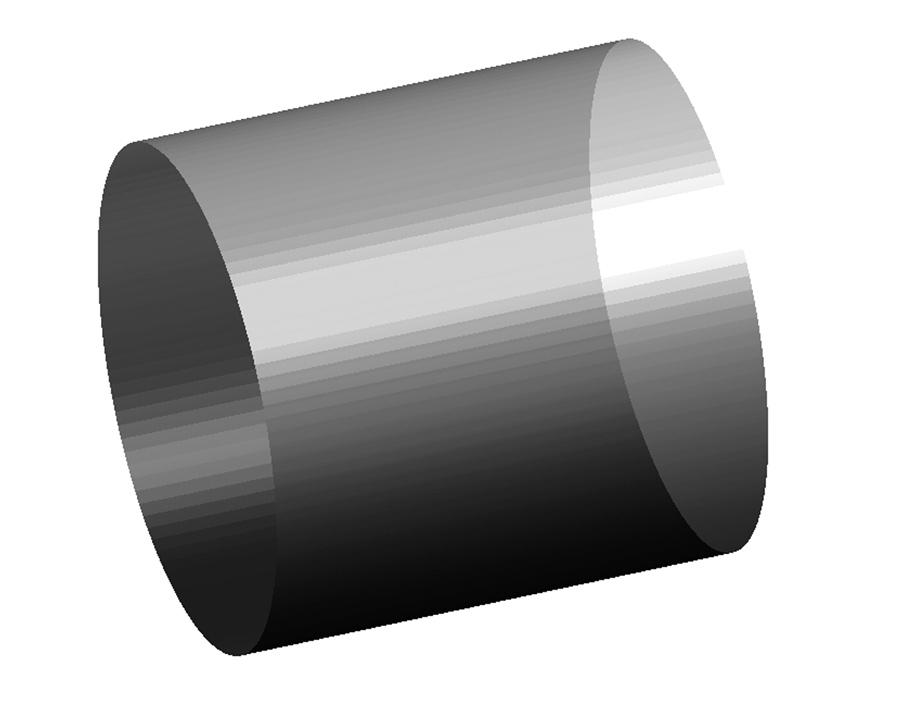
24 Cylinder Plot 1-24

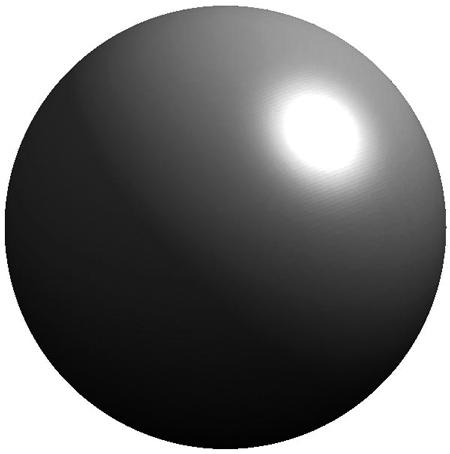
25 Sphere Plot 1-25
26 Rotating About the X Axis 1-26
27 Rotating About the Z Axis 1-27

28 Bodies of Rotation 1-28

29 Rotating Arbitrary Shapes 1-29

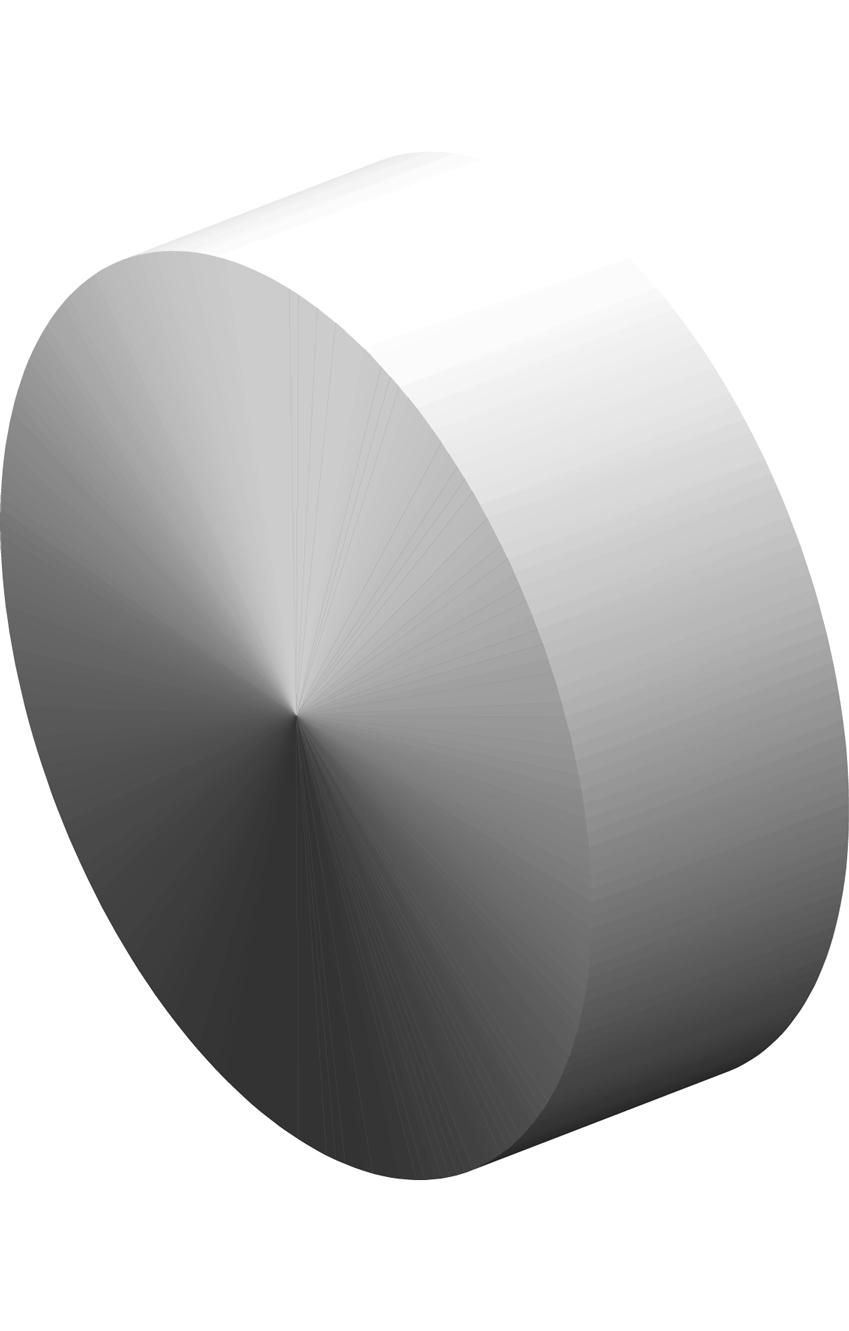
30 A Solid Disk 1-30

31 A Klein Bottle 1-31

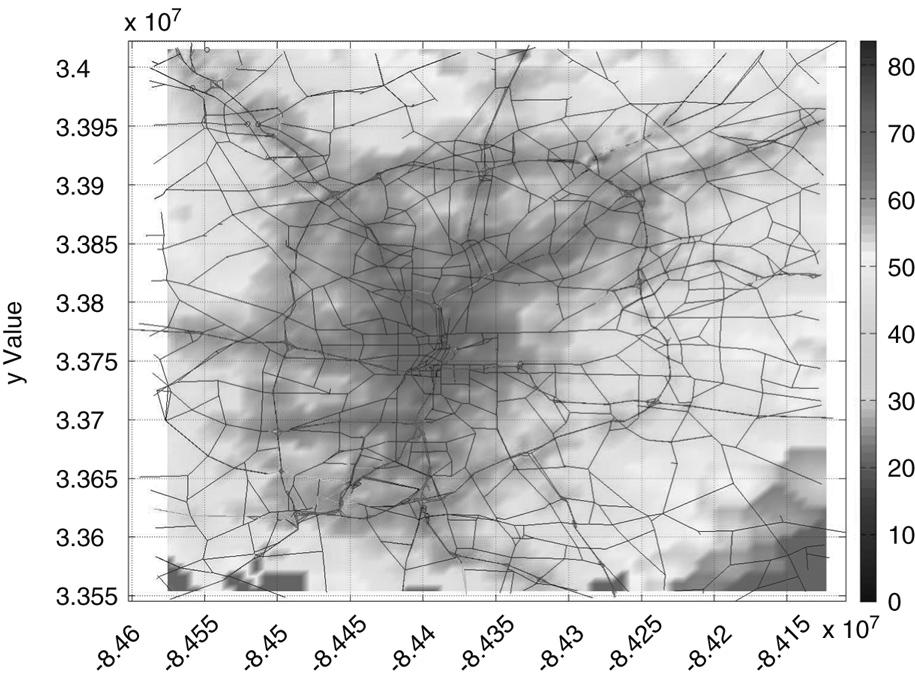
32 Map of Atlanta 1-32
 Basic three-dimensional surface plots are accomplished by building a plaid using meshgrid(x,y),")
33 Summary Basic two-dimensional line plots are accomplished by using plot(x,y Two-dimensional parametric plots are accomplished by using plot(x,y), where both x and y are dependent on another independent variable Three-dimensional line and parametric plots are accomplished by using plot3(x,y,z) Basic three-dimensional surface plots are accomplished by building a plaid using meshgrid(x,y), computing the zz layer as a function of xx and yy, then plotting the surface using mesh(xx, yy, zz) or surf(xx, yy, zz) Parametric surface plots, like parametric line plots, are achieved by building the plaid with two independent variables and making xx, yy, and zz functions of those independent variables Bodies of rotation are a special case of parametric surface plots where one of the independent variables is an angle with values between 0 and
INTRODUCTION TO MATLAB PLOTTING WITH MATLAB
 1 INTRODUCTION TO MATLAB PLOTTING WITH MATLAB Plotting with MATLAB x-y plot Plotting with MATLAB MATLAB contains many powerful functions for easily creating plots of several different types. Command plot(x,y)
Mechanical Engineering Department Second Year (2015)
") Lecture 7: Graphs Basic Plotting MATLAB has extensive facilities for displaying vectors and matrices as graphs, as well as annotating and printing these graphs. This section describes a few of the most
Lecture 7: Graphs Basic Plotting MATLAB has extensive facilities for displaying vectors and matrices as graphs, as well as annotating and printing these graphs. This section describes a few of the most
Plotting - Practice session
 Plotting - Practice session Alessandro Fanfarillo - Salvatore Filippone fanfarillo@ing.uniroma2.it May 28th, 2013 (fanfarillo@ing.uniroma2.it) Plotting May 28th, 2013 1 / 14 Plot function The basic function
Lab of COMP 406 Introduction of Matlab (II) Graphics and Visualization
 Graphics and Visualization") Lab of COMP 406 Introduction of Matlab (II) Graphics and Visualization Teaching Assistant: Pei-Yuan Zhou Contact: cspyzhou@comp.polyu.edu.hk Lab 2: 19 Sep., 2014 1 Review Find the Matlab under the folder
Lab of COMP 406 Introduction of Matlab (II) Graphics and Visualization Teaching Assistant: Pei-Yuan Zhou Contact: cspyzhou@comp.polyu.edu.hk Lab 2: 19 Sep., 2014 1 Review Find the Matlab under the folder
Computing Fundamentals Plotting
 Computing Fundamentals Plotting Salvatore Filippone salvatore.filippone@uniroma2.it 2014 2015 (salvatore.filippone@uniroma2.it) Plotting 2014 2015 1 / 14 Plot function The basic function to plot something
Lecture 6: Plotting in MATLAB
 Lecture 6: Plotting in MATLAB Dr. Mohammed Hawa Electrical Engineering Department University of Jordan EE21: Computer Applications. See Textbook Chapter 5. A picture is worth a thousand words MATLAB allows
Classes 7-8 (4 hours). Graphics in Matlab.
. Graphics in Matlab.") Classes 7-8 (4 hours). Graphics in Matlab. Graphics objects are displayed in a special window that opens with the command figure. At the same time, multiple windows can be opened, each one assigned a number.
Classes 7-8 (4 hours). Graphics in Matlab. Graphics objects are displayed in a special window that opens with the command figure. At the same time, multiple windows can be opened, each one assigned a number.
PROGRAMMING WITH MATLAB WEEK 6
 PROGRAMMING WITH MATLAB WEEK 6 Plot: Syntax: plot(x, y, r.- ) Color Marker Linestyle The line color, marker style and line style can be changed by adding a string argument. to select and delete lines
Plotting x-y (2D) and x, y, z (3D) graphs
 and x, y, z (3D) graphs") Tutorial : 5 Date : 9/08/2016 Plotting x-y (2D) and x, y, z (3D) graphs Aim To learn to produce simple 2-Dimensional x-y and 3-Dimensional (x, y, z) graphs using SCILAB. Exercises: 1. Generate a 2D plot
Tutorial : 5 Date : 9/08/2016 Plotting x-y (2D) and x, y, z (3D) graphs Aim To learn to produce simple 2-Dimensional x-y and 3-Dimensional (x, y, z) graphs using SCILAB. Exercises: 1. Generate a 2D plot
FF505/FY505 Computational Science. MATLAB Graphics. Marco Chiarandini
 FF505/FY505 Computational Science MATLAB Marco Chiarandini (marco@imada.sdu.dk) Department of Mathematics and Computer Science (IMADA) University of Southern Denmark Outline 1. 2D Plots 3D Plots 2 Outline
Math Sciences Computing Center. University ofwashington. September, Fundamentals Making Plots Printing and Saving Graphs...
 Introduction to Plotting with Matlab Math Sciences Computing Center University ofwashington September, 1996 Contents Fundamentals........................................... 1 Making Plots...........................................
Introduction to MATLAB
 Quick Start Tutorial Introduction to MATLAB Hans-Petter Halvorsen, M.Sc. What is MATLAB? MATLAB is a tool for technical computing, computation and visualization in an integrated environment. MATLAB is
PROBLEMS INVOLVING PARAMETERIZED SURFACES AND SURFACES OF REVOLUTION
 PROBLEMS INVOLVING PARAMETERIZED SURFACES AND SURFACES OF REVOLUTION Exercise 7.1 Plot the portion of the parabolic cylinder z = 4 - x^2 that lies in the first octant with 0 y 4. (Use parameters x and
Overview. Lecture 13: Graphics and Visualisation. Graphics & Visualisation 2D plotting. Graphics and visualisation of data in Matlab
 Overview Lecture 13: Graphics and Visualisation Graphics & Visualisation 2D plotting 1. Plots for one or multiple sets of data, logarithmic scale plots 2. Axis control & Annotation 3. Other forms of 2D
Introduction to Matlab
 NDSU Introduction to Matlab pg 1 Becoming familiar with MATLAB The console The editor The graphics windows The help menu Saving your data (diary) Solving N equations with N unknowns Least Squares Curve
YOUR MATLAB ASSIGNMENT 4
 YOUR MATLAB ASSIGNMENT 4 Contents GOAL: USING MATLAB TO SKETCH THE GRAPHS OF A PARAMETERIZED SURFACES IN SPACE USE THE FOLLOWING STEPS: HERE IS AN ACTUAL EXAMPLE OF A CLOSED SURFACE DRAWN PARAMETERICALLY
Computer Programming in MATLAB
 Computer Programming in MATLAB Prof. Dr. İrfan KAYMAZ Engineering Faculty Department of Mechanical Engineering Arrays in MATLAB; Vectors and Matrices Graphing Vector Generation Before graphing plots in
QUICK INTRODUCTION TO MATLAB PART I
 QUICK INTRODUCTION TO MATLAB PART I Department of Mathematics University of Colorado at Colorado Springs General Remarks This worksheet is designed for use with MATLAB version 6.5 or later. Once you have
Introduction to PartSim and Matlab
 NDSU Introduction to PartSim and Matlab pg 1 PartSim: www.partsim.com Introduction to PartSim and Matlab PartSim is a free on-line circuit simulator that we use in Circuits and Electronics. It works fairly
Basic Graphs. Dmitry Adamskiy 16 November 2011
 Basic Graphs Dmitry Adamskiy adamskiy@cs.rhul.ac.uk 16 November 211 1 Plot Function plot(x,y): plots vector Y versus vector X X and Y must have the same size: X = [x1, x2 xn] and Y = [y1, y2,, yn] Broken
What is MATLAB? It is a high-level programming language. for numerical computations for symbolic computations for scientific visualizations
 What is MATLAB? It stands for MATrix LABoratory It is developed by The Mathworks, Inc (http://www.mathworks.com) It is an interactive, integrated, environment for numerical computations for symbolic computations
You can change the line style by adding some information in the plot command within single quotation marks.
 Plotting Continued: You can change the line style by adding some information in the plot command within single quotation marks. y = x.^2; plot(x,y, '-xr') xlabel('x, meters') ylabel('y, meters squared')
A Tutorial on Matlab Ch. 3 Programming in Matlab
 Department of Electrical Engineering University of Arkansas A Tutorial on Matlab Ch. 3 Programming in Matlab Dr. Jingxian Wu wuj@uark.edu OUTLINE 2 Plotting M-file Scripts Functions Control Flows Exercises
AMS 27L LAB #2 Winter 2009
 AMS 27L LAB #2 Winter 2009 Plots and Matrix Algebra in MATLAB Objectives: 1. To practice basic display methods 2. To learn how to program loops 3. To learn how to write m-files 1 Vectors Matlab handles
Introduction to Matlab
 Introduction to Matlab By:Mohammad Sadeghi *Dr. Sajid Gul Khawaja Slides has been used partially to prepare this presentation Outline: What is Matlab? Matlab Screen Basic functions Variables, matrix, indexing
Graphics Example a final product:
 Basic 2D Graphics 1 Graphics Example a final product: TITLE LEGEND YLABEL TEXT or GTEXT CURVES XLABEL 2 2-D Plotting Specify x-data and/or y-data Specify color, line style and marker symbol (Default values
MATLAB Laboratory 09/23/10 Lecture. Chapters 5 and 9: Plotting
 MATLAB Laboratory 09/23/10 Lecture Chapters 5 and 9: Plotting Lisa A. Oberbroeckling Loyola University Maryland loberbroeckling@loyola.edu L. Oberbroeckling (Loyola University) MATLAB 09/23/10 Lecture
PERI INSTITUTE OF TECHNOLOGY DEPARTMENT OF ECE TWO DAYS NATIONAL LEVEL WORKSHOP ON COMMUNICATIONS & IMAGE PROCESSING "CIPM 2017" Matlab Fun - 2
 Table of Contents PERI INSTITUTE OF TECHNOLOGY DEPARTMENT OF ECE TWO DAYS NATIONAL LEVEL WORKSHOP ON COMMUNICATIONS & IMAGE PROCESSING "CIPM 2017" - 2 What? Matlab can be fun... 1 Plot the Sine Function...
The Department of Engineering Science The University of Auckland Welcome to ENGGEN 131 Engineering Computation and Software Development
 The Department of Engineering Science The University of Auckland Welcome to ENGGEN 131 Engineering Computation and Software Development Chapter 7 Graphics Learning outcomes Label your plots Create different
INTERNATIONAL EDITION. MATLAB for Engineers. Third Edition. Holly Moore
 INTERNATIONAL EDITION MATLAB for Engineers Third Edition Holly Moore 5.4 Three-Dimensional Plotting Figure 5.8 Simple mesh created with a single two-dimensional matrix. 5 5 Element,5 5 The code mesh(z)
An Introduction to MATLAB II
 Lab of COMP 319 An Introduction to MATLAB II Lab tutor : Gene Yu Zhao Mailbox: csyuzhao@comp.polyu.edu.hk or genexinvivian@gmail.com Lab 2: 16th Sep, 2013 1 Outline of Lab 2 Review of Lab 1 Matrix in Matlab
Logical Subscripting: This kind of subscripting can be done in one step by specifying the logical operation as the subscripting expression.
 What is the answer? >> Logical Subscripting: This kind of subscripting can be done in one step by specifying the logical operation as the subscripting expression. The finite(x)is true for all finite numerical
Assignment :1. 1 Arithmetic Operations : Compute the following quantities ) -1. and compare with (1-
 -1. and compare with (1-") 1 Arithmetic Operations : Compute the following quantities. 2 5 2 5-1 and compare with (1-1 2 5 ) -1 Assignment :1 5-1 -1. The square root x can be calculated as sqrt(x) or 3 ( 5+1) 2 x^0.5. Area=πr 2
1 Arithmetic Operations : Compute the following quantities. 2 5 2 5-1 and compare with (1-1 2 5 ) -1 Assignment :1 5-1 -1. The square root x can be calculated as sqrt(x) or 3 ( 5+1) 2 x^0.5. Area=πr 2
Lecture 3 for Math 398 Section 952: Graphics in Matlab
 Lecture 3 for Math 398 Section 952: Graphics in Matlab Thomas Shores Department of Math/Stat University of Nebraska Fall 2002 A good deal of this material comes from the text by Desmond Higman and Nicholas
A Brief Introduction to MATLAB
 A Brief Introduction to MATLAB MATLAB (Matrix Laboratory) is an interactive software system for numerical computations and graphics. As the name suggests, MATLAB was first designed for matrix computations:
More on Plots. Dmitry Adamskiy 30 Nov 2011
 More on Plots Dmitry Adamskiy adamskiy@cs.rhul.ac.uk 3 Nov 211 1 plot3 (1) Recall that plot(x,y), plots vector Y versus vector X. plot3(x,y,z), where x, y and z are three vectors of the same length, plots
PSY8219 : Week 6. Homework 5 Due Today. Homework 6 Due October 8. Readings for Today Attaway Chapter 6, 10, and 12
 Homework 5 Due Today PSY8219 : Week 6 Homework 6 Due October 8 Readings for Today Attaway Chapter 6, 10, and 12 Readings for Next Week Attaway Chapter 12 and 13 Turning in Homework Assignments Remember
Programming in Mathematics. Mili I. Shah
 Programming in Mathematics Mili I. Shah Starting Matlab Go to http://www.loyola.edu/moresoftware/ and login with your Loyola name and password... Matlab has eight main windows: Command Window Figure Window
CSE 123. Plots in MATLAB
 CSE 123 Plots in MATLAB Easiest way to plot Syntax: ezplot(fun) ezplot(fun,[min,max]) ezplot(fun2) ezplot(fun2,[xmin,xmax,ymin,ymax]) ezplot(fun) plots the expression fun(x) over the default domain -2pi
Introduction to Matlab
 Introduction to Matlab The purpose of this intro is to show some of Matlab s basic capabilities. Nir Gavish, 2.07 Contents Getting help Matlab development enviroment Variable definitions Mathematical operations
ME 121 MATLAB Lesson 01 Introduction to MATLAB
 1 ME 121 MATLAB Lesson 01 Introduction to MATLAB Learning Objectives Be able run MATLAB in the MCECS computer labs Be able to perform simple interactive calculations Be able to open and view an m-file
This module aims to introduce Precalculus high school students to the basic capabilities of Matlab by using functions. Matlab will be used in
 This module aims to introduce Precalculus high school students to the basic capabilities of Matlab by using functions. Matlab will be used in subsequent modules to help to teach research related concepts
PART 1 PROGRAMMING WITH MATHLAB
 PART 1 PROGRAMMING WITH MATHLAB Presenter: Dr. Zalilah Sharer 2018 School of Chemical and Energy Engineering Universiti Teknologi Malaysia 23 September 2018 Programming with MATHLAB MATLAB Environment
TOPIC 6 Computer application for drawing 2D Graph
 YOGYAKARTA STATE UNIVERSITY MATHEMATICS AND NATURAL SCIENCES FACULTY MATHEMATICS EDUCATION STUDY PROGRAM TOPIC 6 Computer application for drawing 2D Graph Plotting Elementary Functions Suppose we wish
MATLAB Functions and Graphics
 Functions and Graphics We continue our brief overview of by looking at some other areas: Functions: built-in and user defined Using M-files to store and execute statements and functions A brief overview
W1005 Intro to CS and Programming in MATLAB. Plo9ng & Visualiza?on. Fall 2014 Instructor: Ilia Vovsha. hgp://www.cs.columbia.
 W1005 Intro to CS and Programming in MATLAB Plo9ng & Visualiza?on Fall 2014 Instructor: Ilia Vovsha hgp://www.cs.columbia.edu/~vovsha/w1005 Outline Plots (2D) Plot proper?es Figures Plots (3D) 2 2D Plots
MATLAB PROGRAMMING LECTURES. By Sarah Hussein
 MATLAB PROGRAMMING LECTURES By Sarah Hussein Lecture 1: Introduction to MATLAB 1.1Introduction MATLAB is a mathematical and graphical software package with numerical, graphical, and programming capabilities.
Department of Chemical Engineering ChE-101: Approaches to Chemical Engineering Problem Solving MATLAB Tutorial Vb
 Department of Chemical Engineering ChE-101: Approaches to Chemical Engineering Problem Solving MATLAB Tutorial Vb Making Plots with Matlab (last updated 5/29/05 by GGB) Objectives: These tutorials are
Dr. Iyad Jafar. Adapted from the publisher slides
 Computer Applications Lab Lab 6 Plotting Chapter 5 Sections 1,2,3,8 Dr. Iyad Jafar Adapted from the publisher slides Outline xy Plotting Functions Subplots Special Plot Types Three-Dimensional Plotting
1 >> Lecture 4 2 >> 3 >> -- Graphics 4 >> Zheng-Liang Lu 184 / 243
 1 >> Lecture 4 >> 3 >> -- Graphics 4 >> Zheng-Liang Lu 184 / 43 Introduction ˆ Engineers use graphic techniques to make the information easier to understand. ˆ With graphs, it is easy to identify trends,
MATLAB Quick Reference
 MATLAB Quick Reference Operators Matrix Operations Array or Element by Element + Addition - Subtraction * Matrix Multiplication.* Element by Element Multiplication / Right Matrix Division b/ A=bA 1./ Element
GRAPHICS AND VISUALISATION WITH MATLAB
 GRAPHICS AND VISUALISATION WITH MATLAB UNIVERSITY OF SHEFFIELD CiCS DEPARTMENT Des Ryan & Mike Griffiths September 2017 Topics 2D Graphics 3D Graphics Displaying Bit-Mapped Images Graphics with Matlab
Introduction to MATLAB Step by Step Exercise
 Large list of exercise: start doing now! 1 35: Basic (variables, GUI, command window, basic plot, for, if, functions) 36 40: Medium (functions) 41 45: Medium (matrices) 46 51: Medium (plot) 52 55: Medium
Introduction to MATLAB for Numerical Analysis and Mathematical Modeling. Selis Önel, PhD
 Introduction to MATLAB for Numerical Analysis and Mathematical Modeling Selis Önel, PhD Advantages over other programs Contains large number of functions that access numerical libraries (LINPACK, EISPACK)
MATLAB Tutorial. Mohammad Motamed 1. August 28, generates a 3 3 matrix.
 MATLAB Tutorial 1 1 Department of Mathematics and Statistics, The University of New Mexico, Albuquerque, NM 87131 August 28, 2016 Contents: 1. Scalars, Vectors, Matrices... 1 2. Built-in variables, functions,
A Quick Guide to MATLAB
 Appendix C A Quick Guide to MATLAB In this course we will be using the software package MATLAB. The most recent version can be purchased directly from the MATLAB web site: http://www.mathworks.com/academia/student
Introduction to Matlab for Engineers
 Introduction to Matlab for Engineers Instructor: Thai Nhan Math 111, Ohlone, Spring 2016 Introduction to Matlab for Engineers Ohlone, Spring 2016 1/19 Today s lecture 1. The subplot command 2. Logarithmic
Armstrong Atlantic State University Engineering Studies MATLAB Marina 2D Plotting Primer
 Armstrong Atlantic State University Engineering Studies MATLAB Marina D Plotting Primer Prerequisites The D Plotting Primer assumes knowledge of the MATLAB IDE, MATLAB help, arithmetic operations, built
Solving Simultaneous Nonlinear Equations. SELİS ÖNEL, PhD
 Solving Simultaneous Nonlinear Equations SELİS ÖNEL, PhD Quotes of the Day Nothing in the world can take the place of Persistence. Talent will not; nothing is more common than unsuccessful men with talent.
Graphics and plotting techniques
 Davies: Computer Vision, 5 th edition, online materials Matlab Tutorial 5 1 Graphics and plotting techniques 1. Introduction The purpose of this tutorial is to outline the basics of graphics and plotting
Telemark University College Department of Electrical Engineering, Information Technology and Cybernetics. MathScript
 Telemark University College Department of Electrical Engineering, Information Technology and Cybernetics Solutions So You Think You Can HANS-PETTER HALVORSEN, 2011.09.07 MathScript Part I: Introduction
fplot Syntax Description Examples Plot Symbolic Expression Plot symbolic expression or function fplot(f) fplot(f,[xmin xmax])
![fplot Syntax Description Examples Plot Symbolic Expression Plot symbolic expression or function fplot(f) fplot(f,[xmin xmax])](/thumbs/73/69317189.jpg "fplot Syntax Description Examples Plot Symbolic Expression Plot symbolic expression or function fplot(f) fplot(f,[xmin xmax])") fplot Plot symbolic expression or function Syntax fplot(f) fplot(f,[xmin xmax]) fplot(xt,yt) fplot(xt,yt,[tmin tmax]) fplot(,linespec) fplot(,name,value) fplot(ax, ) fp = fplot( ) Description fplot(f)
fplot Plot symbolic expression or function Syntax fplot(f) fplot(f,[xmin xmax]) fplot(xt,yt) fplot(xt,yt,[tmin tmax]) fplot(,linespec) fplot(,name,value) fplot(ax, ) fp = fplot( ) Description fplot(f)
MATLAB Tutorial EE351M DSP. Created: Thursday Jan 25, 2007 Rayyan Jaber. Modified by: Kitaek Bae. Outline
 MATLAB Tutorial EE351M DSP Created: Thursday Jan 25, 2007 Rayyan Jaber Modified by: Kitaek Bae Outline Part I: Introduction and Overview Part II: Matrix manipulations and common functions Part III: Plots
MATLAB Guide to Fibonacci Numbers
 MATLAB Guide to Fibonacci Numbers and the Golden Ratio A Simplified Approach Peter I. Kattan Petra Books www.petrabooks.com Peter I. Kattan, PhD Correspondence about this book may be sent to the author
Due date for the report is 23 May 2007
 Objectives: Learn some basic Matlab commands which help you get comfortable with Matlab.. Learn to use most important command in Matlab: help, lookfor. Data entry in Microsoft excel. 3. Import data into
Introduction to. The Help System. Variable and Memory Management. Matrices Generation. Interactive Calculations. Vectors and Matrices
 Introduction to Interactive Calculations Matlab is interactive, no need to declare variables >> 2+3*4/2 >> V = 50 >> V + 2 >> V Ans = 52 >> a=5e-3; b=1; a+b Most elementary functions and constants are
ENGG1811 Computing for Engineers Week 11 Part C Matlab: 2D and 3D plots
 ENGG1811 Computing for Engineers Week 11 Part C Matlab: 2D and 3D plots ENGG1811 UNSW, CRICOS Provider No: 00098G1 W11 slide 1 More on plotting Matlab has a lot of plotting features Won t go through them
Basic MATLAB Intro III
 Basic MATLAB Intro III Plotting Here is a short example to carry out: >x=[0:.1:pi] >y1=sin(x); y2=sqrt(x); y3 = sin(x).*sqrt(x) >plot(x,y1); At this point, you should see a graph of sine. (If not, go to
workspace list the variables and describe their matrix sizes 4x1 matrix (4 rows, 1 column) x=[3.4, 7, 2.2] 1x3 matrix (1 row, 3 columns)
![workspace list the variables and describe their matrix sizes 4x1 matrix (4 rows, 1 column) x=[3.4, 7, 2.2] 1x3 matrix (1 row, 3 columns)](/thumbs/94/120039995.jpg "workspace list the variables and describe their matrix sizes 4x1 matrix (4 rows, 1 column) x=[3.4, 7, 2.2] 1x3 matrix (1 row, 3 columns)") An Introduction To MATLAB Lecture 3 Basic MATLAB Commands quit exit who whos quits MATLAB quits MATLAB lists all of the variables in your MATLAB workspace list the variables and describe their matrix sizes
An Introduction To MATLAB Lecture 3 Basic MATLAB Commands quit exit who whos quits MATLAB quits MATLAB lists all of the variables in your MATLAB workspace list the variables and describe their matrix sizes
2D LINE PLOTS... 1 The plot() Command... 1 Labeling and Annotating Figures... 5 The subplot() Command... 7 The polarplot() Command...
 Command... 1 Labeling and Annotating Figures... 5 The subplot() Command... 7 The polarplot() Command...") Contents 2D LINE PLOTS... 1 The plot() Command... 1 Labeling and Annotating Figures... 5 The subplot() Command... 7 The polarplot() Command... 9 2D LINE PLOTS One of the benefits of programming in MATLAB
Contents 2D LINE PLOTS... 1 The plot() Command... 1 Labeling and Annotating Figures... 5 The subplot() Command... 7 The polarplot() Command... 9 2D LINE PLOTS One of the benefits of programming in MATLAB
DSP Laboratory (EELE 4110) Lab#1 Introduction to Matlab
 Lab#1 Introduction to Matlab") Islamic University of Gaza Faculty of Engineering Electrical Engineering Department 2012 DSP Laboratory (EELE 4110) Lab#1 Introduction to Matlab Goals for this Lab Assignment: In this lab we would have
Islamic University of Gaza Faculty of Engineering Electrical Engineering Department 2012 DSP Laboratory (EELE 4110) Lab#1 Introduction to Matlab Goals for this Lab Assignment: In this lab we would have
Finding, Starting and Using Matlab
 Variables and Arrays Finding, Starting and Using Matlab CSC March 6 &, 9 Array: A collection of data values organized into rows and columns, and known by a single name. arr(,) Row Row Row Row 4 Col Col
Introduction to Computer Programming with MATLAB Matlab Fundamentals. Selis Önel, PhD
 Introduction to Computer Programming with MATLAB Matlab Fundamentals Selis Önel, PhD Today you will learn to create and execute simple programs in MATLAB the difference between constants, variables and
Introduction to MATLAB: Graphics
 Introduction to MATLAB: Graphics Eduardo Rossi University of Pavia erossi@eco.unipv.it September 2014 Rossi Introduction to MATLAB Financial Econometrics - 2014 1 / 14 2-D Plot The command plot provides
Getting Started with Matlab
 Chapter Getting Started with Matlab The computational examples and exercises in this book have been computed using Matlab, which is an interactive system designed specifically for scientific computation
INC151 Electrical Engineering Software Practice. MATLAB Graphics. Dr.Wanchak Lenwari :Control System and Instrumentation Engineering, KMUTT 1
 INC151 Electrical Engineering Software Practice MATLAB Graphics Dr.Wanchak Lenwari :Control System and Instrumentation Engineering, KMUTT 1 Graphical display is one of MATLAB s greatest strengths and most
PHS3XXX Computational Physics
 1 PHS3XXX Computational Physics Lecturer: Mike Wheatland michael.wheatland@sydney.edu.au Lecture and lab schedule (SNH Learning Studio 4003) 1 There are 10 weeks of lectures and labs Lectures: Mon 9am
Prepared by: Khairul Anuar Ishak Department of Electrical, Electronic & System Engineering Faculty of Engineering Universiti Kebangsaan Malaysia
 MATLAB Tutorial of Fundamental Programming Prepared by: Khairul Anuar Ishak Department of Electrical, Electronic & System Engineering Faculty of Engineering Universiti Kebangsaan Malaysia MATLAB tutorial
Getting Started. Chapter 1. How to Get Matlab. 1.1 Before We Begin Matlab to Accompany Lay s Linear Algebra Text
 Chapter 1 Getting Started How to Get Matlab Matlab physically resides on each of the computers in the Olin Hall labs. See your instructor if you need an account on these machines. If you are going to go
Introduction to MATLAB Practical 1
 Introduction to MATLAB Practical 1 Daniel Carrera November 2016 1 Introduction I believe that the best way to learn Matlab is hands on, and I tried to design this practical that way. I assume no prior
INTRODUCTION TO NUMERICAL ANALYSIS
 INTRODUCTION TO NUMERICAL ANALYSIS Cho, Hyoung Kyu Department of Nuclear Engineering Seoul National University 0. MATLAB USAGE 1. Background MATLAB MATrix LABoratory Mathematical computations, modeling
Computational Methods (PHYS 2030)
") Computational Methods (PHYS 2030) Instructors: Prof. Christopher Bergevin (cberge@yorku.ca) Schedule: Lecture: MWF 11:30-12:30 (CLH M) Website: http://www.yorku.ca/cberge/2030w2018.html York University
Computational Methods (PHYS 2030) Instructors: Prof. Christopher Bergevin (cberge@yorku.ca) Schedule: Lecture: MWF 11:30-12:30 (CLH M) Website: http://www.yorku.ca/cberge/2030w2018.html York University
Prof. Manoochehr Shirzaei. RaTlab.asu.edu
 RaTlab.asu.edu Introduction To MATLAB Introduction To MATLAB This lecture is an introduction of the basic MATLAB commands. We learn; Functions Procedures for naming and saving the user generated files
Introduction to Matlab. WIAA Technical Workshop #2 10/20/2015
 Introduction to Matlab WIAA Technical Workshop #2 10/20/2015 * This presentation is merely an introduction to some of the functions of MATLAB and is not a comprehensive review of their capabilities. **
Introduction to MATLAB
 ELG 3125 - Lab 1 Introduction to MATLAB TA: Chao Wang (cwang103@site.uottawa.ca) 2008 Fall ELG 3125 Signal and System Analysis P. 1 Do You Speak MATLAB? MATLAB - The Language of Technical Computing ELG
MATH 2221A Mathematics Laboratory II
 MATH A Mathematics Laboratory II Lab Assignment 4 Name: Student ID.: In this assignment, you are asked to run MATLAB demos to see MATLAB at work. The color version of this assignment can be found in your
Basic plotting commands Types of plots Customizing plots graphically Specifying color Customizing plots programmatically Exporting figures
 Basic plotting commands Types of plots Customizing plots graphically Specifying color Customizing plots programmatically Exporting figures Matlab is flexible enough to let you quickly visualize data, and
This is a basic tutorial for the MATLAB program which is a high-performance language for technical computing for platforms:
 Appendix A Basic MATLAB Tutorial Extracted from: http://www1.gantep.edu.tr/ bingul/ep375 http://www.mathworks.com/products/matlab A.1 Introduction This is a basic tutorial for the MATLAB program which
Mini-Project System Simulation over AWGN Using BPSK Modulation
 Mini-Project System Simulation over AWGN Using BPSK Modulation Part I: MATLAB Environment Due Date: June 5, 2006. This exercise will guide you to realize the basic operating environment. Some useful instructions
MATLAB Tutorial. Digital Signal Processing. Course Details. Topics. MATLAB Environment. Introduction. Digital Signal Processing (DSP)
") Digital Signal Processing Prof. Nizamettin AYDIN naydin@yildiz.edu.tr naydin@ieee.org http://www.yildiz.edu.tr/~naydin Course Details Course Code : 0113620 Course Name: Digital Signal Processing (Sayısal
Digital Signal Processing Prof. Nizamettin AYDIN naydin@yildiz.edu.tr naydin@ieee.org http://www.yildiz.edu.tr/~naydin Course Details Course Code : 0113620 Course Name: Digital Signal Processing (Sayısal
Interactive Computing with Matlab. Gerald W. Recktenwald Department of Mechanical Engineering Portland State University
 Interactive Computing with Matlab Gerald W. Recktenwald Department of Mechanical Engineering Portland State University gerry@me.pdx.edu Starting Matlab Double click on the Matlab icon, or on unix systems
Spring 2010 Instructor: Michele Merler.
 Spring 2010 Instructor: Michele Merler http://www1.cs.columbia.edu/~mmerler/comsw3101-2.html MATLAB does not use explicit type initialization like other languages Just assign some value to a variable name,
1. Register an account on: using your Oxford address
 1P10a MATLAB 1.1 Introduction MATLAB stands for Matrix Laboratories. It is a tool that provides a graphical interface for numerical and symbolic computation along with a number of data analysis, simulation
UNIVERSITI TEKNIKAL MALAYSIA MELAKA FAKULTI KEJURUTERAAN ELEKTRONIK DAN KEJURUTERAAN KOMPUTER
 UNIVERSITI TEKNIKAL MALAYSIA MELAKA FAKULTI KEJURUTERAAN ELEKTRONIK DAN KEJURUTERAAN KOMPUTER FAKULTI KEJURUTERAAN ELEKTRONIK DAN KEJURUTERAAN KOMPUTER BENC 2113 DENC ECADD 2532 ECADD LAB SESSION 6/7 LAB
Introduction to Matlab to Accompany Linear Algebra. Douglas Hundley Department of Mathematics and Statistics Whitman College
 Introduction to Matlab to Accompany Linear Algebra Douglas Hundley Department of Mathematics and Statistics Whitman College August 27, 2018 2 Contents 1 Getting Started 5 1.1 Before We Begin........................................
Part #6. A0B17MTB Matlab. Miloslav Čapek Filip Kozák, Viktor Adler, Pavel Valtr
 A0B17MTB Matlab Part #6 Miloslav Čapek miloslav.capek@fel.cvut.cz Filip Kozák, Viktor Adler, Pavel Valtr Department of Electromagnetic Field B2-626, Prague Learning how to Visualizing in Matlab #1 Debugging
Topic 2a MATLAB Introduction & Graphics
 Course Instructor Dr. Raymond C. Rumpf Office: A 337 Phone: (915) 747 6958 E Mail: rcrumpf@utep.edu Topic 2a MATLAB Introduction & Graphics EE 4386/5301 Computational Methods in EE Outline MATLAB Figures
GUI Alternatives. Syntax. Description. MATLAB Function Reference plot. 2-D line plot
 MATLAB Function Reference plot 2-D line plot GUI Alternatives Use the Plot Selector to graph selected variables in the Workspace Browser and the Plot Catalog, accessed from the Figure Palette. Directly
LAB 1 General MATLAB Information 1
 LAB 1 General MATLAB Information 1 General: To enter a matrix: > type the entries between square brackets, [...] > enter it by rows with elements separated by a space or comma > rows are terminated by
MATLAB: A Powerful Tool for Computation and visualization
 MATLAB: A Powerful Tool for Computation and visualization Shuxia Zhang and Ravi Chityala Sumpercomputing Institute University of Minnesota e-mail: szhang@msi.umn.edu,chityala@msi.umn.edu Tel:612-624-8858