Data handling 3: Alter Process
|
|
|
- Drusilla Manning
- 6 years ago
- Views:
Transcription


1 Introduction Geo information Science (GRS 10306) Data handling 3: Alter Process 2009/2010 CGI GIRS
2 2
3 Alter / process / analysis / operations definition Query a data handling class of operators which doesn t change the thematic and geometric meaning of the original geo data which doesn t change the (geo )reference or data structure it only selects a subset out of the whole data set Transform a data handling class of operators which doesn t change the thematic and geometric meaning of the original geo data which changes the (geo )reference or data structure Process / alter a data handling class of operators which changes the thematic and geometric meaning of the original geo data which doesn t change the (geo )reference and data structure 3

4 Overview Raster processing tools / analysis Local operations Focal operations Zonal operations Global operations Vector processing tools / analysis Attribute calculations Buffering Overlay Types Point in polygon Line in polygon Polygon on polygon Methods Union Intersect Identity Geo information process 4

5 DATA HANDLING RASTER OPERATIONS History Steinitz (Harvard), McHarg (Pennsylvania) analytical tools for landscape analysis Dana Tomlin (Yale) cartographic modelling > Map Algebra Professor Dana Tomlin originator of Map algebra. Map algebra formalized rules to process raster structured geo data new raster set = f (old raster set 1, old raster set 2,..) operation based on a local, focal, zonal or global function 5
6 Local operations new cell value is based on the old cell value on the same location in the old raster(s) 1 input raster Mathematical functions more input rasters Arithmetic operators Logical operators Cell statistic functions 6

7 Local operations: mathematical function 7

8 Local operations: arithmetic operator 8

9 Local operators 9
10 Focal operations (neighborhood operations) new cell value is based on the old cell values on the same and neighbouring locations in old raster(s) Defined window or neighborhood Neighborhood statistic function Examples: Remote Sensing: filter operations terrain analysis: slope and aspect calculations 10
11 Focal Operation raster cell neighborhood cell altered cell 11

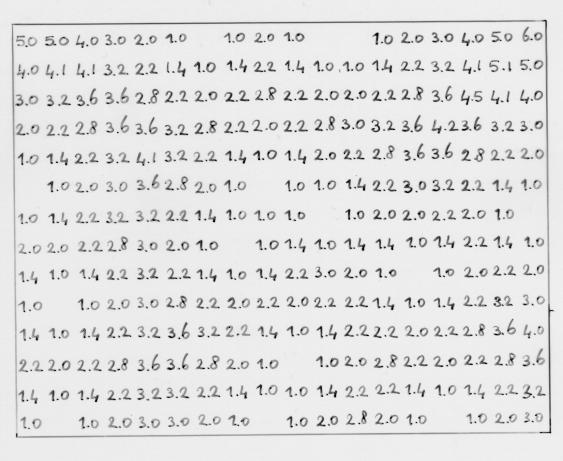
12 Zonal operations new cell value is based on a collection of old cell values of old rasters based on a clustering by old cell values Input grid is zone or region! grid a non contiguous zone in a raster are all cells with the same value A contiguous zone in a raster are spatially connected cells or region Zonal statistics functions (minimum, mean, majority, etc.) Output as dbf table Example: comparison of topographic characteristics of soil zones 12
13 Global operations new cell value is based on all old cell values of old rasters cost or weighted distance Eucledian distance or proximity analysis 13


14 Euclidean distance 1 Top view study area 14

15 Euclidean distance 2 15
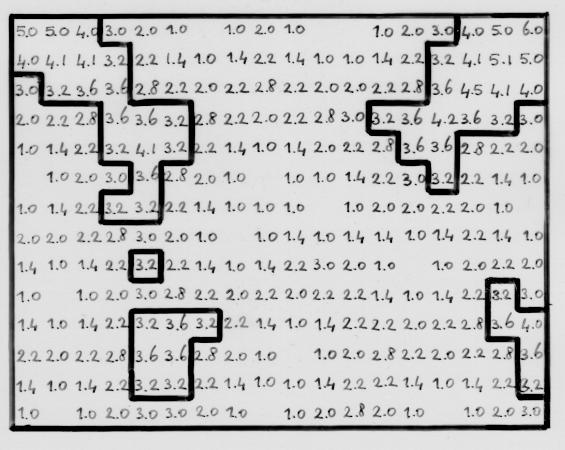
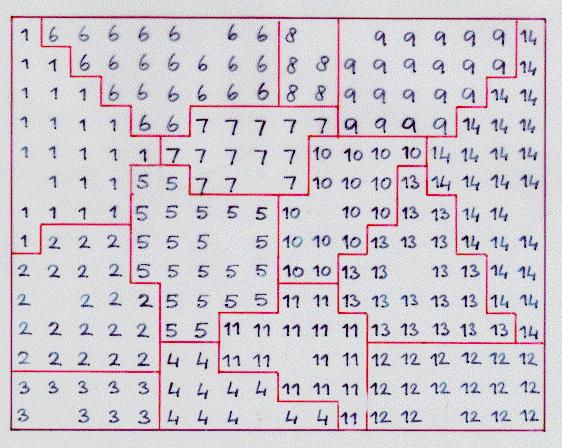
16 Exercise: Extrapolation by Euclidean distance , , ,4 1-1, ,4 1 1,4 1,4 1 1, ,2 2 2,2 2,2 2 2,2 16
17 Raster operations: comparison 17
18 Exercise 1 A A A 1 1 A B B A is the result of a zonal operation. Write down the function for this operation. 18
19 Exercise 2 A A A A B A is the result of a zonal operation B based on an 1 majority OR 2 minimal value function. Write down the values of A. 19
20 Types of vector operations Attribute calculations Buffering Overlay 20
21 Overlay operations Create new attributes and combine attributes based upon original attributes of two or more superpositioned data sets in the same extent and the same georeference Types Point in polygon Line in polygon Polygon on polygon 21
22 Optical / graphic overlay: example Optical/graphic overlay No new topology Only transparency Topological overlay New topology calculated New objects and new tables 22

23 Topological overlay: example 23
24 Overlay methods 2 A, B intersect A and B AND union A or B OR difference A, not B NOT exclusive not (A and B) NAND not-exclusive not (A or B) NOR 24
25 Vector overlay: exercise A Table A obj_id soil lutum 1 peat 10 2 clay B Table B obj_id pollution 1 yes -1 no A OR 25
26 Vector overlay: result A B A Table A obj_id obj_id A obj_id B soil lutum pollution peat 10 no peat 10 yes peat 10 no yes clay 15 yes clay 15 no no 26
27 Attribute function handling classes that calculate values for existing or new attributes Eg: classification; descriptive statistics, simple maths 27
28 Attribute calculation Object Cover GWT Calc. Abund. Lutum 1 grass grass grass maize water fruit grass residential grass maize grass water grass grass residential Cover gwt lutum Grass 4 9, ,32 28
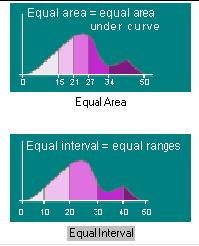
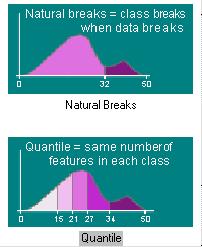
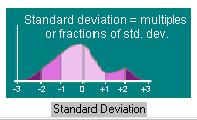
29 Classification 1 Division of thematic attribute values Examples percentile/quantile: same number of objects by class equal area: equal surface of objects by class equal interval: equal ranges within an attribute domain standard deviation: variance with respect to the average 29
30 Classification 2 30
31 Neighbourhood functions handling class operates on or in the neighbourhood / proximity of objects (vector) / cell (raster) and their respective attributes (geometric and thematic) 31

32 Buffering around points, lines and areas from object into it s surrounding neighbourhood 32


33 Buffering: different size distance is constant distance is variable 33

34 Buffering: traveling time distances 34

35 Environmental quality assessment 35

36 Environmental quality assessment 2 36
37 Extrapolation by Thiessen polygons 37
38 Thiessen applied 38


39 Example: vineyard suitability analysis 1 Wageningen... a wine producing region in reality? fiction
40 Example: vineyard suitability analysis 2 Land use Ground water +soil Elevation 0A 0B 0C Towns 0D? 1? 2? Suitable Land use Suitable Ground water Suitable Soils DEM 1A 2A 3A 4A Distance <6km 5A Land use 0/ Suitable GW/Soils GW/Soils 0/1 Slope 0/1 Slope 6A 7A 8A 9A 12A 13A 14A? A Slope classes 0/1/2 16A Aspect? 17 Aspect classes 0/1/2 19 Slope and Aspect classes 0/1/2 10A 17A 19A 11A 18 Distance 0/1 18A Suitable locations 40
41 Summary: Raster operations / analysis Local Focal Zonal Global mathematical functions neighbourhood statistics zonal statistics Euclidean distance Vector operations / analysis Buffering Overlay Types Point in polygon Line in polygon Polygon on polygon Methods Union Intersect Identity 41
42 Summary Data Handling Query Transform Alter/Process Thematically Vector Vector Attribute Geometrically map projection classification Location Vector Vector Neighbourhood Orientation similarity from object Size Raster Vector between objects Shape topology, attribute Overlay Topology Vector Raster graphic rules, order, (over)size, frequency topologic 42
43 Study materials: Theory Chang, 2006 Chapter 12: Vector data analysis Chapter 13: Raster data analysis Practical: GRS practical manual, 2006 Wageningen UR Module 7: Raster operations Module 8: Vector operations
44 Types of alteration / processing attribute functions Create new (values of) attributes (T) for an entity/cell based upon the original values of the entity / cell attributes (T) at the same location neighbourhood functions Create new attributes (T and,or G) based upon original entity / cell attributes (T and, or G) at the same location and its surrounding locations overlay functions Create new attributes (G) and combine attributes (T) based upon original attributes (T & G) of two or more super-positioned data sets of the same area and with the same geo-reference 44
Module 7 Raster operations
 Introduction Geo-Information Science Practical Manual Module 7 Raster operations 7. INTRODUCTION 7-1 LOCAL OPERATIONS 7-2 Mathematical functions and operators 7-5 Raster overlay 7-7 FOCAL OPERATIONS 7-8
Lecture 6: GIS Spatial Analysis. GE 118: INTRODUCTION TO GIS Engr. Meriam M. Santillan Caraga State University
 Lecture 6: GIS Spatial Analysis GE 118: INTRODUCTION TO GIS Engr. Meriam M. Santillan Caraga State University 1 Spatial Data It can be most simply defined as information that describes the distribution
Data handling 2: Transformations
 Intro Geo information Science (GRS 10306) Data handling 2: Transformations 2009/2010 CGI GIRS Transformation definition Query a data handling class of operators which doesn t change the thematic and geometric
Suitability Modeling with GIS
 Developed and Presented by Juniper GIS 1/33 Course Objectives What is Suitability Modeling? The Suitability Modeling Process Cartographic Modeling GIS Tools for Suitability Modeling Demonstrations of Models
Copyright The McGraw-Hill Companies, Inc. Permission required for reproduction or display.
 CHAPTER 12 RASTER DATA ANALYSIS 12.1 Data Analysis Environment Box 12.1 How to Make an Analysis Mask 12.2 Local Operations 12.2.1 Local Operations with a Single Raster 12.2.2 Reclassification 12.2.3 Local
Module 10 Data-action models
 Introduction Geo-Information Science Practical Manual Module 10 Data-action models 10. INTRODUCTION 10-1 DESIGNING A DATA-ACTION MODEL 10-2 REPETITION EXERCISES 10-6 10. Introduction Until now you have
ENGRG Introduction to GIS
 ENGRG 59910 Introduction to GIS Michael Piasecki April 3, 2014 Lecture 11: Raster Analysis GIS Related? 4/3/2014 ENGRG 59910 Intro to GIS 2 1 Why we use Raster GIS In our previous discussion of data models,
Raster GIS applications
 Raster GIS applications Columns Rows Image: cell value = amount of reflection from surface DEM: cell value = elevation (also slope/aspect/hillshade/curvature) Thematic layer: cell value = category or measured
RASTER ANALYSIS GIS Analysis Fall 2013
 RASTER ANALYSIS GIS Analysis Fall 2013 Raster Data The Basics Raster Data Format Matrix of cells (pixels) organized into rows and columns (grid); each cell contains a value representing information. What
Cell based GIS. Introduction to rasters
 Week 9 Cell based GIS Introduction to rasters topics of the week Spatial Problems Modeling Raster basics Application functions Analysis environment, the mask Application functions Spatial Analyst in ArcGIS
Raster GIS applications Columns
 Raster GIS applications Columns Rows Image: cell value = amount of reflection from surface Thematic layer: cell value = category or measured value - In both cases, there is only one value per cell (in
RASTER ANALYSIS GIS Analysis Winter 2016
 RASTER ANALYSIS GIS Analysis Winter 2016 Raster Data The Basics Raster Data Format Matrix of cells (pixels) organized into rows and columns (grid); each cell contains a value representing information.
Geographic Information Systems (GIS) Spatial Analyst [10] Dr. Mohammad N. Almasri. [10] Spring 2018 GIS Dr. Mohammad N. Almasri Spatial Analyst
![Geographic Information Systems (GIS) Spatial Analyst [10] Dr. Mohammad N. Almasri. [10] Spring 2018 GIS Dr. Mohammad N. Almasri Spatial Analyst](/thumbs/80/81171101.jpg "Geographic Information Systems (GIS) Spatial Analyst [10] Dr. Mohammad N. Almasri. [10] Spring 2018 GIS Dr. Mohammad N. Almasri Spatial Analyst") Geographic Information Systems (GIS) Spatial Analyst [10] Dr. Mohammad N. Almasri 1 Preface POINTS, LINES, and POLYGONS are good at representing geographic objects with distinct shapes They are less good
Geographic Information Systems (GIS) Spatial Analyst [10] Dr. Mohammad N. Almasri 1 Preface POINTS, LINES, and POLYGONS are good at representing geographic objects with distinct shapes They are less good
Class #2. Data Models: maps as models of reality, geographical and attribute measurement & vector and raster (and other) data structures
 data structures") Class #2 Data Models: maps as models of reality, geographical and attribute measurement & vector and raster (and other) data structures Role of a Data Model Levels of Data Model Abstraction GIS as Digital
Class #2 Data Models: maps as models of reality, geographical and attribute measurement & vector and raster (and other) data structures Role of a Data Model Levels of Data Model Abstraction GIS as Digital
GEOSPATIAL ENGINEERING COMPETENCIES. Geographic Information Science
 GEOSPATIAL ENGINEERING COMPETENCIES Geographic Information Science The character and structure of spatial information, its methods of capture, organisation, classification, qualification, analysis, management,
Getting Started with Spatial Analyst. Steve Kopp Elizabeth Graham
 Getting Started with Spatial Analyst Steve Kopp Elizabeth Graham Spatial Analyst Overview Over 100 geoprocessing tools plus raster functions Raster and vector analysis Construct workflows with ModelBuilder,
Soil texture: based on percentage of sand in the soil, partially determines the rate of percolation of water into the groundwater.
 Overview: In this week's lab you will identify areas within Webster Township that are most vulnerable to surface and groundwater contamination by conducting a risk analysis with raster data. You will create
Remote Sensing and GIS. GIS Spatial Overlay Analysis
 Subject Paper No and Title Module No and Title Module Tag Geology Remote Sensing and GIS GIS Spatial Overlay Analysis RS & GIS XXXI Principal Investigator Co-Principal Investigator Co-Principal Investigator
Raster Analysis and Functions. David Tenenbaum EEOS 465 / 627 UMass Boston
 Raster Analysis and Functions Local Functions By-cell operations Operated on by individual operators or by coregistered grid cells from other themes Begin with each target cell, manipulate through available
LECTURE 2 SPATIAL DATA MODELS
 LECTURE 2 SPATIAL DATA MODELS Computers and GIS cannot directly be applied to the real world: a data gathering step comes first. Digital computers operate in numbers and characters held internally as binary
RASTER ANALYSIS S H A W N L. P E N M A N E A R T H D A T A A N A LY S I S C E N T E R U N I V E R S I T Y O F N E W M E X I C O
 RASTER ANALYSIS S H A W N L. P E N M A N E A R T H D A T A A N A LY S I S C E N T E R U N I V E R S I T Y O F N E W M E X I C O TOPICS COVERED Spatial Analyst basics Raster / Vector conversion Raster data
Graphic Display of Vector Object
 What is GIS? GIS stands for Geographic Information Systems, although the term Geographic Information Science is gaining popularity. A GIS is a software platform for storing, organizing, viewing, querying,
Raster Data Model & Analysis
 Topics: 1. Understanding Raster Data 2. Adding and displaying raster data in ArcMap 3. Converting between floating-point raster and integer raster 4. Converting Vector data to Raster 5. Querying Raster
Neighbourhood Operations Specific Theory
 Neighbourhood Operations Specific Theory Neighbourhood operations are a method of analysing data in a GIS environment. They are especially important when a situation requires the analysis of relationships
Getting Started with Spatial Analyst. Steve Kopp Elizabeth Graham
 Getting Started with Spatial Analyst Steve Kopp Elizabeth Graham Workshop Overview Fundamentals of using Spatial Analyst What analysis capabilities exist and where to find them How to build a simple site
CPSC 695. Methods for interpolation and analysis of continuing surfaces in GIS Dr. M. Gavrilova
 CPSC 695 Methods for interpolation and analysis of continuing surfaces in GIS Dr. M. Gavrilova Overview Data sampling for continuous surfaces Interpolation methods Global interpolation Local interpolation
Terms and definitions * keep definitions of processes and terms that may be useful for tests, assignments
 Lecture 1 Core of GIS Thematic layers Terms and definitions * keep definitions of processes and terms that may be useful for tests, assignments Lecture 2 What is GIS? Info: value added data Data to solve
Spatial Analysis and Modeling (GIST 4302/5302) Database Fundaments. Database. Review: Bits and Bytes
 Database Fundaments. Database. Review: Bits and Bytes") Spatial Analysis and Modeling (GIST 4302/5302) Database Fundaments Guofeng Cao Department of Geosciences Texas Tech University Review: Bits and Bytes Data stored in a computer system is measured in bits
Spatial Analysis and Modeling (GIST 4302/5302) Database Fundaments Guofeng Cao Department of Geosciences Texas Tech University Review: Bits and Bytes Data stored in a computer system is measured in bits
Spatial Analysis and Modeling (GIST 4302/5302) Representation of Spatial Data. Representation of Spatial Data Models 3/5/18
 Representation of Spatial Data. Representation of Spatial Data Models 3/5/18") 3/5/8 Spatial Analysis and Modeling (GIST 432/532) Representation of Spatial Data Guofeng Cao Department of Geosciences Texas Tech University Representation of Spatial Data Models Object-based model: treats
3/5/8 Spatial Analysis and Modeling (GIST 432/532) Representation of Spatial Data Guofeng Cao Department of Geosciences Texas Tech University Representation of Spatial Data Models Object-based model: treats
Geographic Surfaces. David Tenenbaum EEOS 383 UMass Boston
 Geographic Surfaces Up to this point, we have talked about spatial data models that operate in two dimensions How about the rd dimension? Surface the continuous variation in space of a third dimension
Review of Cartographic Data Types and Data Models
 Review of Cartographic Data Types and Data Models GIS Data Models Raster Versus Vector in GIS Analysis Fundamental element used to represent spatial features: Raster: pixel or grid cell. Vector: x,y coordinate
+ = Spatial Analysis of Raster Data. 2 =Fault in shale 3 = Fault in limestone 4 = no Fault, shale 5 = no Fault, limestone. 2 = fault 4 = no fault
 Spatial Analysis of Raster Data 0 0 1 1 0 0 1 1 1 0 1 1 1 1 1 1 2 4 4 4 2 4 5 5 4 2 4 4 4 2 5 5 4 4 2 4 5 4 3 5 4 4 4 2 5 5 5 3 + = 0 = shale 1 = limestone 2 = fault 4 = no fault 2 =Fault in shale 3 =
Spatial Analysis with Raster Datasets
 Spatial Analysis with Raster Datasets Francisco Olivera, Ph.D., P.E. Srikanth Koka Lauren Walker Aishwarya Vijaykumar Keri Clary Department of Civil Engineering April 21, 2014 Contents Brief Overview of
layers in a raster model
 layers in a raster model Layer 1 Layer 2 layers in an vector-based model (1) Layer 2 Layer 1 layers in an vector-based model (2) raster versus vector data model Raster model Vector model Simple data structure
Chapter 8: How to Pick a GIS
 Chapter 8: How to Pick a GIS 8. The Evolution of GIS Software 8.2 GIS and Operating Systems 8.3 GIS Software Capabilities 8.4 GIS Software and Data Structures 8.5 Choosing the Best GIS David Tenenbaum
Map Analysis of Raster Data I 3/8/2018
 Map Analysis of Raster Data I /8/8 Spatial Analysis of Raster Data What is Spatial Analysis? = shale = limestone 4 4 4 4 5 5 4 4 4 4 5 5 4 4 4 5 4 5 4 4 4 5 5 5 + = = fault =Fault in shale 4 = no fault
4/7/2009. Model: Abstraction of reality following formal rules e.g. Euclidean space for physical space
 Model: Abstraction of reality following formal rules e.g. Euclidean space for physical space At different levels: mathematical model (Euclidean space) conceptual design model (ER model) data model (design)
GEOGRAPHIC INFORMATION SYSTEMS Lecture 18: Spatial Modeling
 Spatial Analysis in GIS (cont d) GEOGRAPHIC INFORMATION SYSTEMS Lecture 18: Spatial Modeling - the basic types of analysis that can be accomplished with a GIS are outlined in The Esri Guide to GIS Analysis
Mapping Distance and Density
 Mapping Distance and Density Distance functions allow you to determine the nearest location of something or the least-cost path to a particular destination. Density functions, on the other hand, allow
Spatial Analysis 2. Basic operations Béla Márkus
 Spatial Analysis 2. Basic operations Béla Márkus Spatial Analysis 2.: Basic operations Béla Márkus Lector: János Tamás This module was created within TÁMOP - 4.1.2-08/1/A-2009-0027 "Tananyagfejlesztéssel
GIS: Raster Analysis
 GIS: Raster Analysis Ts (K) High : 311 Low : 299 500 Meters Albedo G / Rn High : 0.35 High : 0.50 Low : 0.03 Low : 0.10 1 Raster analysis: Outline Raster analysis applications Map algebra Local functions
DIGITAL IMAGE ANALYSIS. Image Classification: Object-based Classification
 DIGITAL IMAGE ANALYSIS Image Classification: Object-based Classification Image classification Quantitative analysis used to automate the identification of features Spectral pattern recognition Unsupervised
GIS Tools - Geometry. A GIS stores data as different layers of information Different feature types are stored in individual files.
 A Definition of GIS GIS is a system of hardware, software, and procedures designed to support the capture, management, manipulation, analysis, modeling and display of spatially referenced data for solving
Unit 4: Vector Overlay Analysis. Lecture Outline. Possible background reading material: McHarg, Ian 1992 Design with Nature. Wiley and Sons, New York.
 Unit 4: Vector Overlay Analysis Lecture Outline Possible background reading material: McHarg, Ian 1992 Design with Nature. Wiley and Sons, New York. Introduction: The idea of overlay originated when maps
GIS Data Models. 4/9/ GIS Data Models
 GIS Data Models 1 Conceptual models of the real world The real world can be described using two conceptually different models: 1. As discrete objects, possible to represent as points, lines or polygons.
IMPORTANCE OF TOPOLOGY IN A GIS PROJECT OF MONITORING THE SOILS IN AGRICULTURAL LAND
 IMPORTANCE OF TOPOLOGY IN A GIS PROJECT OF MONITORING THE SOILS IN AGRICULTURAL LAND Abstract Gabriela BIALI, Paula COJOCARU Gheorghe Asachi Technical University of Iasi, 65 Mangeron Blvd, Iasi, Romania
Using GIS To Estimate Changes in Runoff and Urban Surface Cover In Part of the Waller Creek Watershed Austin, Texas
 Using GIS To Estimate Changes in Runoff and Urban Surface Cover In Part of the Waller Creek Watershed Austin, Texas Jordan Thomas 12-6-2009 Introduction The goal of this project is to understand runoff
Making Topographic Maps
 T O P O Applications N Making Topographic Maps M A P S Making Topographic Maps with TNTmips page 1 Before Getting Started TNTmips provides a variety of tools for working with map data and making topographic
Introduction to Geographic Information Science. Some Updates. Last Lecture 4/6/2017. Geography 4103 / Raster Data and Tesselations.
 Geography 43 / 3 Introduction to Geographic Information Science Raster Data and Tesselations Schedule Some Updates Last Lecture We finished DBMS and learned about storage of data in complex databases Relational
Multidimensional Data and Modelling
 Multidimensional Data and Modelling 1 Problems of multidimensional data structures l multidimensional (md-data or spatial) data and their implementation of operations between objects (spatial data practically
Steps for Modeling a Proposed New Reservoir in GIS
 Steps for Modeling a Proposed New Reservoir in GIS Requirements: ArcGIS ArcMap, ArcScene, Spatial Analyst, and 3D Analyst There s a new reservoir proposed for Right Hand Fork in Logan Canyon. I wanted
Spatial Analysis and Modeling (GIST 4302/5302) Guofeng Cao Department of Geosciences Texas Tech University
 Guofeng Cao Department of Geosciences Texas Tech University") Spatial Analysis and Modeling (GIST 4302/5302) Guofeng Cao Department of Geosciences Texas Tech University Representation of Spatial Data Representation of Spatial Data Models Object-based model: treats
Spatial Analysis and Modeling (GIST 4302/5302) Guofeng Cao Department of Geosciences Texas Tech University Representation of Spatial Data Representation of Spatial Data Models Object-based model: treats
Raster Data. James Frew ESM 263 Winter
 Raster Data 1 Vector Data Review discrete objects geometry = points by themselves connected lines closed polygons attributes linked to feature ID explicit location every point has coordinates 2 Fields
Spatial Analysis and Modeling (GIST 4302/5302) Guofeng Cao Department of Geosciences Texas Tech University
 Guofeng Cao Department of Geosciences Texas Tech University") Spatial Analysis and Modeling (GIST 4302/5302) Guofeng Cao Department of Geosciences Texas Tech University Outline of Today Last week, we learned: Characteristics of spatial data Types of spatial data
Spatial Analysis and Modeling (GIST 4302/5302) Guofeng Cao Department of Geosciences Texas Tech University Outline of Today Last week, we learned: Characteristics of spatial data Types of spatial data
Chapter 9. Geographic Representation Models. Emmanuel Stefanakis
 Stefanakis, E., 2014. Geographic Databases and Information Systems. CreateSpace Independent Publ. [In English], pp.386. Get a copy from Amazon Chapter 9 Geographic Representation Models Emmanuel Stefanakis
Understanding Geospatial Data Models
 Understanding Geospatial Data Models 1 A geospatial data model is a formal means of representing spatially referenced information. It is a simplified view of physical entities and a conceptualization of
Introduction to GIS. Introduction to GIS. Content
 1 Introduction to GIS Cees van Westen Dinand Alkema International Institute for Geo-Information Science and Earth Observation (ITC), Enschede, The Netherlands. E-mail: westen@itc.nl Alkema@itc.nl Introduction
Computer Database Structure for Managing Data :-
 The Map as an Abstraction of Space :- We begin the process of abstraction by conceptualizing what we encounter as a group of points, lines, areas and surfaces. We make decision about which object to take
e-soter Regional pilot platform as EU contribution to a Global Soil Observing System FP7 project #
 e-soter Regional pilot platform as EU contribution to a Global Soil Observing System FP7 project # 211758 SOTER unit delineation using SRTM and MODIS data Endre Dobos, Anna Seres, Erika Micheli, Péter
Lecture 06. Raster and Vector Data Models. Part (1) Common Data Models. Raster. Vector. Points. Points. ( x,y ) Area. Area Line.
 Common Data Models. Raster. Vector. Points. Points. ( x,y ) Area. Area Line.") Lecture 06 Raster and Vector Data Models Part (1) 1 Common Data Models Vector Raster Y Points Points ( x,y ) Line Area Line Area 2 X 1 3 Raster uses a grid cell structure Vector is more like a drawn map
Lecture 06 Raster and Vector Data Models Part (1) 1 Common Data Models Vector Raster Y Points Points ( x,y ) Line Area Line Area 2 X 1 3 Raster uses a grid cell structure Vector is more like a drawn map
Lecture 8. Vector Data Analyses. Tomislav Sapic GIS Technologist Faculty of Natural Resources Management Lakehead University
 Lecture 8 Vector Data Analyses Tomislav Sapic GIS Technologist Faculty of Natural Resources Management Lakehead University Vector Data Analysis Vector data analysis involves one or a combination of: Measuring
The WSC Data Users Guide
 Page 1 of 8 Mekong River Commission Secretariat GIS - Applications for Watershed Classification The WSC Data Users Guide Prepared by the Centre for Development and Environment (CDE), University of Berne,
Lesson 5 overview. Concepts. Interpolators. Assessing accuracy Exercise 5
 Interpolation Tools Lesson 5 overview Concepts Sampling methods Creating continuous surfaces Interpolation Density surfaces in GIS Interpolators IDW, Spline,Trend, Kriging,Natural neighbors TopoToRaster
Working with Map Algebra
 Working with Map Algebra While you can accomplish much with the Spatial Analyst user interface, you can do even more with Map Algebra, the analysis language of Spatial Analyst. Map Algebra expressions
GIS Workbook #1. GIS Basics and the ArcGIS Environment. Helen Goodchild
 GIS Basics and the ArcGIS Environment Helen Goodchild Overview of Geographic Information Systems Geographical Information Systems (GIS) are used to display, manipulate and analyse spatial data (data that
The Extraction of Lineaments Using Slope Image Derived from Digital Elevation Model: Case Study of Sungai Lembing Maran area, Malaysia.
 Journal of Applied Sciences Research, 6(11): 1745-1751, 2010 2010, INSInet Publication The Extraction of Lineaments Using Slope Image Derived from Digital Elevation Model: Case Study of Sungai Lembing
GEOGRAPHIC INFORMATION SYSTEMS Lecture 24: Spatial Analyst Continued
 GEOGRAPHIC INFORMATION SYSTEMS Lecture 24: Spatial Analyst Continued Spatial Analyst - Spatial Analyst is an ArcGIS extension designed to work with raster data - in lecture I went through a series of demonstrations
Announcements. Data Sources a list of data files and their sources, an example of what I am looking for:
 Data Announcements Data Sources a list of data files and their sources, an example of what I am looking for: Source Map of Bangor MEGIS NG911 road file for Bangor MEGIS Tax maps for Bangor City Hall, may
Spatial Analysis (Vector) II
 II") Spatial Analysis (Vector) II GEOG 300, Lecture 9 Dr. Anthony Jjumba 1 A Spatial Network is a set of geographic locations interconnected in a system by a number of routes is a system of linear features
Spatial Analysis (Vector) II GEOG 300, Lecture 9 Dr. Anthony Jjumba 1 A Spatial Network is a set of geographic locations interconnected in a system by a number of routes is a system of linear features
Geographic Information Systems. using QGIS
 Geographic Information Systems using QGIS 1 - INTRODUCTION Generalities A GIS (Geographic Information System) consists of: -Computer hardware -Computer software - Digital Data Generalities GIS softwares
Welcome to NR402 GIS Applications in Natural Resources. This course consists of 9 lessons, including Power point presentations, demonstrations,
 Welcome to NR402 GIS Applications in Natural Resources. This course consists of 9 lessons, including Power point presentations, demonstrations, readings, and hands on GIS lab exercises. Following the last
Aardobservatie en Data-analyse Image processing
 Aardobservatie en Data-analyse Image processing 1 Image processing: Processing of digital images aiming at: - image correction (geometry, dropped lines, etc) - image calibration: DN into radiance or into
Analytical and Computer Cartography Winter Lecture 9: Geometric Map Transformations
 Analytical and Computer Cartography Winter 2017 Lecture 9: Geometric Map Transformations Cartographic Transformations Attribute Data (e.g. classification) Locational properties (e.g. projection) Graphics
Probability An Example
 Probability An Example For example, suppose we have a data set where in six cities, we count the number of malls located in that city present: Each count of the # of malls in a city is an event # of Malls
Conservation Applications of LiDAR. Terrain Analysis. Workshop Exercises
 Conservation Applications of LiDAR Terrain Analysis Workshop Exercises 2012 These exercises are part of the Conservation Applications of LiDAR project a series of hands on workshops designed to help Minnesota
Notes: Notes: Notes: Notes:
 NR406 GIS Applications in Fire Ecology & Management Lesson 2 - Overlay Analysis in GIS Gathering Information from Multiple Data Layers One of the many strengths of a GIS is that you can stack several data
How does Map Algebra work?
 Map Algebra How does Map Algebra work? Map Algebra uses math-like expressions containing operators and functions with raster data. Map Algebra operators, which are relational, Boolean, logical, combinatorial,
What can we represent as a Surface?
 Geography 38/42:376 GIS II Topic 7: Surface Representation and Analysis (Chang: Chapters 13 & 15) DeMers: Chapter 10 What can we represent as a Surface? Surfaces can be used to represent: Continuously
Creating Surfaces. Steve Kopp Steve Lynch
 Steve Kopp Steve Lynch Overview Learn the types of surfaces and the data structures used to store them Emphasis on surface interpolation Learn the interpolation workflow Understand how interpolators work
Remote Sensing & GIS (Bio/Env384 A): 10 November 2015 GIS Database Query
: 10 November 2015 GIS Database Query") Remote Sensing & GIS (Bio/Env384 A): 10 November 2015 GIS Database Query One primary purpose of establishing any GIS database is to provide the possibility of querying that database, i.e., of asking questions
Remote Sensing & GIS (Bio/Env384 A): 10 November 2015 GIS Database Query One primary purpose of establishing any GIS database is to provide the possibility of querying that database, i.e., of asking questions
Introduction to GIS. Geographic Information Systems SOCR-377 9/24/2015. R. Khosla Fall Semester The real world. What in the world is GIS?
 Introduction to GIS Geographic Information Systems SOCR-377 What in the world is GIS? GIS is simultaneously the telescope, the microscope, the computer and the Xerox machine of regional analysis and synthesis
Model Design and Evaluation
 Model Design and Evaluation The General Modeling Process YES Define Goals Compartments Systematize Add Spatial Dimension Complete? NO Formulate & Flowchart Return Return NO Complete? Deliver Implement
GEOG 487 Lesson 8: Step-by-Step Activity
 GEOG 487 Lesson 8: Step-by-Step Activity Part I: Review the Relevant Data Layers and Organize the Map Document In Part I, we will review the starting datasets and organize the map document for analysis.
Introducing ArcScan for ArcGIS
 Introducing ArcScan for ArcGIS An ESRI White Paper August 2003 ESRI 380 New York St., Redlands, CA 92373-8100, USA TEL 909-793-2853 FAX 909-793-5953 E-MAIL info@esri.com WEB www.esri.com Copyright 2003
Lecture 21 - Chapter 8 (Raster Analysis, part2)
") GEOL 452/552 - GIS for Geoscientists I Lecture 21 - Chapter 8 (Raster Analysis, part2) Today: Digital Elevation Models (DEMs), Topographic functions (surface analysis): slope, aspect hillshade, viewshed,
GEOL 452/552 - GIS for Geoscientists I Lecture 21 - Chapter 8 (Raster Analysis, part2) Today: Digital Elevation Models (DEMs), Topographic functions (surface analysis): slope, aspect hillshade, viewshed,
Watershed Sciences 4930 & 6920 GEOGRAPHIC INFORMATION SYSTEMS
 HOUSEKEEPING Watershed Sciences 4930 & 6920 GEOGRAPHIC INFORMATION SYSTEMS CONTOURS! Self-Paced Lab Due Friday! WEEK SIX Lecture RASTER ANALYSES Joe Wheaton YOUR EXCERCISE Integer Elevations Rounded up
4.0 DIGITIZATION, EDITING AND STRUCTURING OF MAP DATA
 .0 DIGITIZATION, EDITING AND STRUCTURING OF MAP DATA The process of digitizing existing maps is a transformation from one analog) form of information to another digital) form. Data input is the operation
[Figure about here]
![[Figure about here]](/thumbs/78/77444676.jpg "[Figure about here]") CHAPTER 3.6: SPATIAL ANALYSIS AND MODELING Michael F. Goodchild University of California, Santa Barbara 3.6.1 Introduction In the previous chapters we have seen how a wide variety of types of geographic
CHAPTER 3.6: SPATIAL ANALYSIS AND MODELING Michael F. Goodchild University of California, Santa Barbara 3.6.1 Introduction In the previous chapters we have seen how a wide variety of types of geographic
University of West Hungary, Faculty of Geoinformatics. Béla Márkus. Spatial Analysis 5. module SAN5. 3D analysis
 University of West Hungary, Faculty of Geoinformatics Béla Márkus Spatial Analysis 5. module SAN5 3D analysis SZÉKESFEHÉRVÁR 2010 The right to this intellectual property is protected by the 1999/LXXVI
Matthew Heric, Geoscientist and Kevin D. Potter, Product Manager. Autometric, Incorporated 5301 Shawnee Road Alexandria, Virginia USA
 INTEGRATIONS OF STRUCTURED QUERY LANGUAGE WITH GEOGRAPHIC INFORMATION SYSTEM PROCESSING: GeoServer Matthew Heric, Geoscientist and Kevin D. Potter, Product Manager Autometric, Incorporated 5301 Shawnee
Geol 588. GIS for Geoscientists II. Zonal functions. Feb 22, Zonal statistics. Interpolation. Zonal statistics Sp. Analyst Tools - Zonal.
 Zonal functions Geol 588 GIS for Geoscientists II Feb 22, 2011 Zonal statistics Interpolation Zonal statistics Sp. Analyst Tools - Zonal Choose correct attribute for zones (usually: must be unique ID for
Purpose: To explore the raster grid and vector map element concepts in GIS.
 GIS INTRODUCTION TO RASTER GRIDS AND VECTOR MAP ELEMENTS c:wou:nssi:vecrasex.wpd Purpose: To explore the raster grid and vector map element concepts in GIS. PART A. RASTER GRID NETWORKS Task A- Examine
Basics of Using LiDAR Data
 Conservation Applications of LiDAR Basics of Using LiDAR Data Exercise #2: Raster Processing 2013 Joel Nelson, University of Minnesota Department of Soil, Water, and Climate This exercise was developed
Maps as Numbers: Data Models
 Maps as Numbers: Data Models vertices E Reality S E S arcs S E Conceptual Models nodes E Logical Models S Start node E End node S Physical Models 1 The Task An accurate, registered, digital map that can
Digging Into Autodesk Map 3D 2007 Level 1 Training Rick Ellis Michael Carris Russell Martin
 Digging Into Autodesk Map 3D 2007 Level 1 Training Rick Ellis Michael Carris Russell Martin PO Box 344 Canby Oregon 97013 www.cadapult-software.com training@cadapult-software.com (503) 829-8929 Table of
INTRODUCTION TO GIS WORKSHOP EXERCISE
 111 Mulford Hall, College of Natural Resources, UC Berkeley (510) 643-4539 INTRODUCTION TO GIS WORKSHOP EXERCISE This exercise is a survey of some GIS and spatial analysis tools for ecological and natural
How Do I: Find the Highest Elevation within an Area
 GeoMedia Grid: How Do I: Find the Highest Elevation within an Area Topics: Key Words: Tower Location, Site Location, Raster to Vector, and Vector to Raster Digital Elevation Models, Buffer Zone, and Zonal
Topic 5: Raster and Vector Data Models
 Geography 38/42:286 GIS 1 Topic 5: Raster and Vector Data Models Chapters 3 & 4: Chang (Chapter 4: DeMers) 1 The Nature of Geographic Data Most features or phenomena occur as either: discrete entities
What is Where? Contents. Flat File Database. WHAT: Characteristics of attributes or features. WHERE: In geographic space.
 Contents What is Where? Getting Started With Geographic Information Systems Chapter 5 Basic Database Management Searches by Attribute The Query Interface Dursun Z. ªeker Basic Database Management A GIS
GEOGRAPHIC INFORMATION SYSTEMS Lecture 25: 3D Analyst
 GEOGRAPHIC INFORMATION SYSTEMS Lecture 25: 3D Analyst 3D Analyst - 3D Analyst is an ArcGIS extension designed to work with TIN data (triangulated irregular network) - many of the tools in 3D Analyst also