Visualization. Images are used to aid in understanding of data. Height Fields and Contours Scalar Fields Volume Rendering Vector Fields [chapter 26]
|
|
|
- Hortense Wheeler
- 6 years ago
- Views:
Transcription
1 Visualization Images are used to aid in understanding of data Height Fields and Contours Scalar Fields Volume Rendering Vector Fields [chapter 26]
2 Tumor SCI, Utah
3 Scientific Visualization Visualize large datasets in scientific and medical applications Generally do not start with a 3D model CT Scan - whiter means higher radiodensity
4 Scientific Visualization Must deal with very large data sets CT or MRI, e.g MB points Visible Human MB points Visualize both real-world and simulation data Visualization of Earthquake Simulation Data Visualizations of simulated room fires Fluid simulation
5 Types of Data Scalar fields (2D or 3D volume of scalars) E.g., x-ray densities (MRI, CT scan) Vector fields (3D volume of vectors) E.g., velocities in a wind tunnel Tensor fields (3D volume of tensors [matrices]) E.g., stresses in a mechanical part All could be static or through time
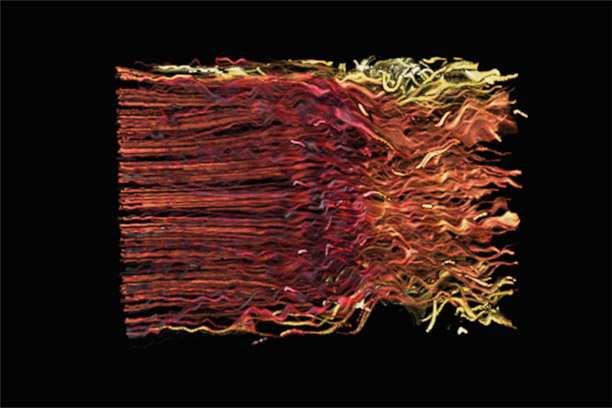
6 Outline 2D Scalar Field (Height Fields) z = f(x,y) 3D Scalar Fields v = f(x,y,z) Volume Rendering Vector Fields Blood flow in human carotid artery
7 2D Scalar Field z = f(x,y) x y, if x + y < 1 f ( x, y) = 0 How do you visualize this function?
8 2D Scalar Field z = f(x,y) x y, if x + y < 1 f ( x, y) = 0 Contours Topographical maps to indicate elevation
9 2D Scalar Field z = f(x,y) f ( x, y) = x y, if x + y < 1 0 Density plot Density is proportional to the value of the function
 z = 0.25 => (0,0,1) z = 0.5 => (1,0,0) z = 0.75 => (1,1,0) z = 1.")
10 2D Scalar Field z = f(x,y) f ( x, y) = x y, if x + y < 1 0 Gray scale density plot z = 0 => (0,0,0) z = 0.25 => (0,0,1) z = 0.5 => (1,0,0) z = 0.75 => (1,1,0) z = 1.0 => (1,1,1)
11 2D Scalar Field z = f(x,y) f ( x, y) = x y, if x + y < 1 0 Height plot Shows shape of the function

 Adding contour")
12 Height Field Visualizing an explicit function z = f(x,y) Adding contour curves f(x,y) = c

13 Meshes Function is sampled (given) at x i, y i, 0 i, j n Assume equally spaced Generate quadrilateral or triangular mesh [Asst 1]
14 Contour Curves f ( x, y) = x y, if x + y < 1 0 Contour curve at f(x,y) = c How can we draw the curve? Sample at regular intervals for x,y f < c f > c
 either f i j c or f i j >")
15 Marching Squares Sample function f at every grid point x i, y j For every point f i j = f(x i, y j ) either f i j c or f i j > c
16 Ambiguities of Labelings Ambiguous labels Different resulting contours Resolution by subdivision (where possible)
17 Cases for Vertex Labels 16 cases for vertex labels 4 unique mod. symmetries
18 Marching Squares Examples Can you do better?
: Analogous calculation for y direction x i x i+1 x f i j = a < c c < b = f i+1")
19 Interpolating Intersections Approximate intersection Midpoint between x i, x i+1 and y j, y j+1 Better: interpolate If f i j = a is closer to c than b = f i+1 j then intersection is closer to (x i, y j ): Analogous calculation for y direction x i x i+1 x f i j = a < c c < b = f i+1 j
20 Marching Squares Examples

21 Marching Squares Examples Adaptive Subdivision
22 Outline 2D Scalar Fields 3D Scalar Fields Volume Rendering Vector Fields

23 3D Scalar Fields Volumetric data sets Example: tissue density Assume again regularly sampled Represent as voxels Two rendering methods Isosurface rendering Direct volume rendering (use all values [next])
24 Isosurfaces Generalize contour curves to 3D Isosurface given by f(x,y,z) = c f(x, y, z) < c inside f(x, y, z) = c surface f(x, y, z) > c outside
25 Marching Cubes Display technique for isosurfaces 3D version of marching squares How many possible cases? 2 8 = 256
26 Marching Cubes 14 cube labelings (after elimination symmetries)

27 Marching Cube Tessellations Generalize marching squares, just more cases Interpolate as in 2D Ambiguities similar to 2D

28 Marching Squares Examples

29 Marching Squares Examples
")
30 Example (Utah)
31 Outline 2D Scalar Fields 3D Scalar Fields Volume Rendering Vector Fields
 Ray-traced isosurface f(x,y,z)=c Same data, rendered as a")
32 Volume Rendering Some data is more naturally modeled as a volume, not a surface Use all voxels and transparency (a-values) Ray-traced isosurface f(x,y,z)=c Same data, rendered as a volume
33 Why Bother with Volume Rendering? Not all voxels contribute to final image Could miss most important data by selecting wrong isovalue All voxels contribute to the image more informative less misleading (the isosurface of noisy data is unpredictable) Simpler and more efficient than converting a very complex data volume (like the visible human) to polygons and then rendering them
34 Surface vs. Volume Rendering 3D model of surfaces Convert to triangles Draw primitives Lose or disguise data Good for opaque objects Scalar field in 3D Convert to RGBA values Render volume directly See data as given Good for complex objects
 aerodynamic simulations Meteorology atmospheric pressure,")

35 Sample Applications Medical Computed Tomography (CT) Magnetic Resonance Imaging (MRI) Ultrasound Engineering and Science Computational Fluid Dynamics (CFD) aerodynamic simulations Meteorology atmospheric pressure, temperature, wind speed, wind direction, humidity, precipitation Astrophysics simulate galaxies Simulate gravitational contraction of complex N-body systems A computer simulation of high velocity air flow around the Space Shuttle.
36 Volume Rendering Pipeline Data volumes come in all types: tissue density (CT), wind speed, pressure, temperature, value of implicit function. Data volumes are used as input to a transfer function, which produces a sample volume of colors and opacities as output. Typical might be a 256x256x64 CT scan That volume is rendered to produce a final image. Transfer function Rendering Data sets Sample Volume Image
37 Transfer Functions Transform scalar data values to RGBA values Apply to every voxel in volume Highly application dependent Start from data histogram

 University")
38 Transfer Function Example Mantle Convection Scientific Computing and Imaging (SCI) University of Utah

39 Transfer Function Example G. Kindlmann
40 Volume Rendering Pipeline Use opacity for emphasis CT Scan - whiter means higher radiodensity
41 Volume Rendering Transfer function Rendering Data sets Sample Volume Image Three volume rendering techniques Volume ray casting Splatting 3D texture mapping

42 Volume Ray Casting Ray Casting Integrate color and opacity along the ray Simplest scheme just takes equal steps along ray, sampling opacity and color Grids make it easy to find the next cell

43 Trilinear Interpolation Interpolate to compute RGBA away from grid Nearest neighbor yields blocky images Use trilinear interpolation 3D generalization of bilinear interpolation Nearest neighbor Trilinear interpolation
44 Trilinear Interpolation Bilinear interpolation Trilinear interpolation

 Project onto image")
45 Splatting Alternative to ray tracing Assign shape to each voxel (e.g., sphere or Gaussian) Project onto image plane (splat) Draw voxels back-to-front Composite (a-blend)
46 3D Textures Alternative to ray tracing, splatting Build a 3D texture (including opacity) Draw a stack of polygons, back-to-front Efficient if supported in graphics hardware Few polygons, much texture memory 3D RGBA texture Viewpoint Draw back to front
47 Other Techniques Use CSG for cut-away not head and or
48 Acceleration of Volume Rendering Basic problem: Huge data sets Octrees Use error measures to stop iteration Exploit parallelism
49 Outline Height Fields and Contours Scalar Fields Volume Rendering Vector Fields
50 Vector Fields Visualize vector at each (x,y,z) point Example: velocity field Hedgehogs Use 3D directed line segments (sample field) Orientation and magnitude determined by vector Glyph Use other geometric primitives Cones Blood flow in human carotid artery

")

51 Glyphs for air flow Vector Fields (Utah) Tornado Magnetic field Plasma disruption

52 More Flow Examples Banks and Interrante

53 Interaction: Data Probe SCI, Utah

54 Example of visualization application University of Utah
55 Summary Height Fields and Contours Scalar Fields Isosurfaces Marching cubes Volume Rendering Volume ray tracing Splatting 3D Textures Vector Fields Hedgehogs Glyph
56 Announcements Course Evaluation is now open Until Monday, May 7th Please complete the evaluation We read it and listen to what you say
11/1/13. Visualization. Scientific Visualization. Types of Data. Height Field. Contour Curves. Meshes
 CSCI 420 Computer Graphics Lecture 26 Visualization Height Fields and Contours Scalar Fields Volume Rendering Vector Fields [Angel Ch. 2.11] Jernej Barbic University of Southern California Scientific Visualization
Visualization. CSCI 420 Computer Graphics Lecture 26
 CSCI 420 Computer Graphics Lecture 26 Visualization Height Fields and Contours Scalar Fields Volume Rendering Vector Fields [Angel Ch. 11] Jernej Barbic University of Southern California 1 Scientific Visualization
Visualization Computer Graphics I Lecture 20
 15-462 Computer Graphics I Lecture 20 Visualization Height Fields and Contours Scalar Fields Volume Rendering Vector Fields [Angel Ch. 12] April 15, 2003 Frank Pfenning Carnegie Mellon University http://www.cs.cmu.edu/~fp/courses/graphics/
Height Fields and Contours Scalar Fields Volume Rendering Vector Fields [Angel Ch. 12] April 23, 2002 Frank Pfenning Carnegie Mellon University
![Height Fields and Contours Scalar Fields Volume Rendering Vector Fields [Angel Ch. 12] April 23, 2002 Frank Pfenning Carnegie Mellon University](/thumbs/90/102611276.jpg "Height Fields and Contours Scalar Fields Volume Rendering Vector Fields [Angel Ch. 12] April 23, 2002 Frank Pfenning Carnegie Mellon University") 15-462 Computer Graphics I Lecture 21 Visualization Height Fields and Contours Scalar Fields Volume Rendering Vector Fields [Angel Ch. 12] April 23, 2002 Frank Pfenning Carnegie Mellon University http://www.cs.cmu.edu/~fp/courses/graphics/
15-462 Computer Graphics I Lecture 21 Visualization Height Fields and Contours Scalar Fields Volume Rendering Vector Fields [Angel Ch. 12] April 23, 2002 Frank Pfenning Carnegie Mellon University http://www.cs.cmu.edu/~fp/courses/graphics/
Visualization Computer Graphics I Lecture 20
 15-462 Computer Graphics I Lecture 20 Visualization Height Fields and Contours Scalar Fields Volume Rendering Vector Fields [Angel Ch. 12] November 20, 2003 Doug James Carnegie Mellon University http://www.cs.cmu.edu/~djames/15-462/fall03
Volume visualization. Volume visualization. Volume visualization methods. Sources of volume visualization. Sources of volume visualization
 Volume visualization Volume visualization Volumes are special cases of scalar data: regular 3D grids of scalars, typically interpreted as density values. Each data value is assumed to describe a cubic
Data Visualization (DSC 530/CIS )
") Data Visualization (DSC 530/CIS 60-0) Isosurfaces & Volume Rendering Dr. David Koop Fields & Grids Fields: - Values come from a continuous domain, infinitely many values - Sampled at certain positions
Data Visualization (DSC 530/CIS 60-0) Isosurfaces & Volume Rendering Dr. David Koop Fields & Grids Fields: - Values come from a continuous domain, infinitely many values - Sampled at certain positions
Data Visualization (DSC 530/CIS )
") Data Visualization (DSC 530/CIS 60-01) Scalar Visualization Dr. David Koop Online JavaScript Resources http://learnjsdata.com/ Good coverage of data wrangling using JavaScript Fields in Visualization Scalar
Data Visualization (DSC 530/CIS 60-01) Scalar Visualization Dr. David Koop Online JavaScript Resources http://learnjsdata.com/ Good coverage of data wrangling using JavaScript Fields in Visualization Scalar
Scientific Visualization. CSC 7443: Scientific Information Visualization
 Scientific Visualization Scientific Datasets Gaining insight into scientific data by representing the data by computer graphics Scientific data sources Computation Real material simulation/modeling (e.g.,
Scalar Data. Visualization Torsten Möller. Weiskopf/Machiraju/Möller
 Scalar Data Visualization Torsten Möller Weiskopf/Machiraju/Möller Overview Basic strategies Function plots and height fields Isolines Color coding Volume visualization (overview) Classification Segmentation
CIS 467/602-01: Data Visualization
 CIS 467/60-01: Data Visualization Isosurfacing and Volume Rendering Dr. David Koop Fields and Grids Fields: values come from a continuous domain, infinitely many values - Sampled at certain positions to
Lecture overview. Visualisatie BMT. Fundamental algorithms. Visualization pipeline. Structural classification - 1. Structural classification - 2
 Visualisatie BMT Fundamental algorithms Arjan Kok a.j.f.kok@tue.nl Lecture overview Classification of algorithms Scalar algorithms Vector algorithms Tensor algorithms Modeling algorithms 1 2 Visualization
Data Visualization (CIS/DSC 468)
") Data Visualization (CIS/DSC 46) Volume Rendering Dr. David Koop Visualizing Volume (3D) Data 2D visualization slice images (or multi-planar reformating MPR) Indirect 3D visualization isosurfaces (or surface-shaded
Data Visualization (CIS/DSC 46) Volume Rendering Dr. David Koop Visualizing Volume (3D) Data 2D visualization slice images (or multi-planar reformating MPR) Indirect 3D visualization isosurfaces (or surface-shaded
Data Representation in Visualisation
 Data Representation in Visualisation Visualisation Lecture 4 Taku Komura Institute for Perception, Action & Behaviour School of Informatics Taku Komura Data Representation 1 Data Representation We have
Scalar Data. CMPT 467/767 Visualization Torsten Möller. Weiskopf/Machiraju/Möller
 Scalar Data CMPT 467/767 Visualization Torsten Möller Weiskopf/Machiraju/Möller Overview Basic strategies Function plots and height fields Isolines Color coding Volume visualization (overview) Classification
Isosurface Rendering. CSC 7443: Scientific Information Visualization
 Isosurface Rendering What is Isosurfacing? An isosurface is the 3D surface representing the locations of a constant scalar value within a volume A surface with the same scalar field value Isosurfaces form
Volume Illumination & Vector Field Visualisation
 Volume Illumination & Vector Field Visualisation Visualisation Lecture 11 Institute for Perception, Action & Behaviour School of Informatics Volume Illumination & Vector Vis. 1 Previously : Volume Rendering
Indirect Volume Rendering
 Indirect Volume Rendering Visualization Torsten Möller Weiskopf/Machiraju/Möller Overview Contour tracing Marching cubes Marching tetrahedra Optimization octree-based range query Weiskopf/Machiraju/Möller
5. Volume Visualization
 5. Volume Visualization Scalar volume data Medical Applications: CT, MRI, confocal microscopy, ultrasound, etc. 1 5. Volume Visualization 2 5. Volume Visualization 3 5. Volume Visualization Some possible
Scalar Data. Alark Joshi
 Scalar Data Alark Joshi Announcements Pick two papers to present Email me your top 3/4 choices. FIFO allotment Contact your clients Blog summaries: http://cs.boisestate.edu/~alark/cs564/participants.html
Volume Rendering. Computer Animation and Visualisation Lecture 9. Taku Komura. Institute for Perception, Action & Behaviour School of Informatics
 Volume Rendering Computer Animation and Visualisation Lecture 9 Taku Komura Institute for Perception, Action & Behaviour School of Informatics Volume Rendering 1 Volume Data Usually, a data uniformly distributed
Geometric Representations. Stelian Coros
 Geometric Representations Stelian Coros Geometric Representations Languages for describing shape Boundary representations Polygonal meshes Subdivision surfaces Implicit surfaces Volumetric models Parametric
Lecture overview. Visualisatie BMT. Transparency. Transparency. Transparency. Transparency. Transparency Volume rendering Assignment
 Visualisatie BMT Lecture overview Assignment Arjan Kok a.j.f.kok@tue.nl 1 Makes it possible to see inside or behind objects Complement of transparency is opacity Opacity defined by alpha value with range
Scalar Visualization
 Scalar Visualization Visualizing scalar data Popular scalar visualization techniques Color mapping Contouring Height plots outline Recap of Chap 4: Visualization Pipeline 1. Data Importing 2. Data Filtering
CSC Computer Graphics
 // CSC. Computer Graphics Lecture Kasun@dscs.sjp.ac.lk Department of Computer Science University of Sri Jayewardanepura Polygon Filling Scan-Line Polygon Fill Algorithm Span Flood-Fill Algorithm Inside-outside
Data Visualization (CIS/DSC 468)
") Data Visualization (CIS/DSC 468) Vector Visualization Dr. David Koop Visualizing Volume (3D) Data 2D visualization slice images (or multi-planar reformating MPR) Indirect 3D visualization isosurfaces (or
Data Visualization (CIS/DSC 468) Vector Visualization Dr. David Koop Visualizing Volume (3D) Data 2D visualization slice images (or multi-planar reformating MPR) Indirect 3D visualization isosurfaces (or
Clipping. CSC 7443: Scientific Information Visualization
 Clipping Clipping to See Inside Obscuring critical information contained in a volume data Contour displays show only exterior visible surfaces Isosurfaces can hide other isosurfaces Other displays can
CIS 467/602-01: Data Visualization
 CIS 467/602-01: Data Visualization Vector Field Visualization Dr. David Koop Fields Tables Networks & Trees Fields Geometry Clusters, Sets, Lists Items Items (nodes) Grids Items Items Attributes Links
Previously... contour or image rendering in 2D
 Volume Rendering Visualisation Lecture 10 Taku Komura Institute for Perception, Action & Behaviour School of Informatics Volume Rendering 1 Previously... contour or image rendering in 2D 2D Contour line
Volume Illumination, Contouring
 Volume Illumination, Contouring Computer Animation and Visualisation Lecture 0 tkomura@inf.ed.ac.uk Institute for Perception, Action & Behaviour School of Informatics Contouring Scaler Data Overview -
Volume Rendering. Lecture 21
 Volume Rendering Lecture 21 Acknowledgements These slides are collected from many sources. A particularly valuable source is the IEEE Visualization conference tutorials. Sources from: Roger Crawfis, Klaus
Scalar Algorithms: Contouring
 Scalar Algorithms: Contouring Computer Animation and Visualisation Lecture tkomura@inf.ed.ac.uk Institute for Perception, Action & Behaviour School of Informatics Contouring Scaler Data Last Lecture...
Volume Visualization. Part 1 (out of 3) Volume Data. Where do the data come from? 3D Data Space How are volume data organized?
 Volume Data. Where do the data come from? 3D Data Space How are volume data organized?") Volume Data Volume Visualization Part 1 (out of 3) Where do the data come from? Medical Application Computed Tomographie (CT) Magnetic Resonance Imaging (MR) Materials testing Industrial-CT Simulation
Volume Data Volume Visualization Part 1 (out of 3) Where do the data come from? Medical Application Computed Tomographie (CT) Magnetic Resonance Imaging (MR) Materials testing Industrial-CT Simulation
Volume Visualization
 Volume Visualization Part 1 (out of 3) Overview: Volume Visualization Introduction to volume visualization On volume data Surface vs. volume rendering Overview: Techniques Simple methods Slicing, cuberille
Scalar Visualization
 Scalar Visualization 5-1 Motivation Visualizing scalar data is frequently encountered in science, engineering, and medicine, but also in daily life. Recalling from earlier, scalar datasets, or scalar fields,
8. Tensor Field Visualization
 8. Tensor Field Visualization Tensor: extension of concept of scalar and vector Tensor data for a tensor of level k is given by t i1,i2,,ik (x 1,,x n ) Second-order tensor often represented by matrix Examples:
Contours & Implicit Modelling 4
 Brief Recap Contouring & Implicit Modelling Contouring Implicit Functions Visualisation Lecture 8 lecture 6 Marching Cubes lecture 3 visualisation of a Quadric toby.breckon@ed.ac.uk Computer Vision Lab.
Scalar Field Visualization I
 Scalar Field Visualization I What is a Scalar Field? The approximation of certain scalar function in space f(x,y,z). Image source: blimpyb.com f What is a Scalar Field? The approximation of certain scalar
Contours & Implicit Modelling 1
 Contouring & Implicit Modelling Visualisation Lecture 8 Institute for Perception, Action & Behaviour School of Informatics Contours & Implicit Modelling 1 Brief Recap Contouring Implicit Functions lecture
Implicit Surfaces & Solid Representations COS 426
 Implicit Surfaces & Solid Representations COS 426 3D Object Representations Desirable properties of an object representation Easy to acquire Accurate Concise Intuitive editing Efficient editing Efficient
Fundamental Algorithms
 Fundamental Algorithms Fundamental Algorithms 3-1 Overview This chapter introduces some basic techniques for visualizing different types of scientific data sets. We will categorize visualization methods
Solid Modeling. Michael Kazhdan ( /657) HB , FvDFH 12.1, 12.2, 12.6, 12.7 Marching Cubes, Lorensen et al.
 HB , FvDFH 12.1, 12.2, 12.6, 12.7 Marching Cubes, Lorensen et al.") Solid Modeling Michael Kazhdan (601.457/657) HB 10.15 10.17, 10.22 FvDFH 12.1, 12.2, 12.6, 12.7 Marching Cubes, Lorensen et al. 1987 Announcement OpenGL review session: When: Today @ 9:00 PM Where: Malone
Solid Modeling Michael Kazhdan (601.457/657) HB 10.15 10.17, 10.22 FvDFH 12.1, 12.2, 12.6, 12.7 Marching Cubes, Lorensen et al. 1987 Announcement OpenGL review session: When: Today @ 9:00 PM Where: Malone
Computer Graphics Ray Casting. Matthias Teschner
 Computer Graphics Ray Casting Matthias Teschner Outline Context Implicit surfaces Parametric surfaces Combined objects Triangles Axis-aligned boxes Iso-surfaces in grids Summary University of Freiburg
Scalar Field Visualization I
 Scalar Field Visualization I What is a Scalar Field? The approximation of certain scalar function in space f(x,y,z). Image source: blimpyb.com f What is a Scalar Field? The approximation of certain scalar
Polygon Meshes and Implicit Surfaces
 CSCI 420 Computer Graphics Lecture 9 Polygon Meshes and Implicit Surfaces Polygon Meshes Implicit Surfaces Constructive Solid Geometry [Angel Ch. 10] Jernej Barbic University of Southern California 1 Modeling
Polygon Meshes and Implicit Surfaces
 CSCI 420 Computer Graphics Lecture 9 and Constructive Solid Geometry [Angel Ch. 10] Jernej Barbic University of Southern California Modeling Complex Shapes An equation for a sphere is possible, but how
Physical Modeling and Surface Detection. CS116B Chris Pollett Mar. 14, 2005.
 Physical Modeling and Surface Detection CS116B Chris Pollett Mar. 14, 2005. Outline Particle Systems Physical Modeling and Visualization Classification of Visible Surface Detection Algorithms Back Face
Lecture overview. Visualisatie BMT. Vector algorithms. Vector algorithms. Time animation. Time animation
 Visualisatie BMT Lecture overview Vector algorithms Tensor algorithms Modeling algorithms Algorithms - 2 Arjan Kok a.j.f.kok@tue.nl 1 2 Vector algorithms Vector 2 or 3 dimensional representation of direction
Volume Illumination and Segmentation
 Volume Illumination and Segmentation Computer Animation and Visualisation Lecture 13 Institute for Perception, Action & Behaviour School of Informatics Overview Volume illumination Segmentation Volume
Data analysis with ParaView CSMP Workshop 2009 Gillian Gruen
 Data analysis with ParaView 3.4.0 CSMP Workshop 2009 Gillian Gruen How to...... display a data set ( Contour, Glyph, Clip, Slice) be efficient in displaying similar data sets ( work with Lookmarks )...
A Survey of Volumetric Visualization Techniques for Medical Images
 International Journal of Research Studies in Computer Science and Engineering (IJRSCSE) Volume 2, Issue 4, April 2015, PP 34-39 ISSN 2349-4840 (Print) & ISSN 2349-4859 (Online) www.arcjournals.org A Survey
CHAPTER 1 Graphics Systems and Models 3
 ?????? 1 CHAPTER 1 Graphics Systems and Models 3 1.1 Applications of Computer Graphics 4 1.1.1 Display of Information............. 4 1.1.2 Design.................... 5 1.1.3 Simulation and Animation...........
11/1/13. Polygon Meshes and Implicit Surfaces. Shape Representations. Polygon Models in OpenGL. Modeling Complex Shapes
 CSCI 420 Computer Graphics Lecture 7 and Constructive Solid Geometry [Angel Ch. 12.1-12.3] Jernej Barbic University of Southern California Modeling Complex Shapes An equation for a sphere is possible,
CIS 4930/ SCIENTIFICVISUALIZATION
 CIS 4930/6930-902 SCIENTIFICVISUALIZATION ISOSURFACING Paul Rosen Assistant Professor University of South Florida slides credits Tricoche and Meyer ADMINISTRATIVE Read (or watch video): Kieffer et al,
Vector Field Visualisation
 Vector Field Visualisation Computer Animation and Visualization Lecture 14 Institute for Perception, Action & Behaviour School of Informatics Visualising Vectors Examples of vector data: meteorological
Iso-surface cell search. Iso-surface Cells. Efficient Searching. Efficient search methods. Efficient iso-surface cell search. Problem statement:
 Iso-Contouring Advanced Issues Iso-surface cell search 1. Efficiently determining which cells to examine. 2. Using iso-contouring as a slicing mechanism 3. Iso-contouring in higher dimensions 4. Texturing
Polygonization of Implicit Surfaces
 Polygonization of Implicit Surfaces Hongxin Zhang and Jieqing Feng 2007-01-11 State Key Lab of CAD&CG Zhejiang University Contents Polygonization of Implicit Surfaces Other Methods for Displaying Implicit
Spatial Data Structures
 Spatial Data Structures Hierarchical Bounding Volumes Regular Grids Octrees BSP Trees Constructive Solid Geometry (CSG) [Angel 9.10] Outline Ray tracing review what rays matter? Ray tracing speedup faster
4. Basic Mapping Techniques
 4. Basic Mapping Techniques Mapping from (filtered) data to renderable representation Most important part of visualization Possible visual representations: Position Size Orientation Shape Brightness Color
GPU-based Volume Rendering. Michal Červeňanský
 GPU-based Volume Rendering Michal Červeňanský Outline Volume Data Volume Rendering GPU rendering Classification Speed-up techniques Other techniques 2 Volume Data Describe interior structures Liquids,
Scalar Field Visualization. Some slices used by Prof. Mike Bailey
 Scalar Field Visualization Some slices used by Prof. Mike Bailey Scalar Fields The approximation of certain scalar function in space f(x,y,z). Most of time, they come in as some scalar values defined on
Computer Graphics 1. Chapter 2 (May 19th, 2011, 2-4pm): 3D Modeling. LMU München Medieninformatik Andreas Butz Computergraphik 1 SS2011
: 3D Modeling. LMU München Medieninformatik Andreas Butz Computergraphik 1 SS2011") Computer Graphics 1 Chapter 2 (May 19th, 2011, 2-4pm): 3D Modeling 1 The 3D rendering pipeline (our version for this class) 3D models in model coordinates 3D models in world coordinates 2D Polygons in
Computer Graphics 1 Chapter 2 (May 19th, 2011, 2-4pm): 3D Modeling 1 The 3D rendering pipeline (our version for this class) 3D models in model coordinates 3D models in world coordinates 2D Polygons in
Lecture notes: Object modeling
 Lecture notes: Object modeling One of the classic problems in computer vision is to construct a model of an object from an image of the object. An object model has the following general principles: Compact
Visualization Toolkit (VTK) An Introduction
 An Introduction") Visualization Toolkit (VTK) An Introduction An open source, freely available software system for 3D computer graphics, image processing, and visualization Implemented as a C++ class library, with interpreted
Visualization Toolkit (VTK) An Introduction An open source, freely available software system for 3D computer graphics, image processing, and visualization Implemented as a C++ class library, with interpreted
Introduction to volume rendering. Paul Bourke
 Introduction to volume rendering Paul Bourke 2D drafting/drawing Points + lines + curves + primitives (circle, rectangle ) Describes boundaries 2D image Pixels Describes the interior of a rectangle, a
CSG obj. oper3. obj1 obj2 obj3. obj5. obj4
 Solid Modeling Solid: Boundary + Interior Volume occupied by geometry Solid representation schemes Constructive Solid Geometry (CSG) Boundary representations (B-reps) Space-partition representations Operations
9. Three Dimensional Object Representations
 9. Three Dimensional Object Representations Methods: Polygon and Quadric surfaces: For simple Euclidean objects Spline surfaces and construction: For curved surfaces Procedural methods: Eg. Fractals, Particle
Overview of 3D Object Representations
 Overview of 3D Object Representations Thomas Funkhouser Princeton University C0S 597D, Fall 2003 3D Object Representations What makes a good 3D object representation? Stanford and Hearn & Baker 1 3D Object
Marching Cubes Robert Hunt CS 525. Introduction
 Marching Cubes Robert Hunt CS 525 Introduction The Marching Cubes algorithm is a method for visualizing a conceptual surface called an isosurface. An isosurface is formed from a set of points in 3 space
Visualization Toolkit(VTK) Atul Kumar MD MMST PhD IRCAD-Taiwan
 Atul Kumar MD MMST PhD IRCAD-Taiwan") Visualization Toolkit(VTK) Atul Kumar MD MMST PhD IRCAD-Taiwan Visualization What is visualization?: Informally, it is the transformation of data or information into pictures.(scientific, Data, Information)
Visualization Toolkit(VTK) Atul Kumar MD MMST PhD IRCAD-Taiwan Visualization What is visualization?: Informally, it is the transformation of data or information into pictures.(scientific, Data, Information)
Curves and Surfaces Computer Graphics I Lecture 10
 15-462 Computer Graphics I Lecture 10 Curves and Surfaces Parametric Representations Cubic Polynomial Forms Hermite Curves Bezier Curves and Surfaces [Angel 10.1-10.6] September 30, 2003 Doug James Carnegie
Direct Volume Rendering
 Direct Volume Rendering Balázs Csébfalvi Department of Control Engineering and Information Technology Budapest University of Technology and Economics Classification of Visualization Algorithms Indirect
Contouring and Isosurfaces. Ronald Peikert SciVis Contouring 2-1
 Contouring and Isosurfaces Ronald Peikert SciVis 2007 - Contouring 2-1 What are contours? Set of points where the scalar field s has a given value c: Examples in 2D: height contours on maps isobars on
Computer Graphics. - Volume Rendering - Philipp Slusallek
 Computer Graphics - Volume Rendering - Philipp Slusallek Overview Motivation Volume Representation Indirect Volume Rendering Volume Classification Direct Volume Rendering Applications: Bioinformatics Image
3D Modeling: Surfaces
 CS 430/536 Computer Graphics I 3D Modeling: Surfaces Week 8, Lecture 16 David Breen, William Regli and Maxim Peysakhov Geometric and Intelligent Computing Laboratory Department of Computer Science Drexel
Applications of Explicit Early-Z Culling
 Applications of Explicit Early-Z Culling Jason L. Mitchell ATI Research Pedro V. Sander ATI Research Introduction In past years, in the SIGGRAPH Real-Time Shading course, we have covered the details of
GLOBAL EDITION. Interactive Computer Graphics. A Top-Down Approach with WebGL SEVENTH EDITION. Edward Angel Dave Shreiner
 GLOBAL EDITION Interactive Computer Graphics A Top-Down Approach with WebGL SEVENTH EDITION Edward Angel Dave Shreiner This page is intentionally left blank. Interactive Computer Graphics with WebGL, Global
L1 - Introduction. Contents. Introduction of CAD/CAM system Components of CAD/CAM systems Basic concepts of graphics programming
 L1 - Introduction Contents Introduction of CAD/CAM system Components of CAD/CAM systems Basic concepts of graphics programming 1 Definitions Computer-Aided Design (CAD) The technology concerned with the
Volume Visualiza0on. Today s Class. Grades & Homework feedback on Homework Submission Server
 11/3/14 Volume Visualiza0on h3p://imgur.com/trjonqk h3p://i.imgur.com/zcjc9kp.jpg Today s Class Grades & Homework feedback on Homework Submission Server Everything except HW4 (didn t get to that yet) &
Surface Rendering. Surface Rendering
 Surface Rendering Surface Rendering Introduce Mapping Methods - Texture Mapping - Environmental Mapping - Bump Mapping Go over strategies for - Forward vs backward mapping 2 1 The Limits of Geometric Modeling
Volume Graphics Introduction
 High-Quality Volume Graphics on Consumer PC Hardware Volume Graphics Introduction Joe Kniss Gordon Kindlmann Markus Hadwiger Christof Rezk-Salama Rüdiger Westermann Motivation (1) Motivation (2) Scientific
Introduction to Geometry. Computer Graphics CMU /15-662
 Introduction to Geometry Computer Graphics CMU 15-462/15-662 Assignment 2: 3D Modeling You will be able to create your own models (This mesh was created in Scotty3D in about 5 minutes... you can do much
Lecture overview. Visualisatie BMT. Goal. Summary (1) Summary (3) Summary (2) Goal Summary Study material
 Summary (3) Summary (2) Goal Summary Study material") Visualisatie BMT Introduction, visualization, visualization pipeline Arjan Kok a.j.f.kok@tue.nl Lecture overview Goal Summary Study material What is visualization Examples Visualization pipeline 1 2 Goal
Visualisatie BMT Introduction, visualization, visualization pipeline Arjan Kok a.j.f.kok@tue.nl Lecture overview Goal Summary Study material What is visualization Examples Visualization pipeline 1 2 Goal
Efficient Volumetric Ray Casting for Isosurface Rendering
 Efficient Volumetric Ray Casting for Isosurface Rendering Jae Jeong Choi 1 Byeong-Seok Shin 2 Yeong Gil Shin 1 Kevin Cleary 3 1. Department of Computer Science, Seoul National University, Seoul, Republic
Special Topics in Visualization
 Special Topics in Visualization Final Project Report Dual contouring of Hermite Data Submitted By S M Shahed Nejhum 8589-1199 May 19, 2008 Introduction Iso-surface extraction from 3D volumetric data is
Interactive Computer Graphics A TOP-DOWN APPROACH WITH SHADER-BASED OPENGL
 International Edition Interactive Computer Graphics A TOP-DOWN APPROACH WITH SHADER-BASED OPENGL Sixth Edition Edward Angel Dave Shreiner Interactive Computer Graphics: A Top-Down Approach with Shader-Based
Computer Graphics I Lecture 11
 15-462 Computer Graphics I Lecture 11 Midterm Review Assignment 3 Movie Midterm Review Midterm Preview February 26, 2002 Frank Pfenning Carnegie Mellon University http://www.cs.cmu.edu/~fp/courses/graphics/
Introduction to Python and VTK
 Introduction to Python and VTK Scientific Visualization, HT 2013 Lecture 2 Johan Nysjö Centre for Image analysis Swedish University of Agricultural Sciences Uppsala University 2 About me PhD student in
Solid Modeling. Thomas Funkhouser Princeton University C0S 426, Fall Represent solid interiors of objects
 Solid Modeling Thomas Funkhouser Princeton University C0S 426, Fall 2000 Solid Modeling Represent solid interiors of objects Surface may not be described explicitly Visible Human (National Library of Medicine)
Point based Rendering
 Point based Rendering CS535 Daniel Aliaga Current Standards Traditionally, graphics has worked with triangles as the rendering primitive Triangles are really just the lowest common denominator for surfaces
Chapter 24. Creating Surfaces for Displaying and Reporting Data
 Chapter 24. Creating Surfaces for Displaying and Reporting Data FLUENT allows you to select portions of the domain to be used for visualizing the flow field. The domain portions are called surfaces, and
Who has worked on a voxel engine before? Who wants to? My goal is to give the talk I wish I would have had before I started on our procedural engine.
 1 Who has worked on a voxel engine before? Who wants to? My goal is to give the talk I wish I would have had before I started on our procedural engine. Three parts to this talk. A lot of content, so I
Rendering Smoke & Clouds
 Rendering Smoke & Clouds Game Design Seminar 2007 Jürgen Treml Talk Overview 1. Introduction to Clouds 2. Virtual Clouds based on physical Models 1. Generating Clouds 2. Rendering Clouds using Volume Rendering
Introduction to 3D Graphics
 Graphics Without Polygons Volume Rendering May 11, 2010 So Far Volumetric Rendering Techniques Misc. So Far Extended the Fixed Function Pipeline with a Programmable Pipeline Programming the pipeline is
Advanced 3D-Data Structures
 Advanced 3D-Data Structures Eduard Gröller, Martin Haidacher Institute of Computer Graphics and Algorithms Vienna University of Technology Motivation For different data sources and applications different
Course Review. Computer Animation and Visualisation. Taku Komura
 Course Review Computer Animation and Visualisation Taku Komura Characters include Human models Virtual characters Animal models Representation of postures The body has a hierarchical structure Many types
Ray Casting of Trimmed NURBS Surfaces on the GPU
 Ray Casting of Trimmed NURBS Surfaces on the GPU Hans-Friedrich Pabst Jan P. Springer André Schollmeyer Robert Lenhardt Christian Lessig Bernd Fröhlich Bauhaus University Weimar Faculty of Media Virtual
Particle-Based Volume Rendering of Unstructured Volume Data
 Particle-Based Volume Rendering of Unstructured Volume Data Takuma KAWAMURA 1)*) Jorji NONAKA 3) Naohisa SAKAMOTO 2),3) Koji KOYAMADA 2) 1) Graduate School of Engineering, Kyoto University 2) Center for
Introduction to Scientific Visualization
 Introduction to Scientific Visualization Aaron Birkland Cornell Center for Advanced Computing Data Analysis on Ranger January 2012 A lab-intensive workshop Start off with basic concepts Data, transformations,
MODELING AND HIERARCHY
 MODELING AND HIERARCHY Introduction Models are abstractions of the world both of the real world in which we live and of virtual worlds that we create with computers. We are all familiar with mathematical