Visualization & the CASA Viewer
|
|
|
- Annis McBride
- 6 years ago
- Views:
Transcription
1 Visualization & the Viewer Juergen Ott & the team Atacama Large Millimeter/submillimeter Array Expanded Very Large Array Robert C. Byrd Green Bank Telescope Very Long Baseline Array
2 Visualization Goals: exploration/exploitation of data and information enhancing understanding of concepts and processes gaining new (unexpected, profound) insights making invisible visible effective presentation of significant features quality control of measurements or simulations increasing scientific productivity medium of communication 2


3 Visualization 3
4 Visualization Astronomy datasets are n-dimensional An electric wave is described by Amp(RA, DEC, spectral/ velocity/energy, polarization, time [phase]) 4
5 Visualization Astronomy datasets are n-dimensional An electric wave is described by Amp(RA, DEC, spectral/ velocity/energy, polarization, time [phase]) Project a n-dimensional object on a 2-dimensional plane Add other dimensions through other means No other dimensions: projection of data, slices 5


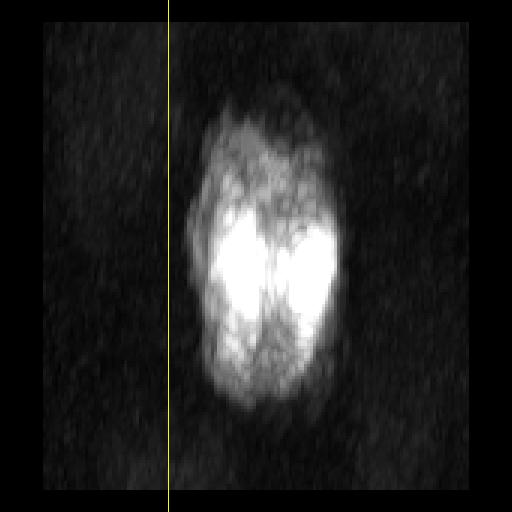
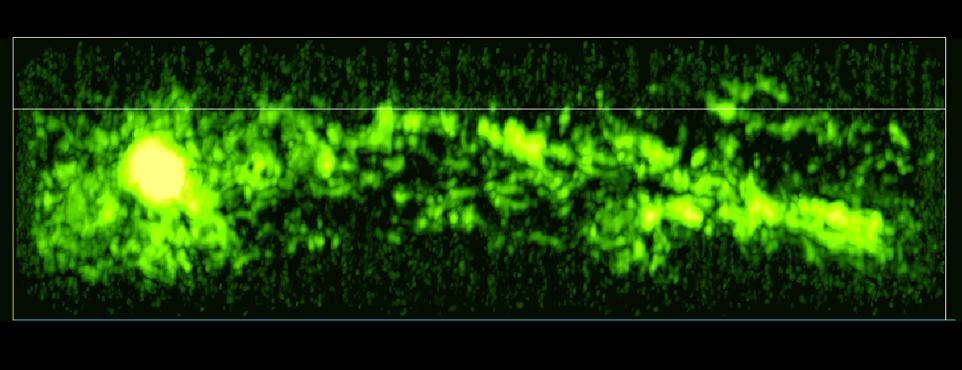
6 position Show only two dimensions at fixed values of all higher dimensions position Channel map Position-velocity map Fixed velocity, polarization, etc. One fixed position, polarization, etc.

7 Cube unfolded 7
8 Visualization Astronomy datasets are n-dimensional An electric wave is described by Amp(RA, DEC, spectral/ velocity/energy, polarization, time [phase]) Project a n-dimensional object on a 2-dimensional plane Add other dimensions through other means No other dimensions: projection of data, slices Time/movies 8
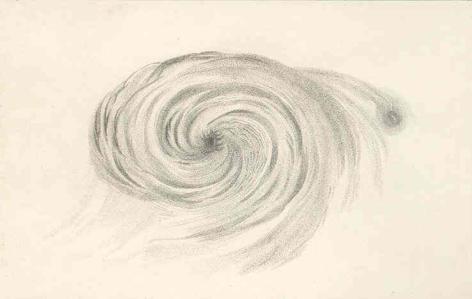
9 Movies: Time is used to display information (e.g. velocity) along other dimensions


10 Movies: Time is used to display information (e.g. velocity) along other dimensions Galaxy with a flat rotation curve
11 Visualization Astronomy datasets are n-dimensional An electric wave is described by Amp(RA, DEC, spectral/ velocity/energy, polarization, time [phase]) Project a n-dimensional object on a 2-dimensional plane Add other dimensions through other means No other dimensions: projection of data, slices Time/movies Projection can also show combinations of dimensions, rotation of cubes, volume rendering/opaqueness 11


12 Warning: Rendering also allows for mixing of dimensions Rendering requires transparency or opaqueness to be applied to a datacube. The displayed images are a combination of different planes. Many different algorithms/parameters possible.
13
14 14
15 15
16 Visualization Astronomy datasets are n-dimensional An electric wave is described by Amp(RA, DEC, spectral/ velocity/energy, polarization, time [phase]) Project a n-dimensional object on a 2-dimensional plane Add other dimensions through other means No other dimensions: projection of data, slices Time/movies Projection can also show combinations of dimensions, rotation of cubes, volume rendering/opaqueness Collapse can be in different ways, e.g. moment maps, peak flux maps, medians, etc. 16


17 Moment 0/ Integrated intensity Moment 1/ Intensity-weighted velocity Moment 2/ Velocity dispersion 17
18 Visualization Astronomy datasets are n-dimensional An electric wave is described by Amp(RA, DEC, spectral/ velocity/energy, polarization, time [phase]) Project a n-dimensional object on a 2-dimensional plane Add other dimensions through other means No other dimensions: projection of data, slices Time/movies Projection can also show combinations of dimensions, rotation of cubes, volume rendering/opaqueness Collapse can be in different ways, e.g. moment maps, peak flux maps, medians, etc. Can be combined, e.g. brightness/hue 18

19
20 Visualization Astronomy datasets are n-dimensional An electric wave is described by Amp(RA, DEC, spectral/ velocity/energy, polarization, time [phase]) Project a n-dimensional object on a 2-dimensional plane Add other dimensions through other means No other dimensions: projection of data, slices Time/movies Projection can also show combinations of dimensions, rotation of cubes, volume rendering/opaqueness Collapse can be in different ways, e.g. moment maps, peak flux maps, medians, etc. Can be combined, e.g. brightness/hue Contours, markers, vectors 20
21 21
22 Visualization Astronomy datasets are n-dimensional An electric wave is described by Amp(RA, DEC, spectral/ velocity/energy, polarization, time [phase]) Project a n-dimensional object on a 2-dimensional plane Add other dimensions through other means No other dimensions: projection of data, slices Time/movies Projection can also show combinations of dimensions, rotation of cubes, volume rendering/opaqueness Collapse can be in different ways, e.g. moment maps, peak flux maps, medians, etc. Can be combined, e.g. brightness/hue Contours, markers, vectors Combinations, e.g. Renzogram 22
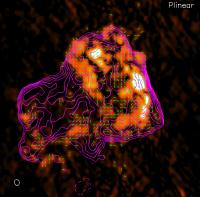
23 Limitations Renzogram Pick a level at each plane, e.g. 1Jy, 80% of peak Display structure as contour, color indicates plane/velocity 23
24 Visualization Astronomy datasets are n-dimensional An electric wave is described by Amp(RA, DEC, spectral/ velocity/energy, polarization, time [phase]) Project a n-dimensional object on a 2-dimensional plane Add other dimensions through other means No other dimensions: projection of data, slices Time/movies Projection can also show combinations of dimensions, rotation of cubes, volume rendering/opaqueness Collapse can be in different ways, e.g. moment maps, peak flux maps, medians, etc. Can be combined, e.g. brightness/hue Contours, markers, vectors Combinations, e.g. Renzogram Polarization is used e.g. in 3d-movies 24
![Visualization Astronomy datasets are n-dimensional An electric wave is described by Amp(RA, DEC, spectral/ velocity/energy, polarization, time [phase]) Project a n-dimensional object on a](/docs-images/74/70881667/images/25-0.jpg "2-dimensional plane Add other dimensions through other means No other dimensions: projection of data, slices Time/movies Projection can also show combinations of dimensions, rotation of cubes, volume")
25 Visualization Astronomy datasets are n-dimensional An electric wave is described by Amp(RA, DEC, spectral/ velocity/energy, polarization, time [phase]) Project a n-dimensional object on a 2-dimensional plane Add other dimensions through other means No other dimensions: projection of data, slices Time/movies Projection can also show combinations of dimensions, rotation of cubes, volume rendering/opaqueness Collapse can be in different ways, e.g. moment maps, peak flux maps, medians, etc. Can be combined, e.g. brightness/hue Contours, markers, vectors Combinations, e.g. Renzogram Polarization is used e.g. in 3d-movies 25
26 Visualization Problems: Third axis is usually NOT spatial but spectral à requires some experience to interpret and not get fooled Signal to noise à smoothing, tessellation, etc. Richness of spectrum à Many lines in bright objects à Requires careful separation à Hyperfine lines 26

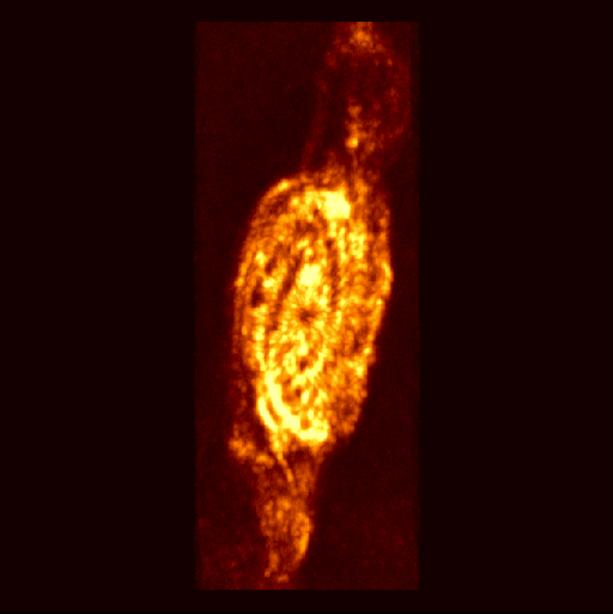
27 Visualization Many lines in single datacube NGC 253, ALMA: Walter et al. 2014, in prep. 27

28 Visualization Line identification Function of Frequency & position NGC 253, ALMA: Walter et al. 2014, in prep. 28
29 Common Astronomy Software Applications Data reduction packet for ALMA and Jansky VLA load, edit, calibrate, image, analyze, and visualize interferometric datasets Single dish component for ALMA ~14 developers at NRAO, ESO, NAOJ, plus a few associated programmers at ASTRON, CSIRO/CASS and other institutions Some developers are computing scientists with dedicated algorithm development time release about ~6 months, intermediate stable versions Linux and MacOS Python based layer for the user interface and easy scripting with C++ code underneath for performance 29
30 Common Astronomy Software Applications Data reduction packet for ALMA and Jansky VLA ALMA: 50x12m + 12x7m +4x12m TP Jansky VLA: 28x25m Commonalities: Aperture synthesis radio Interferometers (i.e. they measure complex visibilities [amp/phase]) Similar raw data format Same basic data reduction & imaging steps 30
,")
 - Hybrid imaging, short/zero spacing - calibration on planets/moons Jansky")
![VLA: 28x25m - cm ([0.07] 0.](/docs-images/74/70881667/images/31-2.jpg "330-50 GHz) - Sensitive to terrestrial Radio interference - Large fractional")
31 Common Astronomy Software Applications Data reduction packet for ALMA and Jansky VLA ALMA: 50x12m + 12x7m +4x12m TP Differences: - Sub mm ([30] [950+]GHz), large kλ - Water vapor (opacity, phase rms, atm. lines) - Hybrid imaging, short/zero spacing - calibration on planets/moons Jansky VLA: 28x25m - cm ([0.07] GHz) - Sensitive to terrestrial Radio interference - Large fractional bandwidth e.g. 1-2GHz - High dynamic range imaging - 1 st JVLA sidelobe ~ VLA sensitivity 31
32 viewer Display of multidimensional datasets Measurement sets (visibilities) and 4dim image cubes MS can be inspected and edited Images can be viewed and inspected, and hardcopies can be obtained Limited scriptability at this stage Image manipulation and analysis methods can be invoked, newly created datasets saved Viewer component is optimized to optical IFUs, in particular for MUSE data 32
 global spectral template removal (simpler in radio) Measurement is in wavelengths for optical data, in frequencies for radio data optical data: non-linear radio")
 Errors in optical data pixel/spaxel based (error cubes) smoother error dependence on frequency and position in radio Optical: Poisson noise,")
33 viewer Visualization is very similar with RA/DEC/Vel cubes BUT Optical data can come in different fashions (lenslet, slicer, fibers, etc.) global spectral template removal (simpler in radio) Measurement is in wavelengths for optical data, in frequencies for radio data optical data: non-linear radio velocity frame radio data: non-linear optical velocity frame optical =/= radio velocity frame Changes in the psf and fov (primary beam) can be more drastic in the radio (Δν/ν up to 1) Errors in optical data pixel/spaxel based (error cubes) smoother error dependence on frequency and position in radio Optical: Poisson noise, Radio: Thermal noise (plus sidelobes) 33

34 Image Access Supported Image Formats: FITS, Miriad, Preview of image data Sub-image Capability Efficient Preload Lattice Expression Language (LEL)

35 Image / Cube Display Display one or more images OTF Spatial Frame Transform Overlay contours and vectors on raster images Multiple Color Maps Flexible adjustments of the transfer function


36 Animators Step through planes of cube, or between images Standard tapedeck controls 36

37 Image Exploration Multiple regions can be defined Saving, dragging, iterating Statistics on full image stack can be shown Dragging regions, and reselection them is supported 37


38 Image Exploration Multi-Path Spatial Image Profiling 38


39 Cube Exploration Position-Velocity Diagram 39


40 Integrated Processing The viewer uses the package to provide more sophisticated integrated processing capabilities Moments Collapse Source Finding, extraction 40

41 Spectral Processing Spectral Profile Generation For each region Fitting Polynomial and Gaussian Graphical Estimates OTF Spectral Smoothing Line Labeling Splatalog Change Rest Frequencies 41

42 Spectral Processing can fit multiple Gaussians Over a region Pixel by pixel 42

43 Histogram Generation 43
44 Limitations viewer not optimized for remote operations The rendering and advanced visualization tools are not yet implemented as other issues were more pressing Only rudimentary scripting abilities Image renderer has only limited publication quality Monolithic approach, closed development Lots of new features recently, now time to improve stability Future: Virtual Observatory integration merging the viewer with CyberSKA development ALMA funding process underway, PI: Erik Rosolowsky (U Alberta) 44
45 VO Integration NRAO is collaborating with VAO to add VO support directly to the Viewer. Data discovery and selection: Either within the viewer or through VO web portals Seamless display of data from VO service Advanced cube access including: Sub-selection (Spatial or Spectral) Basic Collapse Options 45

46 CyberSKA The image cannot displayed. Your computer may not have enough memory to open the image, or the image may have been corrupted. Restart your computer, and then open the file again. If the red x still appears, you may have to delete the image and then insert it again. Browser-based PI: Erik Rosolowsky Cube-enabled


47 Best of Both Worlds Viewer Fully-featured Meets ALMA use cases Well-developed analytics Expert user-base CyberSKA Viewer Handles Big data Web-enabled Additional features Plugin architecture

48 Server-client architecture, e.g. for archival data


49 Pluggable Anyone can write plugins for visualization techniques, renderers, etc. Repository of plugins


50 viewer demo at the ALMA workshop The image cannot be displayed. Your computer may not have enough memory to open the image, or the image may have been corrupted. Restart your computer, and then open the file again. If the red x still appears, you may have to delete the image and then insert it again.
CASA Status. Crystal Brogan (subsystem scientist) ASAC Meeting, March 9, 2010 Mitaka, Japan. NRAO/North American ALMA Science Center
 ASAC Meeting, March 9, 2010 Mitaka, Japan. NRAO/North American ALMA Science Center") Status ASAC Meeting, March 9, 2010 Mitaka, Japan Crystal Brogan (subsystem scientist) NRAO/North American ALMA Science Center Atacama Large Millimeter/submillimeter Array Expanded Very Large Array Robert
Status ASAC Meeting, March 9, 2010 Mitaka, Japan Crystal Brogan (subsystem scientist) NRAO/North American ALMA Science Center Atacama Large Millimeter/submillimeter Array Expanded Very Large Array Robert
Data Analysis. I have got some data, so what now? Naomi McClure-Griffiths CSIRO Australia Telescope National Facility 2 Oct 2008
 Data Analysis I have got some data, so what now? Naomi McClure-Griffiths CSIRO Australia Telescope National Facility 2 Oct 2008 1 Outline Non-imaging analysis Parameter estimation Point source fluxes,
Imaging and Deconvolution
 Imaging and Deconvolution Urvashi Rau National Radio Astronomy Observatory, Socorro, NM, USA The van-cittert Zernike theorem Ei E V ij u, v = I l, m e sky j 2 i ul vm dldm 2D Fourier transform : Image
VERY LARGE TELESCOPE 3D Visualization Tool Cookbook
 European Organisation for Astronomical Research in the Southern Hemisphere VERY LARGE TELESCOPE 3D Visualization Tool Cookbook VLT-SPE-ESO-19500-5652 Issue 1.0 10 July 2012 Prepared: Mark Westmoquette
Using CASA to Simulate Interferometer Observations
 Using CASA to Simulate Interferometer Observations Nuria Marcelino North American ALMA Science Center Atacama Large Millimeter/submillimeter Array Expanded Very Large Array Robert C. Byrd Green Bank Telescope
Continuum error recognition and error analysis
 Continuum error recognition and error analysis Robert Laing (ESO) 1 Outline Error recognition: how do you recognise and diagnose residual errors by looking at images? Image analysis: how do you extract
ALMA REMOTE MINING EXPERIMENT ARTEMIX. Yaye Awa Ba, Philippe. Salomé, Michel. Caillat (LERMA) with credits to : L. Loria, N.
 with credits to : L. Loria, N.") ALMA REMOTE MINING EXPERIMENT Yaye Awa Ba, Philippe. Salomé, Michel. Caillat (LERMA) with credits to : L. Loria, N. Kasradze Archive and Data Mining Goals (i) Search by products not by instrumental configuration
ALMA REMOTE MINING EXPERIMENT Yaye Awa Ba, Philippe. Salomé, Michel. Caillat (LERMA) with credits to : L. Loria, N. Kasradze Archive and Data Mining Goals (i) Search by products not by instrumental configuration
Getting the most out of your ALMA DATA with ADMIT: The ALMA DATA Mining Toolkit
 Getting the most out of your ALMA DATA with : The ALMA DATA Mining Toolkit Lee Mundy, Leslie Looney, Peter Teuben, Doug Friedel, Marc Pound, Lisa Xu, Kevin Rauch, Robert Harris, Jeff Kern, & team : ALMA
CASA. Emmanuel Momjian (NRAO)
") CASA Emmanuel Momjian (NRAO) Atacama Large Millimeter/submillimeter Array Karl G. Jansky Very Large Array Robert C. Byrd Green Bank Telescope Very Long Baseline Array CASA CASA is the offline data reduction
CASA Emmanuel Momjian (NRAO) Atacama Large Millimeter/submillimeter Array Karl G. Jansky Very Large Array Robert C. Byrd Green Bank Telescope Very Long Baseline Array CASA CASA is the offline data reduction
Pipelines! Loránt Sjouwerman. An NSF Facility
 An NSF Facility Pipelines! Loránt Sjouwerman Atacama Large Millimeter/submillimeter Array Karl G. Jansky Very Large Array Robert C. Byrd Green Bank Telescope Very Long Baseline Array Aim Radio interferometry
Introduction to CASA and Data Structure. Emmanuel Momjian
 Introduction to CASA and Data Structure Emmanuel Momjian 1 CASA CASA is the offline data reduction package for ALMA and the (Jansky) VLA data from other telescopes usually work, too, but not primary goal
ERROR RECOGNITION and IMAGE ANALYSIS
 PREAMBLE TO ERROR RECOGNITION and IMAGE ANALYSIS 2 Why are these two topics in the same lecture? ERROR RECOGNITION and IMAGE ANALYSIS Ed Fomalont Error recognition is used to determine defects in the data
ALMA Antenna responses in CASA imaging
 ALMA Antenna responses in CASA imaging Dirk Petry (ESO), December 2012 Outline Motivation ALBiUS/ESO work on CASA responses infrastructure and ALMA beam library First test results 1 Motivation ALMA covers
FIFI-LS: Basic Cube Analysis using SOSPEX
 FIFI-LS: Basic Cube Analysis using SOSPEX Date: 1 Oct 2018 Revision: - CONTENTS 1 INTRODUCTION... 1 2 INGREDIENTS... 1 3 INSPECTING THE CUBE... 3 4 COMPARING TO A REFERENCE IMAGE... 5 5 REFERENCE VELOCITY
Case Study: CyberSKA - A Collaborative Platform for Data Intensive Radio Astronomy
 Case Study: CyberSKA - A Collaborative Platform for Data Intensive Radio Astronomy Outline Motivation / Overview Participants / Industry Partners Documentation Architecture Current Status and Services
ALMA Software development. George KOSUGI: NAOJ, ALMA ICT-EA Manager
 ALMA Software development George KOSUGI: NAOJ, ALMA ICT-EA Manager Contents ALMA Software Developments in EU (ESO) ALMA Software Developments in NA (NRAO) ALMA+ Software Developments in EA (NAOJ) Development
Using CASA to Simulate Interferometer Observations
 Using CASA to Simulate Interferometer Observations Nuria Marcelino North American ALMA Science Center Atacama Large Millimeter/submillimeter Array Expanded Very Large Array Robert C. Byrd Green Bank Telescope
OSKAR-2: Simulating data from the SKA
 OSKAR-2: Simulating data from the SKA AACal 2012, Amsterdam, 13 th July 2012 Fred Dulwich, Ben Mort, Stef Salvini 1 Overview OSKAR-2: Interferometer and beamforming simulator package. Intended for simulations
Adaptive selfcalibration for Allen Telescope Array imaging
 Adaptive selfcalibration for Allen Telescope Array imaging Garrett Keating, William C. Barott & Melvyn Wright Radio Astronomy laboratory, University of California, Berkeley, CA, 94720 ABSTRACT Planned
Image Pixelization and Dynamic Range
 EVLA Memo 114 Image Pixelization and Dynamic Range W. D. Cotton, Juan M. Uson NRAO 1 Abstract This study investigates some of the effects of representing the sky by a rectangular grid of pixels on the
esac PACS Spectrometer: forward model tool for science use
 esac European Space Astronomy Centre (ESAC) P.O. Box, 78 28691 Villanueva de la Cañada, Madrid Spain PACS Spectrometer: forward model tool for science use Prepared by Elena Puga Reference HERSCHEL-HSC-TN-2131
Synthesis Imaging. Claire Chandler, Sanjay Bhatnagar NRAO/Socorro
 Synthesis Imaging Claire Chandler, Sanjay Bhatnagar NRAO/Socorro Michelson Summer Workshop Caltech, July 24-28, 2006 Synthesis Imaging 2 Based on the van Cittert-Zernike theorem: The complex visibility
Focus Session on Multi-dimensional Data
 Focus Session on Multi-dimensional Data Introduction Mark Allen, Joe Lazio IVOA Interoperability Meeting, ESAC, Madrid, May 20, 2014 CoSADIE Project Science Priority Areas Multi-dimensional Data image:
Presentation and analysis of multidimensional data sets
 Presentation and analysis of multidimensional data sets Overview 1. 3D data visualisation Multidimensional images Data pre-processing Visualisation methods Multidimensional images wavelength time 3D image
Data products. Dario Fadda (USRA) Pipeline team Bill Vacca Melanie Clarke Dario Fadda
 Pipeline team Bill Vacca Melanie Clarke Dario Fadda") Data products Dario Fadda (USRA) Pipeline team Bill Vacca Melanie Clarke Dario Fadda Pipeline (levels 1 à 2) The pipeline consists in a sequence of modules. For each module, files are created and read
Data products Dario Fadda (USRA) Pipeline team Bill Vacca Melanie Clarke Dario Fadda Pipeline (levels 1 à 2) The pipeline consists in a sequence of modules. For each module, files are created and read
ERROR RECOGNITION & IMAGE ANALYSIS. Gustaaf van Moorsel (NRAO) Ed Fomalont (NRAO) Twelfth Synthesis Imaging Workshop 2010 June 8-15
 Ed Fomalont (NRAO) Twelfth Synthesis Imaging Workshop 2010 June 8-15") ERROR RECOGNITION & IMAGE ANALYSIS Gustaaf van Moorsel (NRAO) Ed Fomalont (NRAO) Twelfth Synthesis Imaging Workshop 2010 June 8-15 INTRODUCTION Why are these two topics Error Recognition and Image Analysis
ERROR RECOGNITION & IMAGE ANALYSIS Gustaaf van Moorsel (NRAO) Ed Fomalont (NRAO) Twelfth Synthesis Imaging Workshop 2010 June 8-15 INTRODUCTION Why are these two topics Error Recognition and Image Analysis
ALMA simulations Rosita Paladino. & the Italian ARC
 ALMA simulations Rosita Paladino & the Italian ARC Two software tools available to help users simulate images resulting from an ALMA observations: Simulations with CASA tasks sim_observe & sim_analyze
ALMA Science Pipeline Quickstart Guide
 Doc 2.13, ver. 2.0 August 2015 ALMA Science Pipeline Quickstart Guide Pipeline CASA 4.3.1 ALMA, an international astronomy facility, is a partnership of Europe, North America and East Asia in cooperation
The ALMA Pipeline. Introduction Pipeline Subsystem Heuristics Task Interface Tests / Commissioning Results Demos. D. Muders, MPIfR L.
 The ALMA Pipeline Introduction Pipeline Subsystem Heuristics Task Interface Tests / Commissioning Results Demos D. Muders, MPIfR L. Davis, NRAO 1 Introduction ALMA must be available to all of the astronomical
How accurately do our imaging algorithms reconstruct intensities and spectral indices of weak sources?
 How accurately do our imaging algorithms reconstruct intensities and spectral indices of weak sources? Urvashi Rau, Sanjay Bhatnagar, Frazer Owen ( NRAO ) 29th Annual New Mexico Symposium, NRAO, Socorro,
ADVANCED RADIO INTERFEROMETRIC IMAGING
 ADVANCED RADIO INTERFEROMETRIC IMAGING Hayden Rampadarath Based upon J. Radcliffe's DARA presentation Image courtesy of NRAO/AUI INTR ODU CT ION In the first imaging lecture, we discussed the overall and
ALMA Science Pipeline Quickstart Guide
 Doc 2.13, ver. 1.0 September 2014 ALMA Science Pipeline Quickstart Guide ALMA, an international astronomy facility, is a partnership of Europe, North America and East Asia in cooperation with the Republic
Velocity Cubes of Galaxies Discover /Propose /Extract SIAv2 /DataLink /AccessData
 Velocity Cubes of Galaxies Discover /Propose /Extract SIAv2 /DataLink /AccessData User Experience on Prototype Implementation José Enrique Ruiz Instituto de Astrofísica de Andalucía CSIC Fall 2014 IVOA
ALMA Memo 386 ALMA+ACA Simulation Tool J. Pety, F. Gueth, S. Guilloteau IRAM, Institut de Radio Astronomie Millimétrique 300 rue de la Piscine, F-3840
 ALMA Memo 386 ALMA+ACA Simulation Tool J. Pety, F. Gueth, S. Guilloteau IRAM, Institut de Radio Astronomie Millimétrique 300 rue de la Piscine, F-38406 Saint Martin d'h eres August 13, 2001 Abstract This
CASA Joe McMullin J. McMullin EVLA Advisory Committee Meeting September 6-7, 2007
 CASA Joe McMullin Outline Organization Purpose/Census Current Status Schedule Testing/Community Use of CASA Demo 2 CASA Organization N. Radziwill End to End Operations J. McMullin Development Lead Scientific
High Dynamic Range Imaging
 High Dynamic Range Imaging Josh Marvil CASS Radio Astronomy School 3 October 2014 CSIRO ASTRONOMY & SPACE SCIENCE High Dynamic Range Imaging Introduction Review of Clean Self- Calibration Direction Dependence
3D visualization of astronomy data using immersive displays
 ithes coffee meeting Riken 2016-12-09 3D visualization of astronomy data using immersive displays Gilles Ferrand Research Scientist Astrophysical Big Bang Laboratory 01 A collaboration Astronomy Computer
Empirical Parameterization of the Antenna Aperture Illumination Pattern
 Empirical Parameterization of the Antenna Aperture Illumination Pattern Preshanth Jagannathan UCT/NRAO Collaborators : Sanjay Bhatnagar, Walter Brisken Measurement Equation The measurement equation in
Advanced Multi-Beam Spect rom et er for t he GBT
 Advanced Multi-Beam Spect rom et er for t he Conceptual Software Design Amy Shelton, Patrick Brandt, Bob Garwood, Joe Masters, Mark Whitehead NRAO and U.C. Berkeley Joint Conceptual Design Review January
Sky-domain algorithms to reconstruct spatial, spectral and time-variable structure of the sky-brightness distribution
 Sky-domain algorithms to reconstruct spatial, spectral and time-variable structure of the sky-brightness distribution Urvashi Rau National Radio Astronomy Observatory Socorro, NM, USA Outline : - Overview
CASA. Algorithms R&D. S. Bhatnagar. NRAO, Socorro
 Algorithms R&D S. Bhatnagar NRAO, Socorro Outline Broad areas of work 1. Processing for wide-field wide-band imaging Full-beam, Mosaic, wide-band, full-polarization Wide-band continuum and spectral-line
CyberSKA: Project Update. Cameron Kiddle, CyberSKA Technical Coordinator
 CyberSKA: Project Update Cameron Kiddle, CyberSKA Technical Coordinator What is CyberSKA? Initiative to develop a scalable and distributed cyberinfrastructure platform to meet evolving science needs of
Primary Beams & Radio Interferometric Imaging Performance. O. Smirnov (Rhodes University & SKA South Africa)
") Primary Beams & Radio Interferometric Imaging Performance O. Smirnov (Rhodes University & SKA South Africa) Introduction SKA Dish CoDR (2011), as summarized by Tony Willis: My sidelobes are better than
Primary Beams & Radio Interferometric Imaging Performance O. Smirnov (Rhodes University & SKA South Africa) Introduction SKA Dish CoDR (2011), as summarized by Tony Willis: My sidelobes are better than
Lecture 17 Reprise: dirty beam, dirty image. Sensitivity Wide-band imaging Weighting
 Lecture 17 Reprise: dirty beam, dirty image. Sensitivity Wide-band imaging Weighting Uniform vs Natural Tapering De Villiers weighting Briggs-like schemes Reprise: dirty beam, dirty image. Fourier inversion
GBT Memo #300: Correcting ALMA 12-m Array Data for Missing Short Spacings Using the Green Bank Telescope
 GBT Memo #300: Correcting ALMA 12-m Array Data for Missing Short Spacings Using the Green Bank Telescope Melissa Hoffman and Amanda Kepley 28 September 2018 Contents 1 Introduction 1 2 Data 2 2.1 Observations
Display. Introduction page 67 2D Images page 68. All Orientations page 69 Single Image page 70 3D Images page 71
 Display Introduction page 67 2D Images page 68 All Orientations page 69 Single Image page 70 3D Images page 71 Intersecting Sections page 71 Cube Sections page 72 Render page 73 1. Tissue Maps page 77
Imaging and non-imaging analysis
 1 Imaging and non-imaging analysis Greg Taylor University of New Mexico Spring 2017 Plan for the lecture-i 2 How do we go from the measurement of the coherence function (the Visibilities) to the images
Computational issues for HI
 Computational issues for HI Tim Cornwell, Square Kilometre Array How SKA processes data Science Data Processing system is part of the telescope Only one system per telescope Data flow so large that dedicated
NRAO VLA Archive Survey
 NRAO VLA Archive Survey Jared H. Crossley, Loránt O. Sjouwerman, Edward B. Fomalont, and Nicole M. Radziwill National Radio Astronomy Observatory, 520 Edgemont Road, Charlottesville, Virginia, USA ABSTRACT
Basic Imaging and Self- Calibration (T4 + T7)
") Basic Imaging and Self- Calibration (T4 + T7) John McKean Visibilities Fourier Transform Deconvolution AIM: 1. To make an image by taking the fast Fourier transform of the visibility data. 2. Carry out
Basic Imaging and Self- Calibration (T4 + T7) John McKean Visibilities Fourier Transform Deconvolution AIM: 1. To make an image by taking the fast Fourier transform of the visibility data. 2. Carry out
style Click to edit Master text Click to edit Master subtitle style Rodrigo Améstica Click to edit Master text styles
 Correlator DataMaster Processor Click to edit title Click to edit Master subtitle style style Click to edit Master text Rodrigo Améstica Click to edit Master text styles Atacama Large Millimeter/submillimeter
PACS SPECTROMETER SPATIAL CALIBRATION
 PACS SPECTROMETER SPATIAL CALIBRATION A. Contursi Herschel Calibration workshop 18-20 January ESAC Spatial Calibration Observations summary 40x40 chopped raster at chopper position 0 on Neptune, step size
The Virtual Observatory in Australia Connecting to International Initiatives. Peter Lamb. CSIRO Mathematical & Information Sciences
 The Virtual Observatory in Australia Connecting to International Initiatives Peter Lamb CSIRO Mathematical & Information Sciences The Grid & escience Convergence of high-performance computing, huge data
Volocity ver (2013) Standard Operation Protocol
 Standard Operation Protocol") Faculty Core Facility Volocity 6.3.0 (2013) SOP A-1 Volocity ver. 6.3.0 (2013) Standard Operation Protocol Faculty Core Facility Volocity 6.3.0 (2013) SOP A-2 A. Content Overview. 3 Start up. 3 Change
Faculty Core Facility Volocity 6.3.0 (2013) SOP A-1 Volocity ver. 6.3.0 (2013) Standard Operation Protocol Faculty Core Facility Volocity 6.3.0 (2013) SOP A-2 A. Content Overview. 3 Start up. 3 Change
Introduction to CASA
 Introduction to CASA Juergen Ott (CASA project scientist) Crystal Brogan (CASA ALMA subsystem scientist) Steven Myers (CASA EVLA subsystem scientist) Jeff Kern (CASA manager) ALMA EVLA CASA (Common Astronomy
Access to Multidimensional (Cube) Data in the VO
 Data in the VO") Access to Multidimensional (Cube) Data in the VO Use Cases, Analysis, and Architecture PREPARED BY ORGANIZATION DATE Douglas Tody NRAO April 15, 2013 Arnold Rots SAO Bruce Berriman IPAC Mark Cresitello-Dittmar
Access to Multidimensional (Cube) Data in the VO Use Cases, Analysis, and Architecture PREPARED BY ORGANIZATION DATE Douglas Tody NRAO April 15, 2013 Arnold Rots SAO Bruce Berriman IPAC Mark Cresitello-Dittmar
OSKAR: Simulating data from the SKA
 OSKAR: Simulating data from the SKA Oxford e-research Centre, 4 June 2014 Fred Dulwich, Ben Mort, Stef Salvini 1 Overview Simulating interferometer data for SKA: Radio interferometry basics. Measurement
Image Analysis. Jim Lovell
 Image Analysis Jim Lovell ATNF Synthesis Imaging Workshop May 2003 What Do You Want to Measure? (What you want to do and how to do it.)! Flux density of components! Absolute positions! Relative positions
ESO SCIENCE DATA PRODUCTS STANDARD. Doc. No. GEN-SPE-ESO , Issue 5. Addendum. Date: 15/07/2015. Integral Field Spectroscopy: 3D Data Cubes
 ESO SCIENCE DATA PRODUCTS STANDARD Doc. No. GEN-SPE-ESO-33000-5335, Issue 5 Addendum Date: 15/07/2015 Integral Field Spectroscopy: 3D Data Cubes The data format being defined in this section applies to
Imaris 4.2 user information
 Imaris 4.2 user information There is also a manual to help you use Imaris. It is on the shelf above the Windows machine, to the left of the Adobe box. Please make sure you return it there when you are
IRAM Memo MAPPING for NOEMA: Concepts and Usage
 Original version at http://iram-institute.org/medias/uploads/mapping-noema.pdf IRAM Memo 2016-1 MAPPING for NOEMA: Concepts and Usage S. Guilloteau 1 1. LAB (Bordeaux) 14-Jul-2016 version 1.0 09-Sep-2016
Analysing ALMA data - the CASA software package
 Analysing ALMA data the CASA software package Dirk Petry (ESO), June 2010 Outline What is CASA? main features Who develops CASA? development team What are the main requirements and how does CASA meet them?
Use case: mapping sparse spatial data with TOPCAT
 Use case: mapping sparse spatial data with TOPCAT This use case describes a workflow related to large hyperspectral datasets. In this example you will use data from the VIRTIS/Rosetta experiment and study
Wideband Mosaic Imaging for VLASS
 Wideband Mosaic Imaging for VLASS Preliminary ARDG Test Report U.Rau & S.Bhatnagar 29 Aug 2018 (1) Code Validation and Usage (2) Noise, Weights, Continuum sensitivity (3) Imaging parameters (4) Understanding
Radio Interferometry Bill Cotton, NRAO. Basic radio interferometry Emphasis on VLBI Imaging application
 Radio Interferometry Bill Cotton, NRAO Basic radio interferometry Emphasis on VLBI Imaging application 2 Simplest Radio Interferometer Monochromatic, point source 3 Interferometer response Adding quarter
RT_Image v0.2β User s Guide
 RT_Image v0.2β User s Guide RT_Image is a three-dimensional image display and analysis suite developed in IDL (ITT, Boulder, CO). It offers a range of flexible tools for the visualization and quantitation
Imaging and Deconvolution
 Imaging and Deconvolution David J. Wilner (Harvard-Smithsonian Center for Astrophysics) Fifteenth Synthesis Imaging Workshop 1-8 June 2016 Overview gain some intuition about interferometric imaging understand
Imaging and Deconvolution
 Imaging and Deconvolution 24-28 Sept 202 Narrabri, NSW, Australia Outline : - Synthesis Imaging Concepts - Imaging in Practice Urvashi Rau - Image-Reconstruction Algorithms National Radio Astronomy Observatory
OSKAR Settings Files Revision: 8
 OSKAR Settings Files Version history: Revision Date Modification 1 212-4-23 Creation. 2 212-5-8 Added default value column to settings tables. 3 212-6-13 Updated settings for version 2..2-beta. 4 212-7-27
Optics research for future receivers at NAOJ. Alvaro Gonzalez National Astronomical Observatory of Japan
 Optics research for future receivers at NAOJ Alvaro Gonzalez National Astronomical Observatory of Japan 1 Outline Follow up to presentations by: D. Iono, T. Kojima Optics for lower ALMA bands Band 1 (35
Exploiting Virtual Observatory and Information Technology: Techniques for Astronomy
 Exploiting Virtual Observatory and Information Technology: Techniques for Astronomy Nicholas Walton AstroGrid Project Scientist Institute of Astronomy, The University of Cambridge Lecture #3 Goal: Applications
What is visualization? Why is it important?
 What is visualization? Why is it important? What does visualization do? What is the difference between scientific data and information data Cycle of Visualization Storage De noising/filtering Down sampling
Deconvolution and Imaging ASTR 240: In-class activity, April 1, 2013
 Deconvolution and Imaging ASTR 240: In-class activity, April 1, 2013 In this activity, we will use calibrated visibilities from the Submillimeter Array to create an image of a disk around a nearby young
ENVI Classic Tutorial: Multispectral Analysis of MASTER HDF Data 2
 ENVI Classic Tutorial: Multispectral Analysis of MASTER HDF Data Multispectral Analysis of MASTER HDF Data 2 Files Used in This Tutorial 2 Background 2 Shortwave Infrared (SWIR) Analysis 3 Opening the
APEX Control System (APECS)
") APEX Control System (APECS) 1 The APEX control system: APECS 2 APECS Design APECS is designed as a pipeline system starting with a scan description ( scan object ) and eventually leading to data products
APEX Control System (APECS) 1 The APEX control system: APECS 2 APECS Design APECS is designed as a pipeline system starting with a scan description ( scan object ) and eventually leading to data products
Synthesis imaging using CASA
 Synthesis imaging using CASA Kuo-Song Wang ( 國松) and ARC-Taiwan team (ASIAA) UCAT Summer Student Program 2016 2016/06/30 Recap Radio interferometric observations The products from the array are Visibilities
Simulation and Auxiliary Data Management
 Simulation and Auxiliary Data Management Paola Sartoretti GEPI Meudon Simulation/Test and Auxiliary data! Test data are the simulated RVS data needed to test the data reduction algorithms. They are produced
Big data for big river science: data intensive tools, techniques, and projects at the USGS/Columbia Environmental Research Center
 Big data for big river science: data intensive tools, techniques, and projects at the USGS/Columbia Environmental Research Center Ed Bulliner U.S. Geological Survey, Columbia Environmental Research Center
CASA Pipelines. Liz Humphreys. ESO ALMA Regional Centre
 CASA Pipelines Liz Humphreys ESO ALMA Regional Centre Overview ALMA and VLA have CASA Pipelines Currently calibration only Diagnostic calibrator images ALMA science target imaging being commissioned The
JWST Pipeline & Data Products
 JWST Pipeline & Data Products Stage 1: Ramps-to-Slopes Karl D. Gordon JWST Calibration WG Lead Space Telescope Sci. Inst. Baltimore, MD, USA Stage 2: Calibrated Slopes Stage 3: Ensemble Processing Star
Argus Radio Telescope Architecture
 Argus Radio Telescope Architecture Douglas Needham http://cinnion.ka8zrt.com http://www.naapo.org Argus Architecture p.1/15 Introduction: Traditional Telescopes Radio telescopes commonly consist of a single
The Italian LBT spectroscopic data reduction pipeline
 LBTO 2017 Users' Meeting The Italian LBT spectroscopic data reduction pipeline Alida Marchetti INAF-IASF Milano Firenze, June 20th-23rd reduction pipeline SOME NUMBERS INAF nights 46 Effective observing
The ALMA Project Tracker reference manual for Principal Investigators
 Doc, ver. 1.5 May 2014 The ALMA Project Tracker reference manual for Principal Investigators ALMA, an international astronomy facility, is a partnership of Europe, North America and East Asia in cooperation
MASSACHUSETTS INSTITUTE OF TECHNOLOGY HAYSTACK OBSERVATORY
 MASSACHUSETTS INSTITUTE OF TECHNOLOGY HAYSTACK OBSERVATORY WESTFORD, MASSACHUSETTS 01886-1299 LOFAR MEMO #002 September 3, 2001 Phone: (978) 692-4764 Fax : (781) 981-0590 To: From: Subject: LOFAR Group
Prof. Fanny Ficuciello Robotics for Bioengineering Visual Servoing
 Visual servoing vision allows a robotic system to obtain geometrical and qualitative information on the surrounding environment high level control motion planning (look-and-move visual grasping) low level
Quicklook2 Users Manual v2.2
 Quicklook2 Users Manual v2.2 3D Image Analysis Software for FITS images Written by: Michael McElwain, Jason Weiss & Marshall Perrin UCLA Infrared Laboratory March 20, 2008 Table of Contents Table of Contents...
Tool collection b_tools_1 Help
 b_tools_1 help documentation 11/03/2015 1/8 Tool collection b_tools_1 Help credits Scripts in this collection were made by Bernhard Schaffer. Email: how.to.script@tavernmaker.de Web : http://dmscript.tavernmaker.de
ALMA Correlator Enhancement
 ALMA Correlator Enhancement Technical Perspective Rodrigo Amestica, Ray Escoffier, Joe Greenberg, Rich Lacasse, J Perez, Alejandro Saez Atacama Large Millimeter/submillimeter Array Karl G. Jansky Very
Ricksep: Interactive display of multi-dimensional data
 Stanford Exploration Project, Report 110, September 18, 2001, pages 1 172 Short Note Ricksep: Interactive display of multi-dimensional data Robert G. Clapp 1 INTRODUCTION SEP has always been interested
A first taste of Bbarolo: a 3D-fitting software to model the kinematics of disc galaxies
 PHISCC 2014 - Dwingeloo, March 18th A first taste of Bbarolo: a 3D-fitting software to model the kinematics of disc galaxies Enrico Di Teodoro University of Bologna Filippo Fraternali Tilted-ring model
GILDAS-Python binding
 GILDAS-Python binding Using Python from GILDAS, and vice-versa Sébastien BARDEAU, IRAM Grenoble MPIfR, 23-mar-2010 A kernel: SIC: Sympathetic Interpreter of Commands GreG: Grenoble Graphic The GILDAS software
3-D. Here red spheres show the location of gold nanoparticles inside/around a cell nucleus.
 3-D The CytoViva 3-D System allows the user can locate objects of interest in a 3-D space. It does this by acquiring multiple Z planes and performing our custom software routines to locate and observe
Lessons learnt from implementing mosaicing and faceting in ASKAPsoft. Max Voronkov & Tim Cornwell ASKAP team 2nd April 2009
 Lessons learnt from implementing mosaicing and faceting in ASKAPsoft Max Voronkov & Tim Cornwell ASKAP team 2nd April 2009 Outline - Imaging software ASKAPsoft re-uses LOFAR design Imaging is treated as
The Canadian CyberSKA Project
 The Canadian CyberSKA Project A. G. Willis (on behalf of the CyberSKA Project Team) National Research Council of Canada Herzberg Institute of Astrophysics Dominion Radio Astrophysical Observatory May 24,
ELT Science Case Evaluation. Using An HPC Portal
 ELT Science Case Evaluation Using An HPC Portal Peter Linde Lund Observatory peter@astro.lu.se Jonas Lindemann Center of Scientific and Technical Computing (LUNARC) jonas.lindemann@lunarc.lu.se ADASS,
High dynamic range imaging, computing & I/O load
 High dynamic range imaging, computing & I/O load RMS ~15µJy/beam RMS ~1µJy/beam S. Bhatnagar NRAO, Socorro Parameterized Measurement Equation Generalized Measurement Equation Obs [ S M V ij = J ij, t W
Correlator Field-of-View Shaping
 Correlator Field-of-View Shaping Colin Lonsdale Shep Doeleman Vincent Fish Divya Oberoi Lynn Matthews Roger Cappallo Dillon Foight MIT Haystack Observatory Context SKA specifications extremely challenging
Modeling Antenna Beams
 Modeling Antenna Beams Walter Brisken National Radio Astronomy Observatory 2011 Sept 22 1 / 24 What to learn from this talk EM simulations of antennas can be complicated Many people have spent careers
What is visualization? Why is it important?
 What is visualization? Why is it important? What does visualization do? What is the difference between scientific data and information data Visualization Pipeline Visualization Pipeline Overview Data acquisition
PERFORMANCE REPORT ESTEC. The spectral calibration of JWST/NIRSpec: accuracy of the instrument model for the ISIM-CV3 test cycle
 ESTEC European Space Research and Technology Centre Keplerlaan 1 2201 AZ Noordwijk The Netherlands www.esa.int PERFORMANCE REPORT The spectral calibration of JWST/NIRSpec: accuracy of the instrument model