Spatial data and QGIS
|
|
|
- Easter Young
- 6 years ago
- Views:
Transcription


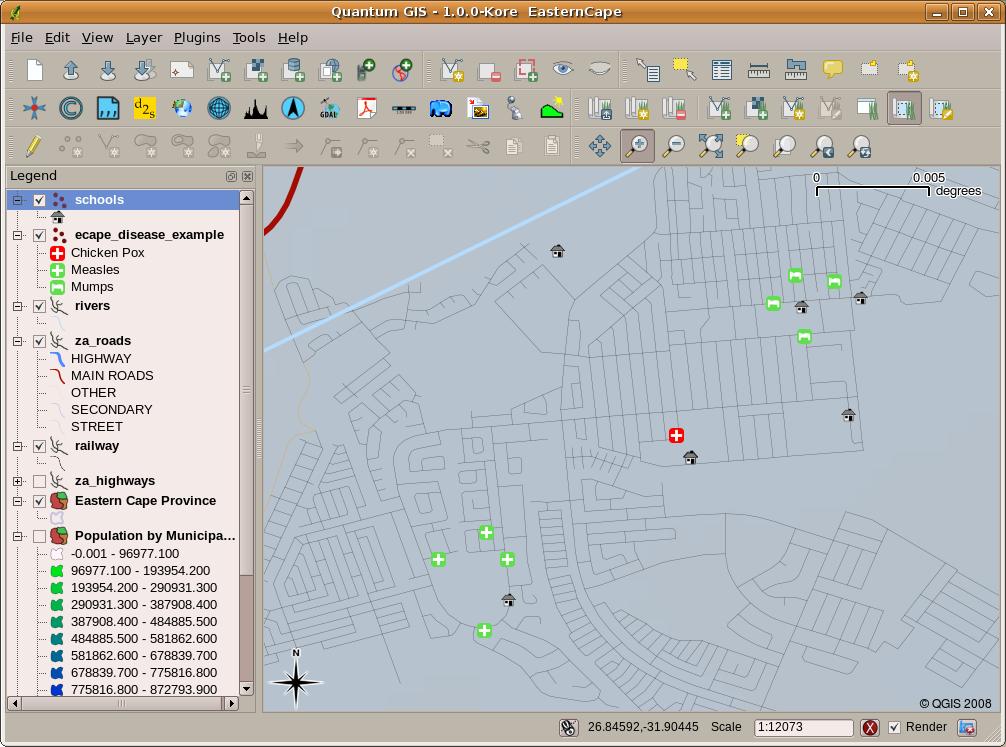
1 Spatial data and QGIS Xue Jingbo IT Center
2 A GIS consists of: Spatial Data. Computer Hardware. Computer Software.

3 Longitude Latitude Disease Date Mumps 13/12/ Mumps 24/12/ Mumps 22/01/ Measles 11/01/ Measles 26/01/ Measles 10/02/ Measles 22/02/ Mumps 02/02/ Chicken Pox 26/02/2009
4
5 More about GIS GIS started in the 1970 s. companies and universities anyone can use GIS software. become easier to use managing and using digital geographical data
6 2.Spatial Data Longitude Latitude Disease Date Mumps 13/12/2008 The longitude and latitude columns hold geographical data. The disease and date columns hold nongeographical data.
, lines (e.g. rivers) and polygons (e.")
7 Data types Vector data is stored as a series of X, Y coordinate pairs inside the computer s memory. Vector data is used to represent points, lines and areas. Vector data is used to represent points (e.g. towns), lines (e.g. rivers) and polygons (e.g. municipal boundaries).
8 Understanding of vector data models as used in GIS. Looking over a landscape you can see the main features, such as roads, houses and trees.
9 A point feature is described by its X, Y and optionally Z coordinate. The point attributes describe the point e.g. if it is a tree or a lamp post. A polyline is a sequence of joined vertices. Each vertex has an X, Y (and optionally Z) coordinate. Attributes describe the polyline. A polygon, like a polyline, is a sequence of vertices. However in a polygon, the first and last vertices are always at the same position.
10 Landscape features as we would present them in a GIS. Rivers (blue) and roads (green) can be represented as lines, trees as points (red) and houses as polygons (white).
11 Vector data in layers how vector data is managed and used in a GIS environment? Features in a layer have the same geometry type and the same kinds of attributes
12 Editing vector data a process called digitising- to create and modify the geometry data in a layer Creating and editing vector data is an important function of a GIS creating your own data
 map.")
13 Scale and vector data Vector data (red lines) that was digitised from a small scale (1: ) map. Vector data (green lines) that was digitised from a large scale (1:50 000) map.


14 Symbology In the GIS, you can use a panel (like the one above) to adjust how features in your layer should be drawn. When a layer (for example the trees layer above) is first loaded, a GIS application will give it a generic symbol. After making our adjustments it is much easier to see that our points represent trees.
15 What can we do with vector data in a GIS? which houses are within the 100 year flood level of a river? where is the best place to put a hospital so that it is easily accessible to as many people as possible? which learners live in a particular suburb?
.")
16 What have we learned? Vector data is used to represent real world features in a GIS. A vector feature can have a geometry type of point, line or a polygon. Each vector feature has attribute data that describes it. Feature geometry is described in terms of vertices. Point geometries are made up of a single vertex (X,Y and optionally Z). Polyline geometries are made up of two or more vertices forming a connected line. Polygon geometries are made up of at least four vertices forming an enclosed area. The first and last vertices are always in the same place. Choosing which geometry type to use depends on scale, convenience and what you want to do with the data in the GIS. Most GIS applications do not allow you to mix more than one geometry type in a single layer. Digitising is the process of creating digital vector data by drawing it in a GIS application. Vector data can have quality issues such as undershoots, overshoots and slivers which you need to be aware of. Vector data can be used for spatial analysis in a GIS application, for example to find the nearest hospital to a school.
17


18 The same raster data, but this time zoomed in. The grid nature of the data can be seen. Raster data are stored as a grid of values. There are many satellites circling the earth and the photographs they take are a kind of raster data that can be viewed in a GIS. One important difference between raster and vector Raster data are often images taken by satellites. Here we can see mountains in the Eastern Cape data is that if you zoom in too much on a raster image, it will start to appear blocky (see llustrations figure_raster_data and figure_raste r_data_zoom). In fact these blocks are the individual cells of the data grid that makes up the raster image. We will be looking at raster data in greater detail in later tutorials.
19 A raster dataset is composed of rows (running across) and columns (running down) of pixels (also know as cells). Each pixel represents a geographical region, and the value in that pixel represents some characteristic of that region.

20 Raster data in detail

21 An example that shows the difference between an image obtained from a satellite and one that shows calculated values can be seen in figure_raster_types.
22 Georeferencing the process of defining exactly stored with the digital version of the aerial photo positional information consists of a coordinate provided in a small text file accompanying the raster


23 Spatial Resolution This satellite image looks good when using a small scale but when viewed at a large scale you can see the individual pixels that the image is composed of.
24 Spectral resolution this RGB information is stored in separate colour bands record information from the non-visible parts of the spectrum the number of bands in a raster image is referred to as its spectral resolution If an image consists of only one band, it is often called a grayscale image
25 What have we learned about Raster? Raster data are a grid of regularly sized pixels. Raster data are good for showing continually varying information. The size of pixels in a raster determines its spatial resolution. Raster images can contain one or more bands, each covering the same spatial area, but containing different information. When raster data contains bands from different parts of the electromagnetic spectrum, they are called multi-spectral images. Three of the bands of a multi-spectral image can be shown in the colours Red, Green and Blue so that we can see them. Images with a single band are called grayscale images. Single band, grayscale images can be shown in pseudocolour by the GIS. Raster images can consume a large amount of storage space.
26 Why QGIS? Here are only some of the reasons: It s free, as in lunch. It s free, as in liberty. It s constantly developing. Extensive help and documentation is available. Cross-platform.

27 An Overview of the Interface
28 Creating a Basic Map Adding your first layer Prepare a map Working with Vector Data Viewing Layer Attributes Loading Vector Data From Shapefiles
29 Symbology Changing Colors Changing Symbol Structure Scale-Based Visibility Adding Symbol Layers Ordering Symbol Levels Symbol layer types Creating a Custom SVG Fill
30 Classifying Vector Data Using Labels Changing Label Options Using Labels Instead of Layer Symbology Labeling Lines Data Defined Settings


31 Thank you!
4.0 DIGITIZATION, EDITING AND STRUCTURING OF MAP DATA
 .0 DIGITIZATION, EDITING AND STRUCTURING OF MAP DATA The process of digitizing existing maps is a transformation from one analog) form of information to another digital) form. Data input is the operation
Remote Sensing in an
 Chapter 2: Adding Data to a Map Document Remote Sensing in an ArcMap Environment Remote Sensing Analysis in an ArcMap Environment Tammy E. Parece Image source: landsat.usgs.gov Tammy Parece James Campbell
A Practical Guide to Using QGIS
 A Practical Guide to Using QGIS 1.1 INTRODUCTION Quantum GIS (QGIS) is a useful mapping software that enables the compilation and displaying of spatial data in the form of a map. Gaining experience in
Geographic Information Systems. using QGIS
 Geographic Information Systems using QGIS 1 - INTRODUCTION Generalities A GIS (Geographic Information System) consists of: -Computer hardware -Computer software - Digital Data Generalities GIS softwares
Lab#6: Editing Shapefiles With ArcMap. create a point layer from a text file, then join a table to your point attribute table
 NRM338 Fall 2018 Lab#6 Page#1 of 17 In this lab, you will Lab#6: Editing Shapefiles With ArcMap create a point layer from a text file, then join a table to your point attribute table create hyperlinks
The GIS Spatial Data Model
 The GIS Spatial Data Model Introduction: Spatial data are what drive a GIS. Every piece of functionality that makes a GIS separate from another analytical environment is rooted in the spatially explicit
Map Library ArcView Version 1 02/20/03 Page 1 of 12. ArcView GIS
 Map Library ArcView Version 1 02/20/03 Page 1 of 12 1. Introduction 1 ArcView GIS ArcView is the most popular desktop GIS analysis and map presentation software package.. With ArcView GIS you can create
Objectives Learn how to work with projections in SMS, and how to combine data from different coordinate systems into the same SMS project.
 v. 12.3 SMS 12.3 Tutorial Working with map projections in SMS Objectives Learn how to work with projections in SMS, and how to combine data from different coordinate systems into the same SMS project.
Launch QGIS. Launch QGIS from. Open window Quantum GIS (Figure 1.1 below) Start All Programs Quantum GIS. QGISIcon on the desk top
 Start All Programs Quantum GIS. QGISIcon on the desk top") QGIS Launch QGIS Launch QGIS from Start All Programs Quantum GIS OR QGISIcon on the desk top Open window Quantum GIS (Figure 1.1 below) 2 Figure 1.1 3 Opening Raster For this exercise we demonstrate three
QGIS Launch QGIS Launch QGIS from Start All Programs Quantum GIS OR QGISIcon on the desk top Open window Quantum GIS (Figure 1.1 below) 2 Figure 1.1 3 Opening Raster For this exercise we demonstrate three
GIS in agriculture scale farm level - used in agricultural applications - managing crop yields, monitoring crop rotation techniques, and estimate
 Types of Input GIS in agriculture scale farm level - used in agricultural applications - managing crop yields, monitoring crop rotation techniques, and estimate soil loss from individual farms or agricultural
SPATIAL DATA MODELS Introduction to GIS Winter 2015
 SPATIAL DATA MODELS Introduction to GIS Winter 2015 GIS Data Organization The basics Data can be organized in a variety of ways Spatial location, content (attributes), frequency of use Come up with a system
Objectives Learn how to work with projections in SMS, and how to combine data from different coordinate systems into the same SMS project.
 v. 12.2 SMS 12.2 Tutorial Working with map projections in SMS Objectives Learn how to work with projections in SMS, and how to combine data from different coordinate systems into the same SMS project.
INTRODUCTION TO GIS WORKSHOP EXERCISE
 111 Mulford Hall, College of Natural Resources, UC Berkeley (510) 643-4539 INTRODUCTION TO GIS WORKSHOP EXERCISE This exercise is a survey of some GIS and spatial analysis tools for ecological and natural
Introduction to QGIS: Instructor s Notes
 2016 Introduction to QGIS: Instructor s Notes Created by: MARK DE BLOIS, CEO / FOUNDER, UPANDE LIMITED WITH SUPPORT FROM THE WORLD BANK AND THE UK DEPARTMENT FOR INTERNATIONAL DEVELOPMENT (DFID) Module
Bharath Setturu Research scholar, EWRG, Center for Ecological Sciences, IISc, Bangalore & EWRG-CES IIIT-HYDERABAD
 Bharath Setturu Research scholar, EWRG, Center for Ecological Sciences, IISc, Bangalore settur@ces.iisc.ernet.in & IIIT-HYDERABAD Introduction to QGIS oquantum GIS (QGIS) is a GIS tool for managing geographical
Review of Cartographic Data Types and Data Models
 Review of Cartographic Data Types and Data Models GIS Data Models Raster Versus Vector in GIS Analysis Fundamental element used to represent spatial features: Raster: pixel or grid cell. Vector: x,y coordinate
Objectives Learn how to work with projections in GMS, and how to combine data from different coordinate systems into the same GMS project.
 v. 10.2 GMS 10.2 Tutorial Working with map projections in GMS Objectives Learn how to work with projections in GMS, and how to combine data from different coordinate systems into the same GMS project.
ArcCatalog or the ArcCatalog tab in ArcMap ArcCatalog or the ArcCatalog tab in ArcMap ArcCatalog or the ArcCatalog tab in ArcMap
 ArcGIS Procedures NUMBER OPERATION APPLICATION: TOOLBAR 1 Import interchange file to coverage 2 Create a new 3 Create a new feature dataset 4 Import Rasters into a 5 Import tables into a PROCEDURE Coverage
Equipping Municipalities with GIS Software
 Equipping Municipalities with GIS Software Tutorial for QGIS 2.2 Prepared by Aylo Engineering s.a.r.l. 25/05/2014 www.ayloengineering.com Overview Welcome to the wonderful world of Geographical Information
City of Richmond Interactive Map (RIM) User Guide for the Public
 User Guide for the Public") Interactive Map (RIM) User Guide for the Public Date: March 26, 2013 Version: 1.0 3479477 3479477 Table of Contents Table of Contents Table of Contents... i About this
Interactive Map (RIM) User Guide for the Public Date: March 26, 2013 Version: 1.0 3479477 3479477 Table of Contents Table of Contents Table of Contents... i About this
Quick Guide to MapWindow GIS Desktop Application
 Quick Guide to MapWindow 1 Quick Guide to MapWindow GIS Desktop Application Version 2 January 2007 Adapted by Tom Croft. This is a summary user guide for commonly used tools and capabilities and does not
Geological mapping using open
 Geological mapping using open source QGIS MOHSEN ALSHAGHDARI -2017- Abstract Geological mapping is very important to display your field work in a map for geologist and others, many geologists face problems
Bharath Setturu Research scholar, EWRG, Center for Ecological Sciences, IISc, Bangalore & IIIT-HYDERABAD
 Bharath Setturu Research scholar, EWRG, Center for Ecological Sciences, IISc, Bangalore settur@ces.iisc.ernet.in & IIIT-HYDERABAD Introduction to QGIS oquantum GIS (QGIS) is a GIS tool for managing geographical
All data is in Universal Transverse Mercator (UTM) Zone 6 projection, and WGS 84 datum.
 Zone 6 projection, and WGS 84 datum.") 111 Mulford Hall, College of Natural Resources, UC Berkeley (510) 643-4539 EXPLORING MOOREA DATA WITH QUANTUM GIS In this exercise, you will be using an open-source FREE GIS software, called Quantum GIS,
111 Mulford Hall, College of Natural Resources, UC Berkeley (510) 643-4539 EXPLORING MOOREA DATA WITH QUANTUM GIS In this exercise, you will be using an open-source FREE GIS software, called Quantum GIS,
About the Land Image Analyst project Land Image Analyst was developed by GDA Corp for the USDA Forest Service Chesapeake Bay Program as a land cover
 About the Land Image Analyst project Land Image Analyst was developed by GDA Corp for the USDA Forest Service Chesapeake Bay Program as a land cover recognition tool to aid communities in developing land
CHAPTER 2 GEOREFERENCING AND SHAPEFILE CREATION
 CHAPTER 2 GEOREFERENCING AND SHAPEFILE CREATION Georeferencing is the process of assigning real-world coordinates to each pixel of the raster. These coordinates are obtained by doing field surveys - collecting
LECTURE 2 SPATIAL DATA MODELS
 LECTURE 2 SPATIAL DATA MODELS Computers and GIS cannot directly be applied to the real world: a data gathering step comes first. Digital computers operate in numbers and characters held internally as binary
Building Vector Layers
 Building Vector Layers in QGIS Introduction: Spatially referenced data can be separated into two categories, raster and vector data. This week, we focus on the building of vector features. Vector shapefiles
I. An Intro to ArcMap Version 9.3 and 10. 1) Arc Map is basically a build your own Google map
 Arc Map is basically a build your own Google map") I. An Intro to ArcMap Version 9.3 and 10 What is Arc Map? 1) Arc Map is basically a build your own Google map a. Display and manage geo-spatial data (maps, images, points that have a geographic location)
I. An Intro to ArcMap Version 9.3 and 10 What is Arc Map? 1) Arc Map is basically a build your own Google map a. Display and manage geo-spatial data (maps, images, points that have a geographic location)
v Importing Rasters SMS 11.2 Tutorial Requirements Raster Module Map Module Mesh Module Time minutes Prerequisites Overview Tutorial
 v. 11.2 SMS 11.2 Tutorial Objectives This tutorial teaches how to import a Raster, view elevations at individual points, change display options for multiple views of the data, show the 2D profile plots,
Lecture 6: GIS Spatial Analysis. GE 118: INTRODUCTION TO GIS Engr. Meriam M. Santillan Caraga State University
 Lecture 6: GIS Spatial Analysis GE 118: INTRODUCTION TO GIS Engr. Meriam M. Santillan Caraga State University 1 Spatial Data It can be most simply defined as information that describes the distribution
Introduction to QGIS: Student Workbook
 2016 Introduction to QGIS: Student Workbook Created by: MARK DE BLOIS, CEO / FOUNDER, UPANDE LIMITED WITH SUPPORT FROM THE WORLD BANK AND THE UK DEPARTMENT FOR INTERNATIONAL DEVELOPMENT (DFID) Module 3:
9. GIS Data Collection
 9. GIS Data Collection Geographic Information Systems and Science SECOND EDITION Paul A. Longley, Michael F. Goodchild, David J. Maguire, David W. Rhind 2005 John Wiley and Sons, Ltd Overview Introduction
Unit 3: Proximity Analysis and Buffering. Lecture Outline
 Unit 3: Proximity Analysis and Buffering Lecture Outline I. Vector-Based Proximity 1. Proximity involves the calculation of distance between features in a single layer, or between features in multiple
Objectives Learn how to work with projections in WMS, and how to combine data from different coordinate systems into the same WMS project.
 s v. 11.0 Projections / Coordinate Systems WMS 11.0 Tutorial Projections / Coordinate Systems Working with map projections in WMS Objectives Learn how to work with projections in WMS, and how to combine
Name: Date: June 27th, 2011 GIS Boot Camps For Educators Lecture_3
 Name: Date: June 27th, 2011 GIS Boot Camps For Educators Lecture_3 Practical: Creating and Editing Shapefiles Using Straight, AutoComplete and Cut Polygon Tools Use ArcCatalog to copy data files from:
From data source to data view: A practical guide to uploading spatial data sets into MapX
 From data source to data view: A practical guide to uploading spatial data sets into MapX Thomas Piller UNEP/GRID Geneva I Table of contents 1. Adding a new data source to MapX... 1 1.1 Method 1: upload
GEOGRAPHIC INFORMATION SYSTEMS Lecture 02: Feature Types and Data Models
 GEOGRAPHIC INFORMATION SYSTEMS Lecture 02: Feature Types and Data Models Feature Types and Data Models How Does a GIS Work? - a GIS operates on the premise that all of the features in the real world can
Purpose: To explore the raster grid and vector map element concepts in GIS.
 GIS INTRODUCTION TO RASTER GRIDS AND VECTOR MAP ELEMENTS c:wou:nssi:vecrasex.wpd Purpose: To explore the raster grid and vector map element concepts in GIS. PART A. RASTER GRID NETWORKS Task A- Examine
QGIS for Geoscientists
 QGIS for Geoscientists Robin Armit, Tom Carmichael, Lachlan Grose Monash Structural Geophysics group 22 nd 26th February 2016 GIS A geographic information system (GIS) is a system designed to capture,
Objectives Learn how to work with projections in GMS, and how to combine data from different coordinate systems into the same GMS project.
 v. 10.4 GMS 10.4 Tutorial Working with map projections in GMS Objectives Learn how to work with projections in GMS, and how to combine data from different coordinate systems into the same GMS project.
Basic Tasks in ArcGIS 10.3.x
 Basic Tasks in ArcGIS 10.3.x This guide provides instructions for performing a few basic tasks in ArcGIS 10.3.1, such as adding data to a map document, viewing and changing coordinate system information,
Introducing ArcScan for ArcGIS
 Introducing ArcScan for ArcGIS An ESRI White Paper August 2003 ESRI 380 New York St., Redlands, CA 92373-8100, USA TEL 909-793-2853 FAX 909-793-5953 E-MAIL info@esri.com WEB www.esri.com Copyright 2003
Feature Analyst Quick Start Guide
 Feature Analyst Quick Start Guide Change Detection Change Detection allows you to identify changes in images over time. By automating the process, it speeds up a acquisition of data from image archives.
Digitizing and Editing Polygons in the STS Gypsy Moth Project. M. Dodd 2/10/04
 Digitizing and Editing Polygons in the STS Gypsy Moth Project M. Dodd 2/10/04 Digitizing and Editing Polygons in the STS Gypsy Moth Project OVERVIEW OF DIGITIZING IN STS 3 THE DIGITIZING WINDOW 4 DIGITIZING
Download the Latest LTR QGIS version (2.18) from the QGIS website: download.qgis.org/ >> Settings > Options > Locale
 from the QGIS website: download.qgis.org/ >> Settings > Options > Locale") Exercise 1: Introduction to QGIS Aim: To understand the basis of GIS To learn the basics of a GIS software (QGIS) INTRODUCTION Software Access Download the Latest LTR QGIS version (2.18) from the QGIS
Exercise 1: Introduction to QGIS Aim: To understand the basis of GIS To learn the basics of a GIS software (QGIS) INTRODUCTION Software Access Download the Latest LTR QGIS version (2.18) from the QGIS
Using rasters for interpolation and visualization in GMS
 v. 10.3 GMS 10.3 Tutorial Using rasters for interpolation and visualization in GMS Objectives This tutorial teaches how GMS uses rasters to support all kinds of digital elevation models and how rasters
RASTER ANALYSIS GIS Analysis Fall 2013
 RASTER ANALYSIS GIS Analysis Fall 2013 Raster Data The Basics Raster Data Format Matrix of cells (pixels) organized into rows and columns (grid); each cell contains a value representing information. What
Geodatabase over Taita Hills, Kenya
 Geodatabase over Taita Hills, Kenya Anna Broberg & Antero Keskinen Abstract This article introduces the basics of geographical information systems (GIS) and explains how the Taita Hills project can benefit
GIS Workshop Spring 2016
 1/ 14 GIS Geographic Information System. An integrated collection of computer software and data used to view and manage information about geographic places, analyze spatial relationships, and model spatial
Lab 3: Digitizing in ArcGIS Pro
 Lab 3: Digitizing in ArcGIS Pro What You ll Learn: In this Lab you ll be introduced to basic digitizing techniques using ArcGIS Pro. You should read Chapter 4 in the GIS Fundamentals textbook before starting
Modern Tools for NTDs Control Programmes
 Modern Tools for NTDs Control Programmes www.thiswormyworld.org Practical 1 Becoming familiar with QGIS interface and GIS features www.thiswormyworld.org 2 Aim of practical This first practical aims to
GIS Data Models. 4/9/ GIS Data Models
 GIS Data Models 1 Conceptual models of the real world The real world can be described using two conceptually different models: 1. As discrete objects, possible to represent as points, lines or polygons.
ArcMap - EXPLORING THE DATABASE Part I. SPATIAL DATA FORMATS Part II
 Week 5 ArcMap - EXPLORING THE DATABASE Part I SPATIAL DATA FORMATS Part II topics of the week Exploring the Database More on the Table of Contents Exploration tools Identify, Find, Measure, Map tips, Hyperlink,
An Introduction to Geographic Information Systems (GIS) using ArcGIS 9.2
 using ArcGIS 9.2") An Introduction to Geographic Information Systems (GIS) using ArcGIS 9.2 by Marcel Fortin, GIS and Map Librarian, University of Toronto Libraries, 2009 gis.maps@utoronto.ca http://www.library.utoronto.ca/maplib/
An Introduction to Geographic Information Systems (GIS) using ArcGIS 9.2 by Marcel Fortin, GIS and Map Librarian, University of Toronto Libraries, 2009 gis.maps@utoronto.ca http://www.library.utoronto.ca/maplib/
Working with demographic grids in QGIS
 Working with demographic grids in QGIS Anna Dmowska dmowska@amu.edu.pl April 2017 1. Introduction SocScape (Social Landscape) is a research project which provides open access to high resolution (30 m)
Class #2. Data Models: maps as models of reality, geographical and attribute measurement & vector and raster (and other) data structures
 data structures") Class #2 Data Models: maps as models of reality, geographical and attribute measurement & vector and raster (and other) data structures Role of a Data Model Levels of Data Model Abstraction GIS as Digital
Class #2 Data Models: maps as models of reality, geographical and attribute measurement & vector and raster (and other) data structures Role of a Data Model Levels of Data Model Abstraction GIS as Digital
Tutorial 7: Adding Features and Editing Line and Polygon Layers
 Tutorial 7: Adding Features and Editing Line and Polygon Layers Tutorial Content 7.1. When should I use a line layer to represent data? 7.2. How do I add line features? 7.3. How to use the snapping tool?
Topic 5: Raster and Vector Data Models
 Geography 38/42:286 GIS 1 Topic 5: Raster and Vector Data Models Chapters 3 & 4: Chang (Chapter 4: DeMers) 1 The Nature of Geographic Data Most features or phenomena occur as either: discrete entities
Using Syracuse Community Geography s MapSyracuse
 Using Syracuse Community Geography s MapSyracuse MapSyracuse allows the user to create custom maps with the data provided by Syracuse Community Geography. Starting with the basic template provided, you
Lab 6: Transforming Spatial Data
 Lab 6: Transforming Spatial Data Objectives: The primary objectives of this lab are to georeference a raster dataset and to create GIS data by digitizing features from an image as a backdrop. Specifics:
Tutorial 1 Exploring ArcGIS
 Tutorial 1 Exploring ArcGIS Before beginning this tutorial, you should make sure your GIS network folder is mapped on the computer you are using. Please refer to the How to map your GIS server folder as
Joining data from an Excel spreadsheet
 Geographic Information for Vector Surveillance Day 3 of a 3 day course with Malaria examples Getting your own data into QGIS Learning objectives be able to join data from an Excel spreadsheet to a shapefile
RASTER ANALYSIS GIS Analysis Winter 2016
 RASTER ANALYSIS GIS Analysis Winter 2016 Raster Data The Basics Raster Data Format Matrix of cells (pixels) organized into rows and columns (grid); each cell contains a value representing information.
Georeferencing Topo Sheets and Scanned Maps
 Georeferencing Topo Sheets and Scanned Maps QGIS Tutorials and Tips Author Ujaval Gandhi http://www.spatialthoughts.com This work is licensed under a Creative Commons Attribution 4.0 International License.
Terrain Analysis. Using QGIS and SAGA
 Terrain Analysis Using QGIS and SAGA Tutorial ID: IGET_RS_010 This tutorial has been developed by BVIEER as part of the IGET web portal intended to provide easy access to geospatial education. This tutorial
Analysing crime data in Maps for Office and ArcGIS Online
 Analysing crime data in Maps for Office and ArcGIS Online For non-commercial use only by schools and universities Esri UK GIS for School Programme www.esriuk.com/schools Introduction ArcGIS Online is a
Toolkit summary. Toolkit contents
 Using satellite imagery to understand the benefits that marine nature reserves provide for society: a toolkit for the use and visualisation of satellite products Toolkit summary This toolkit gives an introduction,
Introduction :- Storage of GIS Database :- What is tiling?
 Introduction :- GIS storage and editing subsystems provides a variety of tools for storing and maintaining the digital representation of a study area. It also provide tools for examining each theme for
Understanding Geospatial Data Models
 Understanding Geospatial Data Models 1 A geospatial data model is a formal means of representing spatially referenced information. It is a simplified view of physical entities and a conceptualization of
QGIS plugin or web app? Lessons learned from the development of a 3D georeferencer.
 QGIS plugin or web app? Lessons learned from the development of a 3D georeferencer. Produit Timothée 1, Jens Ingensand 2, and Gillian Milani 3 1-2 University of Applied Sciences Western Switzerland, G2C
Mosaic Tutorial: Advanced Workflow
 Mosaic Tutorial: Advanced Workflow This tutorial demonstrates how to mosaic two scenes with different color variations. You will learn how to: Reorder the display of the input scenes Achieve a consistent
3. Map Overlay and Digitizing
 3. Map Overlay and Digitizing 3.1 Opening Map Files NavviewW/SprayView supports digital map files in ShapeFile format from ArcView, DXF format from AutoCAD, MRK format from AG-NAV, Bitmap and JPEG formats
The Raster Data Model
 The Raster Data Model 2 2 2 2 8 8 2 2 8 8 2 2 2 2 2 2 8 8 2 2 2 2 2 2 2 2 2 Llano River, Mason Co., TX 1 Rasters are: Regular square tessellations Matrices of values distributed among equal-sized, square
Exercise 4: Import Tabular GPS Data and Digitizing
 Exercise 4: Import Tabular GPS Data and Digitizing You can create NEW GIS data layers by digitizing on screen with an aerial photograph or other image as a back-drop. You can also digitize using imported
Exercise One: Estimating The Home Range Of An Individual Animal Using A Minimum Convex Polygon (MCP)
") --- Chapter Three --- Exercise One: Estimating The Home Range Of An Individual Animal Using A Minimum Convex Polygon (MCP) In many populations, different individuals will use different parts of its range.
--- Chapter Three --- Exercise One: Estimating The Home Range Of An Individual Animal Using A Minimum Convex Polygon (MCP) In many populations, different individuals will use different parts of its range.
Data Assembly, Part II. GIS Cyberinfrastructure Module Day 4
 Data Assembly, Part II GIS Cyberinfrastructure Module Day 4 Objectives Continuation of effective troubleshooting Create shapefiles for analysis with buffers, union, and dissolve functions Calculate polygon
4. If you are prompted to enable hardware acceleration to improve performance, click
 Exercise 1a: Creating new points ArcGIS 10 Complexity: Beginner Data Requirement: ArcGIS Tutorial Data Setup About creating new points In this exercise, you will use an aerial photograph to create a new
Metadata or "data about data" describe the content, quality, condition, and other characteristics of data. The Federal Geographic Data Committee
 Metadata or "data about data" describe the content, quality, condition, and other characteristics of data. The Federal Geographic Data Committee (http://www.fgdc.gov/) approved the Content Standard for
Lesson 3: Introduction to Using QGIS
 Agricultural Nutrient Management Program Department of Environmental Science and Technology 0116 Symons Hall 7998 Regents Dr. College Park, MD 20742 TEL 301-405-1319 FAX 301-314-7375 www.extension.umd.edu/anmp
Introduction to GIS. Geographic Information Systems SOCR-377 9/24/2015. R. Khosla Fall Semester The real world. What in the world is GIS?
 Introduction to GIS Geographic Information Systems SOCR-377 What in the world is GIS? GIS is simultaneously the telescope, the microscope, the computer and the Xerox machine of regional analysis and synthesis
_Tutorials. Arcmap. Linking additional files outside from Geodata
 _Tutorials Arcmap Linking additional files outside from Geodata 2017 Sourcing the Data (Option 1): Extracting Data from Auckland Council GIS P1 First you want to get onto the Auckland Council GIS website
Rasters are: The Raster Data Model. Cell location specified by: Why squares? Raster Data Models 9/25/2014. GEO327G/386G, UT Austin 1
 5 5 5 5 5 5 5 5 5 5 5 5 2 2 5 5 2 2 2 2 2 2 8 8 2 2 5 5 5 5 5 5 2 2 2 2 5 5 5 5 5 2 2 2 5 5 5 5 The Raster Data Model Rasters are: Regular square tessellations Matrices of values distributed among equalsized,
The Raster Data Model
 The Raster Data Model 2 2 2 2 8 8 2 2 8 8 2 2 2 2 2 2 8 8 2 2 2 2 2 2 2 2 2 Llano River, Mason Co., TX 9/24/201 GEO327G/386G, UT Austin 1 Rasters are: Regular square tessellations Matrices of values distributed
Image georeferencing is the process of developing a model to transform from pixel coordinates into GIS coordinates such as meters on the ground.
 Image georeferencing is the process of developing a model to transform from pixel coordinates into GIS coordinates such as meters on the ground. Image rectification is the process of using your georeferencing
This user guide covers select features of the desktop site. These include:
 User Guide myobservatory Topics Covered: Desktop Site, Select Features Date: January 27, 2014 Overview This user guide covers select features of the desktop site. These include: 1. Data Uploads... 2 1.1
Raster Data Models 9/18/2018
 Raster Data Models The Raster Data Model Rasters are: Regular square tessellations Matrices of values distributed among equal-sized, square cells 5 5 5 5 5 5 5 5 2 2 5 5 5 5 5 5 2 2 2 2 5 5 5 5 5 2 2 2
GIS Data Collection. This chapter reviews the main methods of GIS data capture and transfer and introduces key practical management issues.
 9 GIS Data Collection OVERVIEW This chapter reviews the main methods of GIS data capture and transfer and introduces key practical management issues. It distinguishes between primary (direct measurement)
Georeferencing in ArcGIS
 Georeferencing in ArcGIS Georeferencing In order to position images on the surface of the earth, they need to be georeferenced. Images are georeferenced by linking unreferenced features in the image with
Blacksburg, VA July 24 th 30 th, 2010 Digitizing and Analyzing Data Page 1
 Digitizing and Analyzing Data John McGee Jennifer McKee Prepared by: With support from: NSF DUE-0903270 in partnership with: Geospatial Technician Education Through Virginia s Community Colleges (GTEVCC)
Basic Queries Exercise - Haiti
 Basic Queries Exercise - Haiti Written by Barbara Parmenter, revised by Carolyn Talmadge on September 18, 2016 SETTING UP... 1 WHERE ARE THE HOSPITALS THAT ARE STILL OPERATING? (SELECT BY ATTRIBUTE )...
CROP MAPPING WITH SENTINEL-2 JULY 2017, SPAIN
 _p TRAINING KIT LAND01 CROP MAPPING WITH SENTINEL-2 JULY 2017, SPAIN Table of Contents 1 Introduction to RUS... 3 2 Crop mapping background... 3 3 Training... 3 3.1 Data used... 3 3.2 Software in RUS environment...
v Online Data Dynamic Images SMS Tutorials Prerequisites Requirements Time Objectives
 v. 13.0 SMS 13.0 Tutorial Dynamic Images Objectives This tutorial instructs on the basic skills concerning how to use the dynamic image option offered by SMS. This option connects SMS through an internet
GEOGRAPHICAL INFORMATION SYSTEMS. GIS Data Sources and Data Processing (Part 2)
") For more updated version, please go to http://ocw.ump.edu.my/ GEOGRAPHICAL INFORMATION SYSTEMS GIS Data Sources and Data Processing (Part 2) by Ngahzaifa Ab Ghani, PhD Faculty of Computer Systems & Software
For more updated version, please go to http://ocw.ump.edu.my/ GEOGRAPHICAL INFORMATION SYSTEMS GIS Data Sources and Data Processing (Part 2) by Ngahzaifa Ab Ghani, PhD Faculty of Computer Systems & Software
Overview. Image Geometric Correction. LA502 Special Studies Remote Sensing. Why Geometric Correction?
 LA502 Special Studies Remote Sensing Image Geometric Correction Department of Landscape Architecture Faculty of Environmental Design King AbdulAziz University Room 103 Overview Image rectification Geometric
Technical Specifications
 1 Contents INTRODUCTION...3 ABOUT THIS LAB...3 IMPORTANCE OF THIS MODULE...3 EXPORTING AND IMPORTING DATA...4 VIEWING PROJECTION INFORMATION...5...6 Assigning Projection...6 Reprojecting Data...7 CLIPPING/SUBSETTING...7
GPS/GIS Activities Summary
 GPS/GIS Activities Summary Group activities Outdoor activities Use of GPS receivers Use of computers Calculations Relevant to robotics Relevant to agriculture 1. Information technologies in agriculture
ANNEX V RASTER TO VECTOR CONVERSION MANUAL
 ANNEX V RASTER TO VECTOR CONVERSION MANUAL Table of Contents 1. Introduction...1 2. Software used...1 3. Methodology Flow chart...1 4. Scanning hard copy map...1 5. Working with Photo-editor environment
GGR 375 QGIS Tutorial
 GGR 375 QGIS Tutorial With text taken from: Sherman, Gary E. Shuffling Quantum GIS into the Open Source GIS Stack. Free and Open Source Software for Geospatial (FOSS4G) Conference. 2007. Available online