ERROR PROPAGATION MODELING IN GIS POLYGON OVERLAY
|
|
|
- David Pearson
- 6 years ago
- Views:
Transcription
1 ERROR PROPAGATION MODELING IN GIS POLYGON OVERLAY Jinda Sae-Jung, Xiao Yong Chen, Do Minh Phuong Department of Remote Sensing and Geographic Information Systems, Asian Institute of Technology, Thailand KEY WORDS: Error Propagation; Overlay Analysis; Vector Data; GIS; Sliver ABSTRACT: A spatial error may refer to the difference between a measured value and the true value or the estimated uncertainty with respect to a given observation or set of observations which is the error contained in the coordinate values of points, lines and volumes. This paper focuses on developing a methodology for error handling and error propagation modeling in spatial database with GIS. The main target of this study is error propagation on vector polygon overlay in a GIS. An error model was developed to examine errors from its component layers. Error simulations on intersection points proved an important fact that overlay error can be calculated from its components. This error is an average of the component errors. Sliver error was also analyzed and simulated to come up with a solution for solving this common error in overlaying polygons. It is recommended to split-and- merge slivers, not to delete nor combine. In most cases, the splitting line can be drawn to follow proportional weights to the errors in two boundary lines from their original polygons. 1. INTRODUCTION There are several cases of error while a set of data is processed in a GIS. Errors can occur depending on the knowledge of data analysts and the sophistication of instruments. For example, an operator can hardly track precisely the lines to be digitized during a map digitizing task and so on. Positional accuracy is defined by how well the true measurements of an object on the earth s surface matches the same object stored as a series of digital coordinates in a GIS data layer. As a matter of fact, the positional error propagation is one of the most complicated and unpredictable issues in GIS analysis which will be considered in this paper. As there are many types of errors, this paper provides a method for estimating positional error of geospatial data focusing on polygon vector overlay. It is divided to 3 sections to measure and analyze the error propagation from the original polygons to the processed polygon which are 1) error propagation along the boundary line of overlay polygon, focus on the intersection outputs 2) error of the intersection points of the output polygons which propagate from the same point of original polygons, and 3) slivers and gaps which are general errors occurred after overlay processing. After identify and measurement all of the error propagation, some kind of error such as slivers will be management with the problem with the suitable solution. First, select the point intersection from the overlaid polygons to generate the error normal distribution. By the theory, at the intersection point, A and B are the same true value and the error of A should equal to B and therefore, the error at the intersection point is the point which the error is in between error from A and B polygon.. Experiments have been made to examine how the error made by the combination of source for A and source for B changes. 2. ERROR MODELING FOR INTERSECTION POINT OF THE OVERLAID BOUNDARY POLYGONS To foster error examination when overlaying some polygon layers, it is necessary to have a close look into the common points of those layers, which are the intersection points when two boundary lines of two polygons cut each other. The special characteristics of those intersection points, is even though they are derived from various sources of data with different accuracy, they are wearing the same error to their true points. Two polygons intersect to each other at least at two or more points. This intersection creates real overlay product and some additional by products, which are errors. Obviously, error made by polygon intersection is mostly sliver. 825


2 Figure 1 Concept of modeling error propagation: (a) the intersection boundary of overlay polygon which; (b) the probability of error observations occurring around the true location (center point) (c) model of the error distribution in normal curves. To simulate, the implementation has followed some rules: 1. Errors of set A and set B should follow rule of normal distribution. 2. Error of set A is equal to error of set B. 3. Error variance of set A and B might be various and different. 4. Error distance of any points in set A and B are randomly modified but the RMSE of them follow rule number 1. μ = μ = μ (1) To implement the simulation, a software has been made, named CALCER Set A has been selected to be modified with random error to each component points. Each error component has been added a random error in a certain range. According to Figure 2, this range is from -5 to +5 map unit. During several simulations, this value has been changed also for non-bias expected results. Set B s error components will be modified to follow set A and comply the condition #1 above, which makes RSME of set A equal RSME of set B. Iteration or loop is set to run simulation. This parameter can be 100 times or more. CALCER will modify set A and B a 100 times and, thus, re-calculate RMSE of A and B a 100 times. Figure 2 error simulation with CALCER Observations and conclusions have been made after several simulations with error model in CALCER. As error in set A and B follow normal distribution, following characteristics of these two sets have been found: Standard deviation of set C is equal to the average of standard deviation with set A and B (2) Root mean square error of set C equals to the average of RMSE for set A and B (3) This methodology is dealing with only the intersection points when two polygons are overlaid. As intersection points are part of the polygon boundaries, it is led to another finding that at any parts of the boundary, the overlay polygon errors are also followed equation (3). This finding will be further proved in the next part of this paper. 826
3 Figure 3 Flow chart of generating the two-dimensional model of the positional error propagation in overlay polygon. 3. DETECTION AND MANAGEMENT WITH SLIVER POLYGONS It is commonly to get the slivers after overlay or merge process. Sliver polygons are a small area formed when two polygons which have been overlaid do not abut exactly, but overlap along one or more edges. Slivers often appear when two data boundary lines are merged. Figure 4 Sliver polygons often appear when two GIS datasets with common boundary lines are merged. 827
4 To solve these kinds of errors, first we need intelligent criteria to distinguish between slivers and real polygons to detect and solve the problem which is follow: Area: Slivers are small Shape: slivers are long and thin Number of arcs: slivers generally have only 2 bounding arcs while real polygons have only 1 arc. In Figure 3.8 shown an example, if a "red" arc between polygons A and B is overlaid on a "blue" arc between polygons 1 and 2, the slivers will alternate between A2 and B1 Chaining: slivers tend to occur in chains For given, then It is obvious that when k 1 (7) (8) From case 1,2 and 3, it is pointed out that a sliver polygon is the one which satisfies e > 4. However, this value of e depends on the decision when one is going to eliminate slivers. Experiments with rectangles show that: Figure 5 Workflow of Measurement of Sliver and gap polygons To identify the sliver polygons, it is important to look at the ratio between a polygon s perimeter and its area. For P is the perimeter of a polygon A is the area e is the ratio following this equation: Circle polygon (4) k=5 e=5.34 k=6 e=5.7 k=7 e=6.0 k=8 e=6.3.. When k>5, e 5.3, the rectangle can be eliminated a sliver. For statistic determination, k can be selected from 5, 6 or 7, with corresponding e from 5.3, 5.7 or greater. It is apparent that when a polygon and a rectangle are of the same size (area), the perimeter of the rectangle is the smaller. Therefore, for the case of the polygon, k can be determined 5 and so e 5.34.In this study, the polygon which has been selected to be a sliver should have e 5.3 or e 5.7 ± 0.5. Where R is the radius of the circle. Square polygon (5) When a sliver is detected, it can be replaced by an arc along its center line or should be merged with the most suitable of their neighbors. If one of the bounding arcs that make up an area feature is dropped, the feature will merge with whichever of its neighbors the line borders. Thus, if a suitable neighbor can be found for the suspected sliver polygon to merge with, the line separating them simply needs to be removed. In general, when two polygons overlay, it creates two or more intersections and some create slivers also. Sliver is considered error of the overlaying process. To solve the sliver, there is a solution: split sliver should be the best solution because it equally distributes error of the overlay components. Where (6) R 1 is the first side of the rectangle. R 2 is the second side of the rectangle. To come up with the solution of splitting the sliver, it is clear that the solution should be able to draw a polyline which (i) splits the sliver into two parts; and (ii) equally distributes error of its original component A and B. 828
5 To draw a polyline that meets the above rule, a simulation has been implemented. Having line A (Xai, Yai) and line B (Xbi, Ybi) with different errors, the new line C to split this sliver and equally distributes error should comply two conditions: - C must be within the sliver - Error in C should satisfy equation (9) ρ B = weight of distances from line C to A and to B, applied to line B and ρ A + ρ B = 1 ρ A and ρb can be derived by following equations In case error in A is equal to error in B, it is obviously C is in the middle of A and B, with that (11) Figure 6 Splitting sliver has been chosen to solve sliver error. (9) For the case when ErrA is not equal to ErrB, while ErrC satisfies equation (10), its line vertices cannot be calculated following equation (9). In this case, the new set of coordinate for ErrC line should follow Figure 7 Simulation of the split lines in case ErrA is not equal to ErrB In Figure 7, the two boundaries of polygon A and polygon B are line #3 and #7. When ErrA = ErrB, the middle line #1 is the most suitable split line which divides the slivers into two parts with equal error. When error A is greater than error B as in line #2 and #4 is the zone of error A, #6 and #8 is the zone of error B, then the result will be nearer to the line #7 which has less error. Vice versa, when error B is greater than Error A, the solution can be the line in between #1 to #3, corresponding to equation (10). Where (10) ρ A = weight of distances from line C to A and to B, applied to line A 4. SIMULATION METHOD FOR MODELING ERROR PROPAGATION OF INTERSECTION POINTS Several experiments have been conducted to generate random errors to shape objects (with Arcview shape file). Errors have been calculated in point A (belongs to polygon A), point B (belongs to polygon B) and point C (the intersecting part of polygon A and B) as figures below. 829


6 Figure 8 Origin of polygon overlay A and B 830
 Figure 10 Graph of normal distribution of the error of polygons A and B")
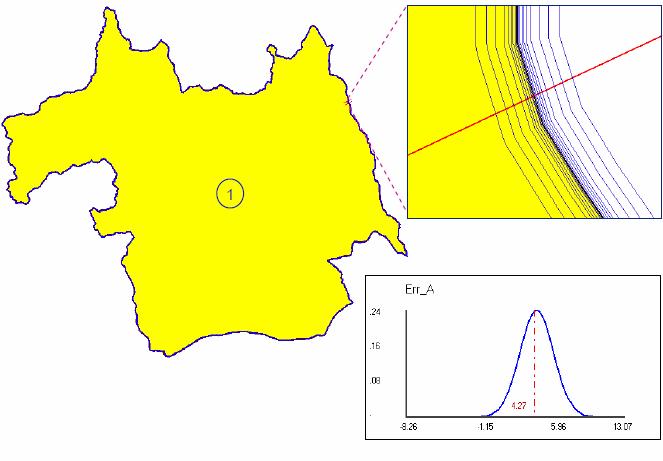
7 Figure9 Sampling windows for error examination in different positions Error characteristic along the boundary of the original polygons (A and B) Figure 10 Graph of normal distribution of the error of polygons A and B 831

8 Error characteristics at intersection point (C) Figure 11 Error at the intersection point of A and B 832

9 Figure 12 Sliver polygons solving 833

10 Figure 13 Output map of the overlay polygons which contain error of overlay process: 1. Errors along A and B boundaries 2. Errors at the intersection polygon 3. Sliver polygons 5. CONCLUSION Modeling error propagation in overlay polygon is one of the theoretical research issues for geographical information systems. Positional accuracy of spatial data has been interested topic in many researches. In this paper, a simulation modeling has been developed for measuring the error propagation in vector-based overlay processing. Experiments and mathematical proof have shown that when errors of the two data sets follow normal distribution, the overlaying result is also followed normal distribution. The overlay error can be derived from component data s errors, which are the error from two layers of vector polygon. The amplitude of the overlay error is approximately equal to the average value of the two vector polygons. Simulations have been done with the intersection points of the two layers. In all cases, overlay errors are equal to the average error of the two polygons. This leads to an important finding: Polygon overlay error can be calculated from the errors of the overlaying layers. The value of it is equal to the average value of the error of the component layers. Error propagation modeling for polygon overlay has been done with two parts: error modeling at the intersection points and, error simulation to find the splitting line. In the first 834
11 simulation, the number of error points in the first data set (set A) may be equal or not equal to the number of error points in the second data set (set B). As the matter of fact, both two points intersect at the same point and so, bear the same error. The simulation process should ensure that errors added to each set to be random and it maintain the equalization of error in both sets. With support of computer programming, this simulation can be implemented with 100, 1000 or more iterations. This is necessary because it can help avoid bias in sampling selection. In the second simulation, a hypothesis has been made which pointed out that the splitting line error graph is the line locating in the middle of the error lines of the two boundaries. Simulation is based on the repetition of calculating new splitting line and graphing it to find the best matched to the hypothesis error line. Experiments have proved that the line which has error graph matched best to the hypothesis line is exactly following equation (10). This equation is a practical equation which helps calculate and draw the spitting line which solves the sliver cases. REFERENCES Ali Abbaspour, R., 2002, Error propagation in overlay analysis in GIS, MSc. Thesis,Surveying and Geomatic Engineering Dept., University of Tehran, Iran. Brunsdon,C., and Openshaw,S., 1993, Simulating the Effects of Error in GIS. In Geographic Information Handling: Research and applications, edited by P.Mather( Chichester: John Wiley & Sons). Goodchild, MF.,1999, Keynote speech: Measurement-based GIS. In Proceedings of The International Symposium on Spatial Data Quality, edited by Shi, W., Goodchild, M.F. and Fisher, P.F. (Hong Kong: Hong Kong Polytechnical University) pp Goodchild,M. and Hunter,G.,1997, A simple positional accuracy measure for liner features. Geographical Information Science,V.11,pp Data.pp Goodchild,M.F. and Zhang,J.,2002,Uncertainty in Geographical Information. New York: Taylor&Francis. Heuvelink,G.M.B., and Burrough P.A., 2002,Propagation of Errors in Spatial Modeling with GIS. International Journal of Geographic Information System,Vol.3, No.4. Newcomer,J.A. and Szajgin,J., 1984,Accumulation of thematic map errors in digital overlay analysis. The American Cartographer,11,pp Openshaw,S.,Charlton,M.and Carver,S., 1991, Error propagation: A Monte Carlo simulation. In Handling Geographical Information, edited by I.Masser and M. Blakemore (New York: Longman),pp Podobnikar,T.,1998, Positional error modeling using Monte Carlo simulation. Available online : Shi,W. and Liu,W.,2000, A stochastic Process-Based Model for positional Error of Line Segments in GIS. International Journal of Geographical Information Science,14,1: United States Geological Survey (USGS), 2000, National Map Accuracy Standard. Available online: Veregin,H., 1995, Developing and Inspection an Error Propagation Model for GIS Overlay. International Journal of Geographical Information Science,14, Zhang,J.and Kirby,R.P., 2000, A geostatistical approach to modeling positional errors in vector data. Transactions in GIS,4,pp Zhang, J. and Goodchild,M.F.,2002, Uncertainty in Geographical Information. Deriving Mean Lines and Epsilon Error N=Bands from Simulated 835
12 836
FOUR ADVANCES IN HANDLING UNCERTAINTIES IN SPATIAL DATA AND ANALYSIS
 FOUR ADVANCES IN HANDLING UNCERTAINTIES IN SPATIAL DATA AND ANALYSIS Wenzhong Shi Advanced Research Centre for Spatial Information Technology Department of Land Surveying and Geo-Informatics The Hong Kong
Lecture 6: GIS Spatial Analysis. GE 118: INTRODUCTION TO GIS Engr. Meriam M. Santillan Caraga State University
 Lecture 6: GIS Spatial Analysis GE 118: INTRODUCTION TO GIS Engr. Meriam M. Santillan Caraga State University 1 Spatial Data It can be most simply defined as information that describes the distribution
ERROR PROPAGATION IN OVERLAY ANALYSIS
 ERROR PROPAGATION IN OVERLAY ANALYSIS Ali A. Alesheikh Department of Geomatics and Geodesy Eng. K.N.T University of Technology, Vali-asr St., Tehran, IRAN Tel: 8779473-5 Fax: 8779476 Email: ali_alesheikh@hotmail.com
Outline. 14. Query, Measurement, and Transformation. Spatial analysis. Definitions. The Snow map. What is spatial analysis?
 Outline 14. Query, Measurement, and Transformation What is spatial analysis? Transformations Geographic Information Systems and Science SECOND EDITION Paul A. Longley, Michael F. Goodchild, David J. Maguire,
Tips for a Good Meshing Experience
 Tips for a Good Meshing Experience Meshes are very powerful and flexible for modeling 2D overland flows in a complex urban environment. However, complex geometries can be frustrating for many modelers
DATA MODELS IN GIS. Prachi Misra Sahoo I.A.S.R.I., New Delhi
 DATA MODELS IN GIS Prachi Misra Sahoo I.A.S.R.I., New Delhi -110012 1. Introduction GIS depicts the real world through models involving geometry, attributes, relations, and data quality. Here the realization
A CONSISTENCY MAINTENANCE OF SHARED BOUNDARY AFTER POLYGON GENERALIZATION
 CO-182 A CONSISTENCY MAINTENANCE OF SHARED BOUNDARY AFTER POLYGON GENERALIZATION AI T.(1), ZHANG W.(2) (1) Wuhan University, WUHAN CITY, CHINA ; (2) Zhongnan University of Economics and Law, WUHAN CITY,
Mid-term exam. GIS and Forest Engineering Applications. Week 5. FE 257. GIS and Forest Engineering Applications. Week 5
 FE 257. GIS and Forest Engineering Applications Week 5 Week 5 Last week (Chapter 3): Acquiring, creating, and editing GIS s Examining Error Chapter 7 Buffering and other proximity operations Questions?
Content Standard 1: Numbers, Number Sense, and Computation
 Content Standard 1: Numbers, Number Sense, and Computation Place Value Fractions Comparing and Ordering Counting Facts Estimating and Estimation Strategies Determine an approximate value of radical and
4.0 DIGITIZATION, EDITING AND STRUCTURING OF MAP DATA
 .0 DIGITIZATION, EDITING AND STRUCTURING OF MAP DATA The process of digitizing existing maps is a transformation from one analog) form of information to another digital) form. Data input is the operation
A toolbox for analyzing the effect of infra-structural facilities on the distribution of activity points
 A toolbox for analyzing the effect of infra-structural facilities on the distribution of activity points Railway Station : Infra-structural Facilities Tohru YOSHIKAWA Department of Architecture Tokyo Metropolitan
Geometry I Can Statements I can describe the undefined terms: point, line, and distance along a line in a plane I can describe the undefined terms:
 Geometry I Can Statements I can describe the undefined terms: point, line, and distance along a line in a plane I can describe the undefined terms: point, line, and distance along a line in a plane I can
Supplementary file for SybilDefender: A Defense Mechanism for Sybil Attacks in Large Social Networks
 1 Supplementary file for SybilDefender: A Defense Mechanism for Sybil Attacks in Large Social Networks Wei Wei, Fengyuan Xu, Chiu C. Tan, Qun Li The College of William and Mary, Temple University {wwei,
Digitizing and Editing Polygons in the STS Gypsy Moth Project. M. Dodd 2/10/04
 Digitizing and Editing Polygons in the STS Gypsy Moth Project M. Dodd 2/10/04 Digitizing and Editing Polygons in the STS Gypsy Moth Project OVERVIEW OF DIGITIZING IN STS 3 THE DIGITIZING WINDOW 4 DIGITIZING
Cell based GIS. Introduction to rasters
 Week 9 Cell based GIS Introduction to rasters topics of the week Spatial Problems Modeling Raster basics Application functions Analysis environment, the mask Application functions Spatial Analyst in ArcGIS
3. Data Analysis and Statistics
 3. Data Analysis and Statistics 3.1 Visual Analysis of Data 3.2.1 Basic Statistics Examples 3.2.2 Basic Statistical Theory 3.3 Normal Distributions 3.4 Bivariate Data 3.1 Visual Analysis of Data Visual
Keyword: Quadratic Bézier Curve, Bisection Algorithm, Biarc, Biarc Method, Hausdorff Distances, Tolerance Band.
 Department of Computer Science Approximation Methods for Quadratic Bézier Curve, by Circular Arcs within a Tolerance Band Seminar aus Informatik Univ.-Prof. Dr. Wolfgang Pree Seyed Amir Hossein Siahposhha
Figure 1: Workflow of object-based classification
 Technical Specifications Object Analyst Object Analyst is an add-on package for Geomatica that provides tools for segmentation, classification, and feature extraction. Object Analyst includes an all-in-one
Mathematics GCSE 9 1 Higher Syllabus. Yes. Does the subject set according to ability? Skills Covered. Unit
 Mathematics GCSE 9 1 Higher Syllabus Does the subject set according to ability? Unit Unit 1 Unit 2 Unit 3 Unit 4 Yes Skills Covered understand and apply place value correctly. estimate values including
Geometry. Cluster: Experiment with transformations in the plane. G.CO.1 G.CO.2. Common Core Institute
 Geometry Cluster: Experiment with transformations in the plane. G.CO.1: Know precise definitions of angle, circle, perpendicular line, parallel line, and line segment, based on the undefined notions of
Arizona Academic Standards
 Arizona Academic Standards This chart correlates the Grade 8 performance objectives from the mathematics standard of the Arizona Academic Standards to the lessons in Review, Practice, and Mastery. Lesson
Level 4 means that I can
 Level 4 means that I can Describe number patterns Find multiples Find factors Work out the square numbers Use word formulae Use co-ordinates in the first quadrant Multiply and divide whole numbers by 10
Computational Geometry
 Lecture 1: Introduction and convex hulls Geometry: points, lines,... Geometric objects Geometric relations Combinatorial complexity Computational geometry Plane (two-dimensional), R 2 Space (three-dimensional),
Some Open Problems in Graph Theory and Computational Geometry
 Some Open Problems in Graph Theory and Computational Geometry David Eppstein Univ. of California, Irvine Dept. of Information and Computer Science ICS 269, January 25, 2002 Two Models of Algorithms Research
CURVES OF CONSTANT WIDTH AND THEIR SHADOWS. Have you ever wondered why a manhole cover is in the shape of a circle? This
 CURVES OF CONSTANT WIDTH AND THEIR SHADOWS LUCIE PACIOTTI Abstract. In this paper we will investigate curves of constant width and the shadows that they cast. We will compute shadow functions for the circle,
Edexcel Linear GCSE Higher Checklist
 Number Add, subtract, multiply and divide whole numbers integers and decimals Multiply and divide fractions Order integers and decimals Order rational numbers Use the concepts and vocabulary of factor
Modeling with Uncertainty Interval Computations Using Fuzzy Sets
 Modeling with Uncertainty Interval Computations Using Fuzzy Sets J. Honda, R. Tankelevich Department of Mathematical and Computer Sciences, Colorado School of Mines, Golden, CO, U.S.A. Abstract A new method
Lecture 8. Vector Data Analyses. Tomislav Sapic GIS Technologist Faculty of Natural Resources Management Lakehead University
 Lecture 8 Vector Data Analyses Tomislav Sapic GIS Technologist Faculty of Natural Resources Management Lakehead University Vector Data Analysis Vector data analysis involves one or a combination of: Measuring
ABSTRACT 1. INTRODUCTION 2. METHODS
 Finding Seeds for Segmentation Using Statistical Fusion Fangxu Xing *a, Andrew J. Asman b, Jerry L. Prince a,c, Bennett A. Landman b,c,d a Department of Electrical and Computer Engineering, Johns Hopkins
Vector-Based GIS Data Processing. Chapter 6
 Vector-Based GIS Data Processing Chapter 6 Vector Data Model Feature Classes points lines polygons Layers limited to one class of data Figure p. 186 Vector Data Model Shapefiles ArcView non-topological
Mathematics High School Geometry An understanding of the attributes and relationships of geometric objects can be applied in diverse contexts
 Mathematics High School Geometry An understanding of the attributes and relationships of geometric objects can be applied in diverse contexts interpreting a schematic drawing, estimating the amount of
MSc Geomatics thesis presentation. Validation and automatic repair of planar partitions using a constrained triangulation.
 MSc Geomatics thesis presentation Validation and automatic repair of planar partitions using a constrained triangulation Ken Arroyo Ohori Friday, 27 August 2010 at 10:00 Grote Vergaderzaal OTB Research
PARAMETRIC STUDY WITH GEOFRAC: A THREE-DIMENSIONAL STOCHASTIC FRACTURE FLOW MODEL. Alessandra Vecchiarelli, Rita Sousa, Herbert H.
 PROCEEDINGS, Thirty-Eighth Workshop on Geothermal Reservoir Engineering Stanford University, Stanford, California, February 3, 23 SGP-TR98 PARAMETRIC STUDY WITH GEOFRAC: A THREE-DIMENSIONAL STOCHASTIC
Course Number: Course Title: Geometry
 Course Number: 1206310 Course Title: Geometry RELATED GLOSSARY TERM DEFINITIONS (89) Altitude The perpendicular distance from the top of a geometric figure to its opposite side. Angle Two rays or two line
Alternate Animal Movement Routes v. 2.1
 Alternate Animal Movement Routes v. 2.1 Aka: altroutes.avx Last modified: April 12, 2005 TOPICS: ArcView 3.x, Animal Movement, Alternate, Route, Path, Proportion, Distance, Bearing, Azimuth, Angle, Point,
This strand involves properties of the physical world that can be measured, the units used to measure them and the process of measurement.
 ICAS MATHEMATICS ASSESSMENT FRAMEWORK ICAS Mathematics assesses mathematical skills in a range of contexts. The content of the papers is divided into the strands of: and, and, and, and, and and. The content
S2 May Extension Test Checklist of Topics Length and Perimeter Learning Outcomes Revised Need Help
 S2 May Extension Test Checklist of Topics Length and Perimeter Undersand the correct units to use in context Estimate lengths and Measure correctly Calculate the Perimeter of a shape Find missing lengths
VECTOR ANALYSIS: QUERIES, MEASUREMENTS & TRANSFORMATIONS
 VECTOR ANALYSIS: QUERIES, MEASUREMENTS & TRANSFORMATIONS GIS Analysis Winter 2016 Spatial Analysis Operations performed on spatial data that add value Can reveal things that might otherwise be invisible
HYBRID FORCE-DIRECTED AND SPACE-FILLING ALGORITHM FOR EULER DIAGRAM DRAWING. Maki Higashihara Takayuki Itoh Ochanomizu University
 HYBRID FORCE-DIRECTED AND SPACE-FILLING ALGORITHM FOR EULER DIAGRAM DRAWING Maki Higashihara Takayuki Itoh Ochanomizu University ABSTRACT Euler diagram drawing is an important problem because we may often
The Game of Criss-Cross
 Chapter 5 The Game of Criss-Cross Euler Characteristic ( ) Overview. The regions on a map and the faces of a cube both illustrate a very natural sort of situation: they are each examples of regions that
Module 1 Session 1 HS. Critical Areas for Traditional Geometry Page 1 of 6
 Critical Areas for Traditional Geometry Page 1 of 6 There are six critical areas (units) for Traditional Geometry: Critical Area 1: Congruence, Proof, and Constructions In previous grades, students were
Answer Key: Three-Dimensional Cross Sections
 Geometry A Unit Answer Key: Three-Dimensional Cross Sections Name Date Objectives In this lesson, you will: visualize three-dimensional objects from different perspectives be able to create a projection
Mathematics High School Geometry
 Mathematics High School Geometry An understanding of the attributes and relationships of geometric objects can be applied in diverse contexts interpreting a schematic drawing, estimating the amount of
FUZZY DIJKSTRA ALGORITHM FOR SHORTEST PATH PROBLEM IN GEOGRAPHIC INFORMATION SYSTEMS
 ENGLISH SEMINAR FUZZY DIJKSTRA ALGORITHM FOR SHORTEST PATH PROBLEM IN GEOGRAPHIC INFORMATION SYSTEMS Presenter: Huy Nguyen Phuong Contents 1. Introduction to GIS 2. Shortest Path Problem in GIS 3. Dijkstra's
2D rendering takes a photo of the 2D scene with a virtual camera that selects an axis aligned rectangle from the scene. The photograph is placed into
 2D rendering takes a photo of the 2D scene with a virtual camera that selects an axis aligned rectangle from the scene. The photograph is placed into the viewport of the current application window. A pixel
Prime Time (Factors and Multiples)
") CONFIDENCE LEVEL: Prime Time Knowledge Map for 6 th Grade Math Prime Time (Factors and Multiples). A factor is a whole numbers that is multiplied by another whole number to get a product. (Ex: x 5 = ;
CONFIDENCE LEVEL: Prime Time Knowledge Map for 6 th Grade Math Prime Time (Factors and Multiples). A factor is a whole numbers that is multiplied by another whole number to get a product. (Ex: x 5 = ;
pine cone Ratio = 13:8 or 8:5
 Chapter 10: Introducing Geometry 10.1 Basic Ideas of Geometry Geometry is everywhere o Road signs o Carpentry o Architecture o Interior design o Advertising o Art o Science Understanding and appreciating
2003/2010 ACOS MATHEMATICS CONTENT CORRELATION GEOMETRY 2003 ACOS 2010 ACOS
 CURRENT ALABAMA CONTENT PLACEMENT G.1 Determine the equation of a line parallel or perpendicular to a second line through a given point. G.2 Justify theorems related to pairs of angles, including angles
MATHEMATICS Geometry Standard: Number, Number Sense and Operations
 Standard: Number, Number Sense and Operations Number and Number A. Connect physical, verbal and symbolic representations of 1. Connect physical, verbal and symbolic representations of Systems integers,
Year 8 Mathematics Curriculum Map
 Year 8 Mathematics Curriculum Map Topic Algebra 1 & 2 Number 1 Title (Levels of Exercise) Objectives Sequences *To generate sequences using term-to-term and position-to-term rule. (5-6) Quadratic Sequences
Sampling informative/complex a priori probability distributions using Gibbs sampling assisted by sequential simulation
 Sampling informative/complex a priori probability distributions using Gibbs sampling assisted by sequential simulation Thomas Mejer Hansen, Klaus Mosegaard, and Knud Skou Cordua 1 1 Center for Energy Resources
Startup. Why are you here? What are your experiences? What are your major working/research topics? What do you want to learn?
 Startup Why are you here? What are your experiences? What are your major working/research topics? What do you want to learn? Introduction to Geographic information systems Description of a GIS GIS is a
A VERTICAL LOOK AT KEY CONCEPTS AND PROCEDURES GEOMETRY
 A VERTICAL LOOK AT KEY CONCEPTS AND PROCEDURES GEOMETRY Revised TEKS (2012): Building to Geometry Coordinate and Transformational Geometry A Vertical Look at Key Concepts and Procedures Derive and use
SHAPE, SPACE & MEASURE
 STAGE 1 Know the place value headings up to millions Recall primes to 19 Know the first 12 square numbers Know the Roman numerals I, V, X, L, C, D, M Know the % symbol Know percentage and decimal equivalents
Year 8 Review 1, Set 1 Number confidence (Four operations, place value, common indices and estimation)
") Year 8 Review 1, Set 1 Number confidence (Four operations, place value, common indices and estimation) Place value Digit Integer Negative number Difference, Minus, Less Operation Multiply, Multiplication,
Year 8 Review 1, Set 1 Number confidence (Four operations, place value, common indices and estimation) Place value Digit Integer Negative number Difference, Minus, Less Operation Multiply, Multiplication,
3rd Quarter MATHEMATICS Pointers to Review S.Y
 Grade 1 Grouping Count groups of equal quantity using concrete objects up to 50 and writes an equivalent expression. e.g. 2 groups of 5 Visualizes, represents, and separates objects into groups of equal
Precalculus, Quarter 2, Unit 2.1. Trigonometry Graphs. Overview
 13 Precalculus, Quarter 2, Unit 2.1 Trigonometry Graphs Overview Number of instructional days: 12 (1 day = 45 minutes) Content to be learned Convert between radian and degree measure. Determine the usefulness
Generating Vectors Overview
 Generating Vectors Overview Vectors are mathematically defined shapes consisting of a series of points (nodes), which are connected by lines, arcs or curves (spans) to form the overall shape. Vectors can
Buds Public School, Dubai
 Buds Public School, Dubai Subject: Maths Grade: 11 AB Topic: Statistics, Probability, Trigonometry, 3D, Conic Section, Straight lines and Limits and Derivatives Statistics and Probability: 1. Find the
Lecture 18 Representation and description I. 2. Boundary descriptors
 Lecture 18 Representation and description I 1. Boundary representation 2. Boundary descriptors What is representation What is representation After segmentation, we obtain binary image with interested regions
Purpose: To explore the raster grid and vector map element concepts in GIS.
 GIS INTRODUCTION TO RASTER GRIDS AND VECTOR MAP ELEMENTS c:wou:nssi:vecrasex.wpd Purpose: To explore the raster grid and vector map element concepts in GIS. PART A. RASTER GRID NETWORKS Task A- Examine
Geometry Curriculum Map
 Quadrilaterals 7.1 Interior Angle Sum Theorem 7.2 Exterior Angle Sum Theorem 7.3 Using Interior and Exterior Angles to Solve Problems Define the Angle Sum Theorem. Illustrate interior angles with the Angle
EULER S FORMULA AND THE FIVE COLOR THEOREM
 EULER S FORMULA AND THE FIVE COLOR THEOREM MIN JAE SONG Abstract. In this paper, we will define the necessary concepts to formulate map coloring problems. Then, we will prove Euler s formula and apply
Announcements. Data Sources a list of data files and their sources, an example of what I am looking for:
 Data Announcements Data Sources a list of data files and their sources, an example of what I am looking for: Source Map of Bangor MEGIS NG911 road file for Bangor MEGIS Tax maps for Bangor City Hall, may
Dgp _ lecture 2. Curves
 Dgp _ lecture 2 Curves Questions? This lecture will be asking questions about curves, their Relationship to surfaces, and how they are used and controlled. Topics of discussion will be: Free form Curves
Year 8 Unit 12 - shape properties
 Year 8 Unit 12 - shape properties Foundation Able to recall the names of quadrilaterals, types of triangles and other simple polygons and to identify their properties. Secure Classify and name shapes Recognise
KS3 MATHEMATICS THRESHOLD DESCRIPTORS NUMBER (Incl. RATIO & PROPORTION)
") KS3 MATHEMATICS THRESHOLD DESCRIPTORS NUMBER (Incl. RATIO & PROPORTION) Topic Integers Decimals Approximation Fractions Concepts and skills Read, write, order and compare positive integers up to 1000 Add
KS3 MATHEMATICS THRESHOLD DESCRIPTORS NUMBER (Incl. RATIO & PROPORTION) Topic Integers Decimals Approximation Fractions Concepts and skills Read, write, order and compare positive integers up to 1000 Add
9-1 GCSE Maths. GCSE Mathematics has a Foundation tier (Grades 1 5) and a Higher tier (Grades 4 9).
 and a Higher tier (Grades 4 9).") 9-1 GCSE Maths GCSE Mathematics has a Foundation tier (Grades 1 5) and a Higher tier (Grades 4 9). In each tier, there are three exams taken at the end of Year 11. Any topic may be assessed on each of
9-1 GCSE Maths GCSE Mathematics has a Foundation tier (Grades 1 5) and a Higher tier (Grades 4 9). In each tier, there are three exams taken at the end of Year 11. Any topic may be assessed on each of
Geometry. (F) analyze mathematical relationships to connect and communicate mathematical ideas; and
 analyze mathematical relationships to connect and communicate mathematical ideas; and") (1) Mathematical process standards. The student uses mathematical processes to acquire and demonstrate mathematical understanding. The student is (A) apply mathematics to problems arising in everyday life,
(1) Mathematical process standards. The student uses mathematical processes to acquire and demonstrate mathematical understanding. The student is (A) apply mathematics to problems arising in everyday life,
Maths Assessment Framework Year 8
 Success Criteria for all assessments: Higher Tier Foundation Tier 90% 9 80% 6 80% 8 70% 7 60% 5 60% 6 50% 5 40% 4 Please note the GCSE Mathematics is one of the first GCSEs which will be graded by number
Geometry: Concept Categories Concept Category 1 (CC1): Transformations & Basic Definitions
: Transformations & Basic Definitions") Concept Category 1 (CC1): Transformations & Basic Definitions Concept Category 2 (CC2): Triangles (Similarity and Properties) Concept Category 3 (CC3): Triangle Trigonometry Concept Category 4 (CC4): Triangle
Concept Category 1 (CC1): Transformations & Basic Definitions Concept Category 2 (CC2): Triangles (Similarity and Properties) Concept Category 3 (CC3): Triangle Trigonometry Concept Category 4 (CC4): Triangle
Topic 6 Representation and Description
 Topic 6 Representation and Description Background Segmentation divides the image into regions Each region should be represented and described in a form suitable for further processing/decision-making Representation
Object-Based Classification & ecognition. Zutao Ouyang 11/17/2015
 Object-Based Classification & ecognition Zutao Ouyang 11/17/2015 What is Object-Based Classification The object based image analysis approach delineates segments of homogeneous image areas (i.e., objects)
A NURBS-BASED APPROACH FOR SHAPE AND TOPOLOGY OPTIMIZATION OF FLOW DOMAINS
 6th European Conference on Computational Mechanics (ECCM 6) 7th European Conference on Computational Fluid Dynamics (ECFD 7) 11 15 June 2018, Glasgow, UK A NURBS-BASED APPROACH FOR SHAPE AND TOPOLOGY OPTIMIZATION
TEACHER CERTIFICATION STUDY GUIDE KNOWLEDGE OF MATHEMATICS THROUGH SOLVING...1
 TABLE OF CONTENTS COMPETENCY/SKILLS PG # COMPETENCY 1 KNOWLEDGE OF MATHEMATICS THROUGH PROBLEM SOLVING...1 Skill 1.1 Skill 1.2 Skill 1.3 Skill 1.4 Identify appropriate mathematical problems from real-world
Watershed Sciences 4930 & 6920 ADVANCED GIS
 Slides by Wheaton et al. (2009-2014) are licensed under a Creative Commons Attribution-NonCommercial-ShareAlike 3.0 Unported License Watershed Sciences 4930 & 6920 ADVANCED GIS VECTOR ANALYSES Joe Wheaton
Ohio Tutorials are designed specifically for the Ohio Learning Standards to prepare students for the Ohio State Tests and end-ofcourse
 Tutorial Outline Ohio Tutorials are designed specifically for the Ohio Learning Standards to prepare students for the Ohio State Tests and end-ofcourse exams. Math Tutorials offer targeted instruction,
Section G. POSITIONAL ACCURACY DEFINITIONS AND PROCEDURES Approved 3/12/02
 Section G POSITIONAL ACCURACY DEFINITIONS AND PROCEDURES Approved 3/12/02 1. INTRODUCTION Modern surveying standards use the concept of positional accuracy instead of error of closure. Although the concepts
Mathematics Year 9-11 Skills and Knowledge Checklist. Name: Class: Set : 1 Date Year 9 MEG :
 Personal targets to help me achieve my grade : AFL Sheet Number 1 : Standard Form, Decimals, Fractions and Percentages Standard Form I can write a number as a product of it s prime factors I can use the
4. Write sets of directions for how to check for direct variation. How to check for direct variation by analyzing the graph :
 Name Direct Variations There are many relationships that two variables can have. One of these relationships is called a direct variation. Use the description and example of direct variation to help you
Year 8 Set 2 : Unit 1 : Number 1
 Year 8 Set 2 : Unit 1 : Number 1 Learning Objectives: Level 5 I can order positive and negative numbers I know the meaning of the following words: multiple, factor, LCM, HCF, prime, square, square root,
Definition DQ measure / description Evaluation scope Applicable to spatial representation types
 DRAFT DATA QUALITY CHECKLIST drafted: 17 January 2018, Monaco for DQWG-13 Author: R. Broekman (DQWG-Chair) This list is derived from ISO 19157. Definitions and descriptions are a direct copy of ISO-19157.
Supervised Learning. CS 586 Machine Learning. Prepared by Jugal Kalita. With help from Alpaydin s Introduction to Machine Learning, Chapter 2.
 Supervised Learning CS 586 Machine Learning Prepared by Jugal Kalita With help from Alpaydin s Introduction to Machine Learning, Chapter 2. Topics What is classification? Hypothesis classes and learning
A DATA DRIVEN METHOD FOR FLAT ROOF BUILDING RECONSTRUCTION FROM LiDAR POINT CLOUDS
 A DATA DRIVEN METHOD FOR FLAT ROOF BUILDING RECONSTRUCTION FROM LiDAR POINT CLOUDS A. Mahphood, H. Arefi *, School of Surveying and Geospatial Engineering, College of Engineering, University of Tehran,
Clustering Algorithm (DBSCAN) VISHAL BHARTI Computer Science Dept. GC, CUNY
 VISHAL BHARTI Computer Science Dept. GC, CUNY") Clustering Algorithm (DBSCAN) VISHAL BHARTI Computer Science Dept. GC, CUNY Clustering Algorithm Clustering is an unsupervised machine learning algorithm that divides a data into meaningful sub-groups,
Clustering Algorithm (DBSCAN) VISHAL BHARTI Computer Science Dept. GC, CUNY Clustering Algorithm Clustering is an unsupervised machine learning algorithm that divides a data into meaningful sub-groups,
A Distributed Approach to Fast Map Overlay
 A Distributed Approach to Fast Map Overlay Peter Y. Wu Robert Morris University Abstract Map overlay is the core operation in many GIS applications. We briefly survey the different approaches, and describe
Ohio Tutorials are designed specifically for the Ohio Learning Standards to prepare students for the Ohio State Tests and end-ofcourse
 Tutorial Outline Ohio Tutorials are designed specifically for the Ohio Learning Standards to prepare students for the Ohio State Tests and end-ofcourse exams. Math Tutorials offer targeted instruction,
Pre AP Geometry. Mathematics Standards of Learning Curriculum Framework 2009: Pre AP Geometry
 Pre AP Geometry Mathematics Standards of Learning Curriculum Framework 2009: Pre AP Geometry 1 The content of the mathematics standards is intended to support the following five goals for students: becoming
An Introduction to Markov Chain Monte Carlo
 An Introduction to Markov Chain Monte Carlo Markov Chain Monte Carlo (MCMC) refers to a suite of processes for simulating a posterior distribution based on a random (ie. monte carlo) process. In other
Programs for MDE Modeling and Conditional Distribution Calculation
 Programs for MDE Modeling and Conditional Distribution Calculation Sahyun Hong and Clayton V. Deutsch Improved numerical reservoir models are constructed when all available diverse data sources are accounted
Chislehurst and Sidcup Grammar School Mathematics Department Year 9 Programme of Study
 Chislehurst and Sidcup Grammar School Mathematics Department Year 9 Programme of Study Timings Topics Autumn Term - 1 st half (7 weeks - 21 lessons) 1. Algebra 1: Expressions, Formulae, Equations and Inequalities
INTRODUCTION POSITIONAL ERROR SIMULATION
 Page 1 of 8 Characteristics of the positional errors of historical maps Tomaž Podobnikar Scientific Research Centre of the Slovenian Academy for Sciences and Arts, Novi trg 2, SI-1000 Ljubljana, Slovenia
Computergrafik. Matthias Zwicker Universität Bern Herbst 2016
 Computergrafik Matthias Zwicker Universität Bern Herbst 2016 Today Curves NURBS Surfaces Parametric surfaces Bilinear patch Bicubic Bézier patch Advanced surface modeling 2 Piecewise Bézier curves Each
Adaptive spatial resampling as a Markov chain Monte Carlo method for uncertainty quantification in seismic reservoir characterization
 1 Adaptive spatial resampling as a Markov chain Monte Carlo method for uncertainty quantification in seismic reservoir characterization Cheolkyun Jeong, Tapan Mukerji, and Gregoire Mariethoz Department
TOPICS. Integers Properties of addition and. Rational Numbers Need for rational numbers. Exponents or Powers Introduction to Exponents or
 TOPICS DETAILS Integers Properties of addition and subtraction of integers Multiplication of integers Properties of multiplication of integers Division of integers Properties of division of integers Introduction
Planar Graphs. 1 Graphs and maps. 1.1 Planarity and duality
 Planar Graphs In the first half of this book, we consider mostly planar graphs and their geometric representations, mostly in the plane. We start with a survey of basic results on planar graphs. This chapter
BODMAS and Standard Form. Integers. Understand and use coordinates. Decimals. Introduction to algebra, linear equations
 HIGHER REVISION LIST FOUNDATION REVISION LIST Topic Objectives Topic Objectives BODMAS and Standard Form * Add, subtract, multiply and divide whole numbers, integers and decimals * Order integers and decimals
NUMERICAL METHOD TO ESTIMATE TOLERANCES COMBINED EFFECTS ON A MECHANICAL SYSTEM
 INTERNATIONAL DESIGN CONFERENCE - DESIGN 2004 Dubrovnik, May 18-21, 2004. NUMERICAL METHOD TO ESTIMATE TOLERANCES COMBINED EFFECTS ON A MECHANICAL SYSTEM D. Cambiaghi, A. Magalinia and D. Vetturi Keywords:
Overview.! Manual Digitizing! Heads-up Digitizing! Common Errors! Summary! Heads-up Digitizing Tutorial
 Digitizing Overview! Manual Digitizing! Heads-up Digitizing! Common Errors! Summary! Heads-up Digitizing Tutorial Manual Digitizing! Simplest, easiest, and cheapest method of capturing vector data from
104, 107, 108, 109, 114, 119, , 129, 139, 141, , , , , 180, , , 128 Ch Ch1-36
 111.41. Geometry, Adopted 2012 (One Credit). (c) Knowledge and skills. Student Text Practice Book Teacher Resource: Activities and Projects (1) Mathematical process standards. The student uses mathematical