2D vector fields 3. Contents. Line Integral Convolution (LIC) Image based flow visualization Vector field topology. Fast LIC Oriented LIC
|
|
|
- Edward Underwood
- 6 years ago
- Views:
Transcription
1 2D vector fields 3 Scientific Visualization (Part 8) PD Dr.-Ing. Peter Hastreiter Contents Line Integral Convolution (LIC) Fast LIC Oriented LIC Image based flow visualization Vector field topology 2 Applied Visualization, SS0


2 Line integral convolution 3 Applied Visualization, SS0 Line integral convolution LIC Main idea Traditional methods inappropriate for dense vector fields Visualize dense flow fields by imaging its integral curves Cover domain with random texture So called input texture (usually stationary white noise) Blur (convolve) the input texture along the path lines of underlying vector field using a specified filter kernel 4 Applied Visualization, SS0

3 Line integral convolution Appearance of 2D LIC images Intensity distribution along path lines shows high correlation No correlation between neighboring path lines 5 Applied Visualization, SS0 Line integral convolution Literature B. Cabral, L. Leedom: Imaging vector fields using Line Integral Convolution, SIGGRAPH 993 D. Stalling, H.-C. Hege: Fast and resolution independent Line Integral Convolution, SIGGRAPH Applied Visualization, SS0
4 Line integral convolution Algorithm for 2D LIC t Ф 0 (t) : path line containing the point (x 0,y 0 ) T(x,y) : randomly generated input texture k : filter kernel Compute pixel intensity as: (convolution with kernel) Kernel: Finite support [-L,L] Normalized Often simple box filter Often symmetric (isotropic) I( x 0 -L, y 0 kernel k(t) + L ) = k( t) T ( φ0( t)) dt L = k ( T oφ ) L -L k 0 () t dt = L 7 Applied Visualization, SS0 Line integral convolution Algorithm for 2D LIC Convolve a random texture along the streamlines flow data streamline integration convolution white noise result LIC texel 8 Applied Visualization, SS0
 L")


5 Line integral convolution Input noise Vector field Convolution kernel k(t) L -L k () t dt = -L L Final image 9 Applied Visualization, SS0 Line integral convolution quite laminar flow quite turbulent flow 0 Applied Visualization, SS0


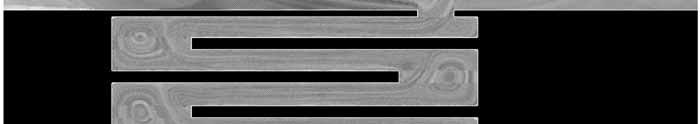
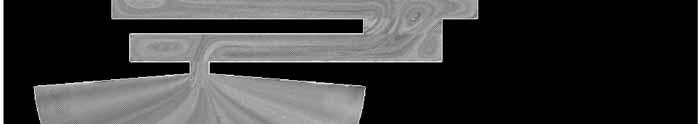
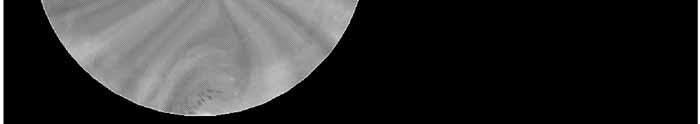
6 Line integral convolution Air-bag Applied Visualization, SS0 Line integral convolution Air-bag Temperature during opening high low 2 Applied Visualization, SS0

7 Line integral convolution 3 Applied Visualization, SS0 Line integral convolution 4 Applied Visualization, SS0
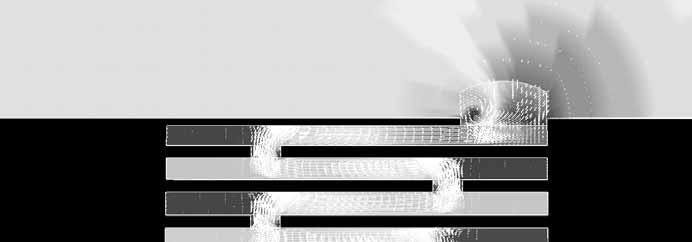
8 Fast Line integral convolution 5 Applied Visualization, SS0 Fast LIC Problems with LIC New streamline is computed at each pixel Convolution (integral) is computed at each pixel Slow Idea Compute very long streamlines Reuse these streamlines for many different pixels Incremental computation of the convolution integral 6 Applied Visualization, SS0
9 Fast LIC Incremental integration Discretization of convolution integral Summation T L x L T n x n Assumption: box filter k () t = 2 L+ T 0 x 0 L I0 = 2L+ T i i= -L x -m T -m T -L x -L 7 Applied Visualization, SS0 Fast LIC Incremental integration Next position I T L T n x L x n Assumption: box filter k () t = 2 L+ T 0 x 0 L I0 = 2L+ T i i= -L x -m T -m T -L I I + ( ) x -L = 0 + 2L + T L T -L 8 Applied Visualization, SS0
10 Fast LIC Incremental integration for constant kernel Given Streamline x -m,..., x 0,..., x n with m,n L Given texture values T -m,...,t 0,...,T n What are the convolution results: I -m+l,..., I 0,..., I n-l? j + L I j = 2L+ i= j-l T Incremental integration: i (j+ ) + L j+ L = = 2L+ Ti 2L+ Ti + TL+ j+ T L+ i= (j+ )-L i= j-l I j+ ( T T ) = ( T T ) L I j+ I j = 2L+ i+ j+ i+ j 2L+ L+ j+ -L+ j i= -L 9 Applied Visualization, SS0 j For box filter (constant kernel): Fast LIC Incremental integration for polynomial kernels Assumption: polynomial kernel (monom representation) d () i = k p= 0 α p i p Value I j = d p= 0 α p I p j with I p j = L i = -L T j+ i i p 20 Applied Visualization, SS0
11 Fast LIC Incremental integration for polynomial kernels Incremental update for p I j ( T T ) p p L I j+ I j = = i -L j i j i i p p p p p Tj i ( i ) i ) + Tj+ L+ L Tj L ( -L ) p Λ j L = i = -L + = p- q= 0 p p-q p ( )( ) + Λ q I q j j+ 2 Applied Visualization, SS0 Fast LIC Algorithm Data structure for output: luminance/alpha image numhits(p) = number of streamline hits at pixel p for each pixel p if (numhits(p) < minhits) then initialize streamline computation with x0 = center of p compute convolution I(x 0 ) add result to intensity of pixel p set m = while m < some limit M incremental convolution to obtain I(x m ) and I(x -m ) add results to intensity(p(x m )) and intensity(p(x -m )) set m = m + for each pixel p normalize all pixels according to numhits(p) 22 Applied Visualization, SS0

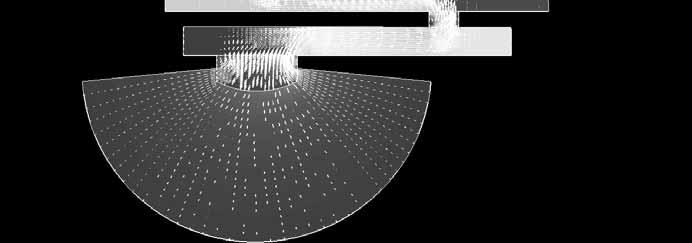
12 Oriented Line integral convolution 23 Applied Visualization, SS0 Oriented LIC (OLIC) Visualization of orientation (in addition to direction) Sparse texture Anisotropic convolution kernel Acceleration Integrate individual drops and compose them to final image anisotropic convolution kernel -l l 24 Applied Visualization, SS0
 25 Applied")


13 Oriented LIC (OLIC) 25 Applied Visualization, SS0 Image based flow visualization 26 Applied Visualization, SS0
![Image based flow visualization (IBFV) van Wijk [SIGGRAPH, 2002] Can simulate LIC, pathlines, but also much more Animated flow](/docs-images/75/71691070/images/14-0.jpg "visualization Exploits graphics hardware Demo and paper http://www.win.tue.")
d k + αb Image distortion and blending can be")
14 Image based flow visualization (IBFV) van Wijk [SIGGRAPH, 2002] Can simulate LIC, pathlines, but also much more Animated flow visualization Exploits graphics hardware Demo and paper 27 Applied Visualization, SS0 Image based flow visualization (IBFV) Image k image k+: Image k: I k Distort image k according to vector field D k Blend distorted image with background image B: I k+ = (-α)d k + αb Image distortion and blending can be done efficiently by graphics hardware 28 Applied Visualization, SS0


15 Image based flow visualization (IBFV) IBFV path lines Starting points of path lines set in background image Example Background image is a grid of dots 29 Applied Visualization, SS0 Image based flow visualization (IBFV) IBFV-LIC Background image is random noise texture IBFV-animated LIC Background image is animated noise texture 30 Applied Visualization, SS0
")


16 Image based flow visualization (IBFV) Many other possibilities 3 Applied Visualization, SS0 LIC summary 32 Applied Visualization, SS0

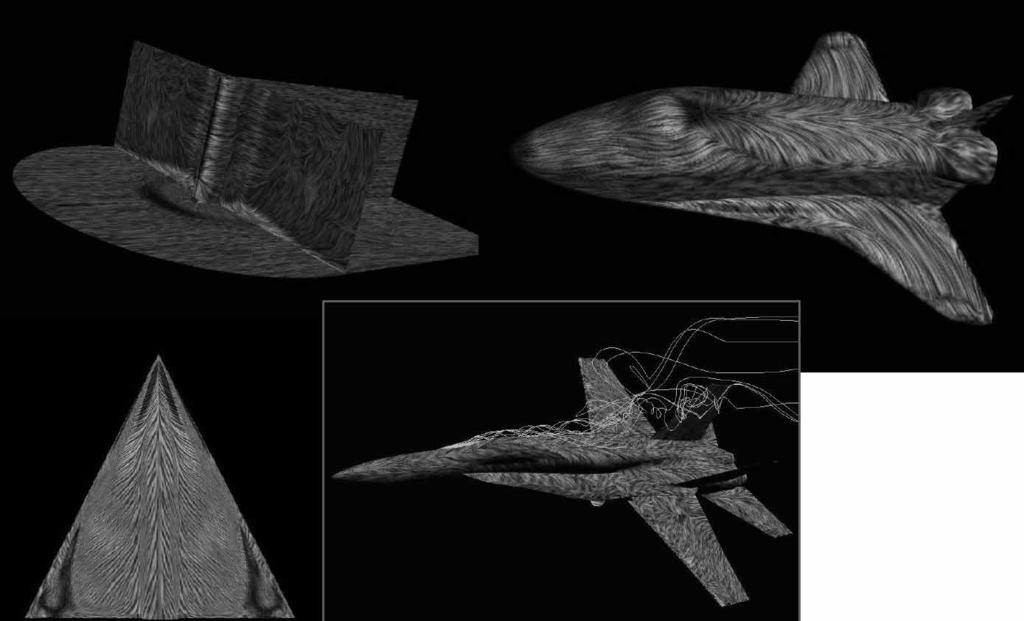
17 LIC Summary Dense representation of flow fields Convolution along streamlines correlation along streamlines For 2D and 3D flows Stationary flows Extensions Unsteady flows Animation Texture advection 33 Applied Visualization, SS0 LIC Summary LIC representation of a 3D vector field 34 Applied Visualization, SS0
18 Vector field topology 35 Applied Visualization, SS0 Vector field topology Idea Draw not all but just important streamlines Show only topological skeletons Choose start point not interactively but automatically Important points in the vector field: Critical points Algorithms described above have problems handling them 36 Applied Visualization, SS0
19 Vector field topology Critical points Points where the vector field vanishes: v = 0 Points where the vector magnitude goes to zero and the vector direction is undefined Critical points are connected to divide the flow into regions with similar properties Start at critical point in direction of eigenvector Terminate at the border or in other critical point Question How do integral curves, the flow or particle lines look like in the neighborhood of critical points? 37 Applied Visualization, SS0 Vector field topology Taylor expansion For the velocity field around a critical point p c 2 v( p) = v( p ) + v ( p p ) + O( p p ) c J ( p p c ) c c Note that v(p c ) vanishes because of critical point property! Jacobian of v with respect to p c Note that this is different to the Jacobian between C- and P-space vx x v r = vy y vx y v y y Assume p c = (0,0) very simple DGL v(p) = Jp c 38 Applied Visualization, SS0
20 Vector field topology Subdivide the Jacobian J = J s + J a = 2 T ( J + J ) + ( J J T ) Symmetric part T J s = J + J 2 Anti-symmetric part J a = 2 ( ) T ( J J ) Compare with complex numbers z = a + jb Re( z) = * z = a jb Im( z) = z + z 2 z z 2 * * 39 Applied Visualization, SS0 Vector field topology Symmetric part Can be solved to give real eigenvalues R and real eigenvectors p s J p = s s Rp s R = R R 2,, R 3 Eigenvectors p s are an orthonormal set of vectors Describes change of size along eigenvectors Describes flow into or out of region around critical point 40 Applied Visualization, SS0
21 4 Applied Visualization, SS0 Vector field topology Anti-symmetric part Describes rotation of difference vector d = (p - p c ) Can be solved to give imaginary eigenvalues I ( ) ( ) d v d d J J d J = = = r 2 y z x z z y x y z x y x 2 T z y z x y z y x x z x y v v v v v v v v v v v v a 3 2,, I I I I = a a a Ip p J = 42 Applied Visualization, SS0 Vector field topology Integral curves If λ,2 are eigenvalues and ξ,2 eigenvectors of the Jacobian, then a solution is Where β,2 are arbitrary constants Note that a variation of β,2 results in all particle lines Two relevant general cases can appear: 2 real eigenvalues 2 complex eigenvalues λ,2 = R ± ii ) exp( ) exp( ) ( ξ λ β ξ λ β t t t r + =
22 Vector field topology Case : two real eigenvalues Three cases, depending on sign of eigenvalues Attracting node: R, R 2 < 0 and I, I 2 = 0 Repelling node: R, R 2 > 0 and I, I 2 = 0 Saddle point: R < 0 < R 2 and I, I 2 = 0 43 Applied Visualization, SS0 Vector field topology Case 2: two complex eigenvalues R ± ii Attracting / repelling force: R Rotating force: I Attracting focus: R, R 2 < 0 and I, I 2 0 Repelling focus: R, R 2 > 0 and I, I 2 0 Center: R, R 2 = 0 and I, I Applied Visualization, SS0
23 Vector field topology Examples 2 real eigenvalues λ < 0 < λ 2 2 complex eigenvalues Re λ < 0 45 Applied Visualization, SS0 Vector field topology How to find critical points Cell search (for cells which contain critical points) a) Mark vertices by (+,+), (, ), (+, ) or (,+) depending on signs of v x and v y b) Determine cells with sign changes of vertices in both components these are the cells that contain critical points c) Find the critical points by interpolation How to find critical points within a (quad) cell? Determine intersection of isolines (c=0) of two components Two bilinear equations to be solved (or one quadratic equation) Critical points are the solutions within the cell boundaries (yes, yes) (no, yes) (+,+) (+,+) (+,+) (, ) (+, ) (+, ) 46 Applied Visualization, SS0 v y =0 vx =0
24 Vector field topology How to find critical points (cont.) How to find critical points within a simplex? Based on barycentric interpolation Solve analytically Alternative method: Iterative approach based on 2D / 3D nested intervals Recursive subdivision into 4 / 8 sub-regions if critical point is contained in cell 47 Applied Visualization, SS0 Vector field topology Example: topological graph of 2D flow field 48 Applied Visualization, SS0
25 Vector field topology Example: depiction of integral curves Image: A Combinatorial Introduction to Topology, Michael Henle 49 Applied Visualization, SS0 Vector field topology Sectors and Separatrices In the vicinity of a critical point, there are various sectors or regions of different flow type Hyperbolic: paths do not ever reach the critical point Parabolic: one end of all paths is at the critical point Elliptic: all paths begin & end at the critical point A separatrix is the bounding curve (or surface) which separates these regions 50 Applied Visualization, SS0
26 Vector field topology Sectors and Separatrices (cont.) Images: A topology simplification method for 2D vector fields. Xavier Tricoche, Gerik Scheuermann, Hans Hagen, IEEE Visualization Applied Visualization, SS0 Vector field topology Sectors and Separatrices (cont.) Planar topology of a vector field is a graph with the critical points as nodes and the separatrices as edges 52 Applied Visualization, SS0


27 Vector field topology Further examples Topology-guided streamline positioning 53 Applied Visualization, SS0 Vector field topology Summary Draw only relevant streamlines (topological skeleton) Partition domain in regions with similar flow features Based on critical points Good for 2D stationary flows Unsteady flows? 3D? 54 Applied Visualization, SS0
Texture Advection. Ronald Peikert SciVis Texture Advection 6-1
 Texture Advection Ronald Peikert SciVis 2007 - Texture Advection 6-1 Texture advection Motivation: dense visualization of vector fields, no seed points needed. Methods for static fields: LIC - Line integral
Chapter 6 Visualization Techniques for Vector Fields
 Chapter 6 Visualization Techniques for Vector Fields 6.1 Introduction 6.2 Vector Glyphs 6.3 Particle Advection 6.4 Streamlines 6.5 Line Integral Convolution 6.6 Vector Topology 6.7 References 2006 Burkhard
Visualization, Lecture #2d. Part 3 (of 3)
") Visualization, Lecture #2d Flow visualization Flow visualization, Part 3 (of 3) Retrospect: Lecture #2c Flow Visualization, Part 2: FlowVis with arrows numerical integration Euler-integration Runge-Kutta-integration
Visualization, Lecture #2d Flow visualization Flow visualization, Part 3 (of 3) Retrospect: Lecture #2c Flow Visualization, Part 2: FlowVis with arrows numerical integration Euler-integration Runge-Kutta-integration
3D vector fields. Contents. Introduction 3D vector field topology Representation of particle lines. 3D LIC Combining different techniques
 3D vector fields Scientific Visualization (Part 9) PD Dr.-Ing. Peter Hastreiter Contents Introduction 3D vector field topology Representation of particle lines Path lines Ribbons Balls Tubes Stream tetrahedra
Flow Visualization with Integral Objects. Visualization, Lecture #2d. Streamribbons, Streamsurfaces, etc. Flow visualization, Part 3 (of 3)
") Visualization, Lecture #2d Flow visualization, Part 3 (of 3) Flow Visualization with Integral Objects Streamribbons, Streamsurfaces, etc. Retrospect: Lecture #2c Flow Visualization, Part 2: FlowVis with
Visualization, Lecture #2d Flow visualization, Part 3 (of 3) Flow Visualization with Integral Objects Streamribbons, Streamsurfaces, etc. Retrospect: Lecture #2c Flow Visualization, Part 2: FlowVis with
Comparing LIC and Spot Noise
 Comparing LIC and Spot Noise Wim de Leeuw Robert van Liere Center for Mathematics and Computer Science, CWI Abstract Spot noise and line integral convolution (LIC) are two texture synthesis techniques
Scaling the Topology of Symmetric, Second-Order Planar Tensor Fields
 Scaling the Topology of Symmetric, Second-Order Planar Tensor Fields Xavier Tricoche, Gerik Scheuermann, and Hans Hagen University of Kaiserslautern, P.O. Box 3049, 67653 Kaiserslautern, Germany E-mail:
Vector Visualization. CSC 7443: Scientific Information Visualization
 Vector Visualization Vector data A vector is an object with direction and length v = (v x,v y,v z ) A vector field is a field which associates a vector with each point in space The vector data is 3D representation
Continuous Topology Simplification of Planar Vector Fields
 Continuous Topology Simplification of Planar Vector Fields Xavier Tricoche 1 Gerik Scheuermann 1 Hans Hagen 1 Abstract Vector fields can present complex structural behavior, especially in turbulent computational
Topology Simplification for Turbulent Flow Visualization
 Topology Simplification for Turbulent Flow Visualization Xavier Tricoche University of Kaiserslautern Department of Computer Science, Computer Graphics & CAGD P.O. Box 3049, D-67653 Kaiserslautern Germany
A Topology Simplification Method For 2D Vector Fields
 A Topology Simplification Method For 2D Vector Fields Xavier Tricoche Gerik Scheuermann Hans Hagen University of Kaiserslautern Department of Computer Science P.. Box 3049, D-67653 Kaiserslautern Germany
Topology-Based Visualization of Time-Dependent 2D Vector Fields
 Topology-Based Visualization of Time-Dependent 2D Vector Fields Xavier Tricoche, Gerik Scheuermann, and Hans Hagen University of Kaiserslautern P.O. Box 3049, D-67653 Kaiserslautern Germany E-mail: ftricoche
Over Two Decades of IntegrationBased, Geometric Vector Field. Visualization
 Over Two Decades of IntegrationBased, Geometric Vector Field Visualization Tony McLoughlin1, 1, Ronald Peikert2, Frits H. Post3, and Min Chen1 1 The Visual and Interactive Computing Group Computer Science
Vector Visualization
 Vector Visualization Vector Visulization Divergence and Vorticity Vector Glyphs Vector Color Coding Displacement Plots Stream Objects Texture-Based Vector Visualization Simplified Representation of Vector
Flow Visualisation 1
 Flow Visualisation Visualisation Lecture 13 Institute for Perception, Action & Behaviour School of Informatics Flow Visualisation 1 Flow Visualisation... so far Vector Field Visualisation vector fields
Continuous Topology Simplification of Planar Vector Fields
 Continuous Topology Simplification of Planar Vector Fields Xavier Tricoche Gerik Scheuermann Hans Hagen E-mail: University of Kaiserslautern Department of Computer Science P.O. Box 3049, D-67653 Kaiserslautern
Computer Vision I - Filtering and Feature detection
 Computer Vision I - Filtering and Feature detection Carsten Rother 30/10/2015 Computer Vision I: Basics of Image Processing Roadmap: Basics of Digital Image Processing Computer Vision I: Basics of Image
Vector Field Visualisation
 Vector Field Visualisation Computer Animation and Visualization Lecture 14 Institute for Perception, Action & Behaviour School of Informatics Visualising Vectors Examples of vector data: meteorological
8. Tensor Field Visualization
 8. Tensor Field Visualization Tensor: extension of concept of scalar and vector Tensor data for a tensor of level k is given by t i1,i2,,ik (x 1,,x n ) Second-order tensor often represented by matrix Examples:
Motion Estimation. There are three main types (or applications) of motion estimation:
 of motion estimation:") Members: D91922016 朱威達 R93922010 林聖凱 R93922044 謝俊瑋 Motion Estimation There are three main types (or applications) of motion estimation: Parametric motion (image alignment) The main idea of parametric motion
Members: D91922016 朱威達 R93922010 林聖凱 R93922044 謝俊瑋 Motion Estimation There are three main types (or applications) of motion estimation: Parametric motion (image alignment) The main idea of parametric motion
Eigenvector-based Interpolation and Segmentation of 2D Tensor Fields
 Eigenvector-based Interpolation and Segmentation of 2D Tensor Fields Jaya Sreevalsan-Nair 1, Cornelia Auer 2, Bernd Hamann 3, and Ingrid Hotz 2 1 Texas Advanced Computing Center, University of Texas at
The State of the Art in Flow Visualization: Dense and Texture-Based Techniques
 Volume 23 (2004), number 2 pp. 203 221 COMPUTER GRAPHICS forum The State of the Art in Flow Visualization: Dense and Texture-Based Techniques Robert S. Laramee, 1 Helwig Hauser, 1 Helmut Doleisch, 1 Benjamin
The State of the Art in Flow Visualization: Dense and Texture-Based Techniques
 Volume 22 (2003), Number 2, yet unknown pages The State of the Art in Flow Visualization: Dense and Texture-Based Techniques Robert S. Laramee, 1 Helwig Hauser, 1 Helmut Doleisch, 1 Benjamin Vrolijk, 2
Flow Visualization with Integral Surfaces
 Flow Visualization with Integral Surfaces Visual and Interactive Computing Group Department of Computer Science Swansea University R.S.Laramee@swansea.ac.uk 1 1 Overview Flow Visualization with Integral
Physically-Based Modeling and Animation. University of Missouri at Columbia
 Overview of Geometric Modeling Overview 3D Shape Primitives: Points Vertices. Curves Lines, polylines, curves. Surfaces Triangle meshes, splines, subdivision surfaces, implicit surfaces, particles. Solids
Computer Vision I - Basics of Image Processing Part 2
 Computer Vision I - Basics of Image Processing Part 2 Carsten Rother 07/11/2014 Computer Vision I: Basics of Image Processing Roadmap: Basics of Digital Image Processing Computer Vision I: Basics of Image
Interactive Visualization of Divergence in Unsteady Flow by Level-Set Dye Advection
 Interactive Visualization of Divergence in Unsteady Flow by Level-Set Dye Advection Daniel Weiskopf Ralf Botchen Thomas Ertl Universität Stuttgart Abstract Dye advection is an intuitive and versatile technique
Hardware-Accelerated Lagrangian-Eulerian Texture Advection for 2D Flow Visualization
 Hardware-Accelerated Lagrangian-Eulerian Texture Advection for 2D Flow Visualization Daniel Weiskopf 1 Gordon Erlebacher 2 Matthias Hopf 1 Thomas Ertl 1 1 Visualization and Interactive Systems Group, University
A Level-Set Method for Flow Visualization
 A Level-Set Method for Flow Visualization Rüdiger Westermann, Christopher Johnson, and Thomas Ertl Scientific Computing and Visualization Group, University of Technology Aachen Scientific Computing and
Simulation vs. measurement vs. modelling 2D vs. surfaces vs. 3D Steady vs time-dependent d t flow Direct vs. indirect flow visualization
 Flow Visualization Overview: Flow Visualization (1) Introduction, overview Flow data Simulation vs. measurement vs. modelling 2D vs. surfaces vs. 3D Steady vs time-dependent d t flow Direct vs. indirect
Vector Field Visualization: Introduction
 Vector Field Visualization: Introduction What is a Vector Field? Why It is Important? Vector Fields in Engineering and Science Automotive design [Chen et al. TVCG07,TVCG08] Weather study [Bhatia and Chen
Lecture notes: Visualization I Visualization of vector fields using Line Integral Convolution and volume rendering
 Lecture notes: Visualization I Visualization of vector fields using Line Integral Convolution and volume rendering Anders Helgeland FFI Chapter 1 Visualization techniques for vector fields Vector fields
Vector Visualization
 Vector Visualization 5-1 Vector Algorithms Vector data is a three-dimensional representation of direction and magnitude. Vector data often results from the study of fluid flow, or when examining derivatives,
Texture-Based Visualization of Uncertainty in Flow Fields
 Texture-Based Visualization of Uncertainty in Flow Fields Ralf P. Botchen 1 Daniel Weiskopf 1,2 Thomas Ertl 1 1 University of Stuttgart 2 Simon Fraser University Figure 1: Three different advection schemes
Preprint. DOI Bookmark:
 General Copyright Notice The documents distributed by this server have been provided by the contributing authors as a means to ensure timely dissemination of scholarly and technical work on a noncommercial
A Data Dependent Triangulation for Vector Fields
 A Data Dependent Triangulation for Vector Fields Gerik Scheuermann Hans Hagen Institut for Computer Graphics and CAGD Department of Computer Science University of Kaiserslautern, Postfach 3049, D-67653
ADVANCED FLOW VISUALIZATION
 ADVANCED FLOW VISUALIZATION DISSERTATION Presented in Partial Fulfillment of the Requirements for the Degree Doctor of Philosophy in the Graduate School of The Ohio State University By Liya Li, B.E., M.S.
Topology Tracking for the Visualization of Time-Dependent Two-Dimensional Flows
 Topology Tracking for the Visualization of Time-Dependent Two-Dimensional Flows X. Tricoche, T. Wischgoll, G. Scheuermann, H. Hagen University of Kaiserslautern, P.O. Box 3049, D-67653 Kaiserslautern,
A Texture-Based Hardware-Independent Technique for Time-Varying Volume Flow Visualization
 Journal of Visualization, Vol. 8, No. 3 (2005) 235-244 A Texture-Based Hardware-Independent Technique for Time-Varying Volume Flow Visualization Liu, Zhanping* and Moorhead II, Robert J.* * ERC / GeoResources
Flow Visualization: The State-of-the-Art
 Flow Visualization: The State-of-the-Art The Visual and Interactive Computing Group Computer Science Department Swansea University Swansea, Wales, UK 1 Overview Introduction to Flow Visualization (FlowViz)
Hardware Accelerated Interactive Vector Field Visualization: A level of detail approach
 EUROGRAPHICS 2002 / G. Drettakis and H.-P. Seidel (Guest Editors) Volume 21 (2002), Number 3 Hardware Accelerated Interactive Vector Field Visualization: A level of detail approach Udeepta Bordoloi and
Matching. Compare region of image to region of image. Today, simplest kind of matching. Intensities similar.
 Matching Compare region of image to region of image. We talked about this for stereo. Important for motion. Epipolar constraint unknown. But motion small. Recognition Find object in image. Recognize object.
On a nested refinement of anisotropic tetrahedral grids under Hessian metrics
 On a nested refinement of anisotropic tetrahedral grids under Hessian metrics Shangyou Zhang Abstract Anisotropic grids, having drastically different grid sizes in different directions, are efficient and
Announcements. Edge Detection. An Isotropic Gaussian. Filters are templates. Assignment 2 on tracking due this Friday Midterm: Tuesday, May 3.
 Announcements Edge Detection Introduction to Computer Vision CSE 152 Lecture 9 Assignment 2 on tracking due this Friday Midterm: Tuesday, May 3. Reading from textbook An Isotropic Gaussian The picture
CS 4495 Computer Vision Motion and Optic Flow
 CS 4495 Computer Vision Aaron Bobick School of Interactive Computing Administrivia PS4 is out, due Sunday Oct 27 th. All relevant lectures posted Details about Problem Set: You may *not* use built in Harris
Hardware-Accelerated Visualization of Time-Varying 2D and 3D Vector Fields by Texture Advection via Programmable Per-Pixel Operations
 Hardware-Accelerated Visualization of Time-Varying 2D and 3D Vector Fields by Texture Advection via Programmable Per-Pixel Operations Daniel Weiskopf Matthias Hopf Thomas Ertl University of Stuttgart,
Part I: Theoretical Background and Integration-Based Methods
 Large Vector Field Visualization: Theory and Practice Part I: Theoretical Background and Integration-Based Methods Christoph Garth Overview Foundations Time-Varying Vector Fields Numerical Integration
Vector Field Visualization: Introduction
 Vector Field Visualization: Introduction What is a Vector Field? A simple 2D steady vector field A vector valued function that assigns a vector (with direction and magnitude) to any given point. It typically
Line Integral Convolution Notes
 Line Integral Convolution Notes Ricardo David Castaneda Marin December 2, 2008 DDA Convolution The LIC algorithm takes as an input an image and a vector field defined on the same domain. The output image
Visualizing Vector Fields Using Line Integral Convolution and Dye Advection
 Visualizing Vector Fields Using Line Integral Convolution and Dye Advection Han-Wei Shent Christopher R. Johnsont Kwan-Liu Mat t Department of Computer Science $ ICASE University of Utah NASA Langley Research
Interactive 3D Flow Visualization Based on Textures and Geometric Primitives
 Interactive 3D Flow Visualization Based on Textures and Geometric Primitives Robert S. Laramee and Helwig Hauser www.vrvis.at 1 SUMMARY As the size of CFD simulation data sets expand, the job of the engineer
Optimal (local) Triangulation of Hyperbolic Paraboloids
 Triangulation of Hyperbolic Paraboloids") Optimal (local) Triangulation of Hyperbolic Paraboloids Dror Atariah Günter Rote Freie Universität Berlin December 14 th 2012 Outline Introduction Taylor Expansion Quadratic Surfaces Vertical Distance
Optimal (local) Triangulation of Hyperbolic Paraboloids Dror Atariah Günter Rote Freie Universität Berlin December 14 th 2012 Outline Introduction Taylor Expansion Quadratic Surfaces Vertical Distance
Topology Simplification of Symmetric, Second-Order 2D Tensor Fields
 Topology Simplification of Symmetric, Second-Order 2D Tensor Fields Xavier Tricoche and Gerik Scheuermann Computer Science Department, University of Kaiserlautern, P.O. Box 3049, D-67653 Kaiserslautern,
Using Integral Surfaces to Visualize CFD Data
 Using Integral Surfaces to Visualize CFD Data Tony Mcloughlin, Matthew Edmunds,, Mark W. Jones, Guoning Chen, Eugene Zhang 1 1 Overview Flow Visualization with Integral Surfaces: Introduction to flow visualization
Image features. Image Features
 Image features Image features, such as edges and interest points, provide rich information on the image content. They correspond to local regions in the image and are fundamental in many applications in
Introduction to Scientific Visualization
 Visualization Definition Introduction to Scientific Visualization Stefan Bruckner visualization: to form a mental vision, image, or picture of (something not visible or present to the sight, or of an abstraction);
Topological Construction and Visualization of Higher Order 3D Vector Fields
 EUROGRAPHICS 2004 / M.-P. Cani and M. Slater (Guest Editors) Volume 23 (2004), Number 3 Topological Construction and Visualization of Higher Order 3D Vector Fields T. Weinkauf 1, H. Theisel 2, H.-C. Hege
Flow Field Post Processing via Partial Differential Equations
 Flow Field Post Processing via Partial Differential Equations T. Preusser M. Rumpf A. Telea Abstract The visualization of stationary and time-dependent flow is an important and challenging topic in scientific
Filters. Advanced and Special Topics: Filters. Filters
 Filters Advanced and Special Topics: Filters Dr. Edmund Lam Department of Electrical and Electronic Engineering The University of Hong Kong ELEC4245: Digital Image Processing (Second Semester, 2016 17)
Directional Enhancement in Texture-based Vector Field Visualization
 Directional Enhancement in Texture-based Vector Field Visualization Francesca Taponecco GRIS Dept. Darmstadt University Timothy Urness Mathematics and Computer Science Dept. Drake University Victoria Interrante
Visual Tracking (1) Tracking of Feature Points and Planar Rigid Objects
 Tracking of Feature Points and Planar Rigid Objects") Intelligent Control Systems Visual Tracking (1) Tracking of Feature Points and Planar Rigid Objects Shingo Kagami Graduate School of Information Sciences, Tohoku University swk(at)ic.is.tohoku.ac.jp http://www.ic.is.tohoku.ac.jp/ja/swk/
Intelligent Control Systems Visual Tracking (1) Tracking of Feature Points and Planar Rigid Objects Shingo Kagami Graduate School of Information Sciences, Tohoku University swk(at)ic.is.tohoku.ac.jp http://www.ic.is.tohoku.ac.jp/ja/swk/
Motion Analysis. Motion analysis. Now we will talk about. Differential Motion Analysis. Motion analysis. Difference Pictures
 Now we will talk about Motion Analysis Motion analysis Motion analysis is dealing with three main groups of motionrelated problems: Motion detection Moving object detection and location. Derivation of
Multiscale Image Based Flow Visualization
 Multiscale Image Based Flow Visualization Alexandru Telea a and Robert Strzodka b a Department of Mathematics and Computer Science, Eindhoven University of Technology, Netherlands b Centre of Advanced
ATIP A Tool for 3D Navigation inside a Single Image with Automatic Camera Calibration
 ATIP A Tool for 3D Navigation inside a Single Image with Automatic Camera Calibration Kévin Boulanger, Kadi Bouatouch, Sumanta Pattanaik IRISA, Université de Rennes I, France University of Central Florida,
Edge and local feature detection - 2. Importance of edge detection in computer vision
 Edge and local feature detection Gradient based edge detection Edge detection by function fitting Second derivative edge detectors Edge linking and the construction of the chain graph Edge and local feature
Realtime Water Simulation on GPU. Nuttapong Chentanez NVIDIA Research
 1 Realtime Water Simulation on GPU Nuttapong Chentanez NVIDIA Research 2 3 Overview Approaches to realtime water simulation Hybrid shallow water solver + particles Hybrid 3D tall cell water solver + particles
Using Feature Flow Fields for Topological Comparison of Vector Fields
 Using Feature Flow Fields for Topological Comparison of Vector Fields Holger Theisel Christian Rössl Hans-Peter Seidel Max-Planck-Institut für Informatik, Stuhlsatzenhausweg 85, 66123 Saarbrücken, Germany
Vector Visualization Chap. 6 March 7, 2013 March 26, Jie Zhang Copyright
 ector isualization Chap. 6 March 7, 2013 March 26, 2013 Jie Zhang Copyright CDS 301 Spring, 2013 Outline 6.1. Divergence and orticity 6.2. ector Glyphs 6.3. ector Color Coding 6.4. Displacement Plots (skip)
A Texture-Based Framework for Spacetime-Coherent Visualization of Time-Dependent Vector Fields
 A Texture-Based Framework for Spacetime-Coherent Visualization of Time-Dependent Vector Fields Daniel Weiskopf 1 Gordon Erlebacher 2 Thomas Ertl 1 1 Institute of Visualization and Interactive Systems,
Shape Modeling and Geometry Processing
 252-0538-00L, Spring 2018 Shape Modeling and Geometry Processing Discrete Differential Geometry Differential Geometry Motivation Formalize geometric properties of shapes Roi Poranne # 2 Differential Geometry
Image Based Flow Visualization for Curved Surfaces
 Image Based Flow Visualization for Curved Surfaces Jarke J. van Wijk Technische Universiteit Eindhoven Abstract A new method for the synthesis of dense, vector-field aligned textures on curved surfaces
COMPUTER VISION > OPTICAL FLOW UTRECHT UNIVERSITY RONALD POPPE
 COMPUTER VISION 2017-2018 > OPTICAL FLOW UTRECHT UNIVERSITY RONALD POPPE OUTLINE Optical flow Lucas-Kanade Horn-Schunck Applications of optical flow Optical flow tracking Histograms of oriented flow Assignment
Topology Preserving Thinning of Vector Fields on Triangular Meshes
 Topology Preserving Thinning of Vector Fields on Triangular Meshes Holger Theisel, Christian Rössl, and Hans-Peter Seidel Max-Planck-Institut für Informatik, Saarbrücken, Germany {theisel roessl hpseidel}@mpi-sb.mpg.de
An Introduction to Flow Visualization (1) Christoph Garth
 Christoph Garth") An Introduction to Flow Visualization (1) Christoph Garth cgarth@ucdavis.edu Motivation What will I be talking about? Classical: Physical experiments to understand flow. 2 Motivation What will I be talking
An Introduction to Flow Visualization (1) Christoph Garth cgarth@ucdavis.edu Motivation What will I be talking about? Classical: Physical experiments to understand flow. 2 Motivation What will I be talking
Peripheral drift illusion
 Peripheral drift illusion Does it work on other animals? Computer Vision Motion and Optical Flow Many slides adapted from J. Hays, S. Seitz, R. Szeliski, M. Pollefeys, K. Grauman and others Video A video
Optic Flow and Basics Towards Horn-Schunck 1
 Optic Flow and Basics Towards Horn-Schunck 1 Lecture 7 See Section 4.1 and Beginning of 4.2 in Reinhard Klette: Concise Computer Vision Springer-Verlag, London, 2014 1 See last slide for copyright information.
Robotic Motion Planning: Review C-Space and Start Potential Functions
 Robotic Motion Planning: Review C-Space and Start Potential Functions Robotics Institute 16-735 http://www.cs.cmu.edu/~motionplanning Howie Choset http://www.cs.cmu.edu/~choset What if the robot is not
Dense Image-based Motion Estimation Algorithms & Optical Flow
 Dense mage-based Motion Estimation Algorithms & Optical Flow Video A video is a sequence of frames captured at different times The video data is a function of v time (t) v space (x,y) ntroduction to motion
Lecture 21: Shading. put your trust in my shadow. Judges 9:15
 Lecture 21: Shading put your trust in my shadow. Judges 9:15 1. Polygonal Models Polygonal models are one of the most common representations for geometry in Computer Graphics. Polygonal models are popular
Parallel Detection of Closed Streamlines in Planar Flows
 Parallel Detection of Closed Streamlines in Planar Flows Thomas Wischgoll email: wischgol@informatik.uni-kl.de Gerik Scheuermann email: scheuer@informatik.uni-kl.de Hans Hagen email: hagen@informatik.uni-kl.de
Why Use the GPU? How to Exploit? New Hardware Features. Sparse Matrix Solvers on the GPU: Conjugate Gradients and Multigrid. Semiconductor trends
 Imagine stream processor; Bill Dally, Stanford Connection Machine CM; Thinking Machines Sparse Matrix Solvers on the GPU: Conjugate Gradients and Multigrid Jeffrey Bolz Eitan Grinspun Caltech Ian Farmer
GPUFLIC: Interactive and Accurate Dense Visualization of Unsteady Flows
 Eurographics/ IEEE-VGTC Symposium on Visualization (2006) Thomas Ertl, Ken Joy, and Beatriz Santos (Editors) GPUFLIC: Interactive and Accurate Dense Visualization of Unsteady Flows Guo-Shi Li 1 and Xavier
Techniques for Visualizing Multi-Valued Flow Data
 Joint EUROGRAPHICS - IEEE TCVG Symposium on Visualization (2004) O. Deussen, C. Hansen, D.A. Keim, D. Saupe (Editors) Techniques for Visualizing Multi-Valued Flow Data Timothy Urness 1 Victoria Interrante
Tracking Closed Streamlines in Time-Dependent Planar Flows
 Tracking Closed Streamlines in Time-Dependent Planar Flows Thomas Wischgoll Gerik Scheuermann Hans Hagen University of Kaiserslautern Department of Computer Science, Computer Graphics & CAGD P.O. Box 3049,
Function Based 2D Flow Animation
 VISUAL 2000: MEXICO CITY SEPTEMBER 18-22 100 Function Based 2D Flow Animation Ergun Akleman, Sajan Skaria, Jeff S. Haberl Abstract This paper summarizes a function-based approach to create 2D flow animations.
Representing Curves Part II. Foley & Van Dam, Chapter 11
 Representing Curves Part II Foley & Van Dam, Chapter 11 Representing Curves Polynomial Splines Bezier Curves Cardinal Splines Uniform, non rational B-Splines Drawing Curves Applications of Bezier splines
EE795: Computer Vision and Intelligent Systems
 EE795: Computer Vision and Intelligent Systems Spring 2012 TTh 17:30-18:45 FDH 204 Lecture 14 130307 http://www.ee.unlv.edu/~b1morris/ecg795/ 2 Outline Review Stereo Dense Motion Estimation Translational
Range Imaging Through Triangulation. Range Imaging Through Triangulation. Range Imaging Through Triangulation. Range Imaging Through Triangulation
 Obviously, this is a very slow process and not suitable for dynamic scenes. To speed things up, we can use a laser that projects a vertical line of light onto the scene. This laser rotates around its vertical
05 - Surfaces. Acknowledgements: Olga Sorkine-Hornung. CSCI-GA Geometric Modeling - Daniele Panozzo
 05 - Surfaces Acknowledgements: Olga Sorkine-Hornung Reminder Curves Turning Number Theorem Continuous world Discrete world k: Curvature is scale dependent is scale-independent Discrete Curvature Integrated
Visual Tracking (1) Feature Point Tracking and Block Matching
 Feature Point Tracking and Block Matching") Intelligent Control Systems Visual Tracking (1) Feature Point Tracking and Block Matching Shingo Kagami Graduate School of Information Sciences, Tohoku University swk(at)ic.is.tohoku.ac.jp http://www.ic.is.tohoku.ac.jp/ja/swk/
Intelligent Control Systems Visual Tracking (1) Feature Point Tracking and Block Matching Shingo Kagami Graduate School of Information Sciences, Tohoku University swk(at)ic.is.tohoku.ac.jp http://www.ic.is.tohoku.ac.jp/ja/swk/
smooth coefficients H. Köstler, U. Rüde
 A robust multigrid solver for the optical flow problem with non- smooth coefficients H. Köstler, U. Rüde Overview Optical Flow Problem Data term and various regularizers A Robust Multigrid Solver Galerkin
Level Set Methods and Fast Marching Methods
 Level Set Methods and Fast Marching Methods I.Lyulina Scientific Computing Group May, 2002 Overview Existing Techniques for Tracking Interfaces Basic Ideas of Level Set Method and Fast Marching Method
Artistic Stylization of Images and Video Part III Anisotropy and Filtering Eurographics 2011
 Artistic Stylization of Images and Video Part III Anisotropy and Filtering Eurographics 2011 Hasso-Plattner-Institut, University of Potsdam, Germany Image/Video Abstraction Stylized Augmented Reality for
Biometrics Technology: Image Processing & Pattern Recognition (by Dr. Dickson Tong)
") Biometrics Technology: Image Processing & Pattern Recognition (by Dr. Dickson Tong) References: [1] http://homepages.inf.ed.ac.uk/rbf/hipr2/index.htm [2] http://www.cs.wisc.edu/~dyer/cs540/notes/vision.html
Biometrics Technology: Image Processing & Pattern Recognition (by Dr. Dickson Tong) References: [1] http://homepages.inf.ed.ac.uk/rbf/hipr2/index.htm [2] http://www.cs.wisc.edu/~dyer/cs540/notes/vision.html
Parameterization. Michael S. Floater. November 10, 2011
 Parameterization Michael S. Floater November 10, 2011 Triangular meshes are often used to represent surfaces, at least initially, one reason being that meshes are relatively easy to generate from point
GEOG 4110/5100 Advanced Remote Sensing Lecture 4
 GEOG 4110/5100 Advanced Remote Sensing Lecture 4 Geometric Distortion Relevant Reading: Richards, Sections 2.11-2.17 Geometric Distortion Geometric Distortion: Errors in image geometry, (location, dimensions,
Fundamental Algorithms
 Fundamental Algorithms Fundamental Algorithms 3-1 Overview This chapter introduces some basic techniques for visualizing different types of scientific data sets. We will categorize visualization methods
Distributed Visualization and Analysis of Fluid Dynamics Data
 Distributed Visualization and Analysis of Fluid Dynamics Data Hans-Christian HEGE, Tino WEINKAUF, Steffen PROHASKA, and Andrei HUTANU Zuse Institute Berlin, Scientific Visualization Group, Germany {hege,weinkauf,prohaska,hutanu}@zib.de,
Visualization Computer Graphics I Lecture 20
 15-462 Computer Graphics I Lecture 20 Visualization Height Fields and Contours Scalar Fields Volume Rendering Vector Fields [Angel Ch. 12] November 20, 2003 Doug James Carnegie Mellon University http://www.cs.cmu.edu/~djames/15-462/fall03
Computer Graphics. Lecture 8 Antialiasing, Texture Mapping
 Computer Graphics Lecture 8 Antialiasing, Texture Mapping Today Texture mapping Antialiasing Antialiasing-textures Texture Mapping : Why needed? Adding details using high resolution polygon meshes is costly