Geological mapping using open
|
|
|
- Emory Montgomery
- 6 years ago
- Views:
Transcription


1 Geological mapping using open source QGIS MOHSEN ALSHAGHDARI

 application which is found in Google play store for smart phones, also")
2 Abstract Geological mapping is very important to display your field work in a map for geologist and others, many geologists face problems to make their field output in a geological map. I face that for long till I learn myself online through open QGIS source, and other software. QGIS is easy to understand and my goal here to provide an easy steps to perform geological map with QGIS and some software, which you can use it for improve you map technically. I provide geological lithology symbols and some features you can use it side by side with QGIS, such as CLINO (MIDLAND VALLY) application which is found in Google play store for smart phones, also (TCX CONVERTER) as it will help you to pick many location points in one minute and projected in map which you are going to achieve if you miss it in field. GEOLOGICAL MAPPING A geological map is a graphical presentation of geological observations and interpretations on a horizontal plane.1 A geological section is identical in nature to a map except that data are recorded and interpreted on a vertical rather than a horizontal surface. Maps and sections are essential tools in visualizing spatial, threedimensional, geological relationships. Geologists need a number of items for the field. A hammer (sometimes two) is essential and some chisels. Also essential are a compass, clinometer, pocket steel tape, and a hand lens, plus a map case, notebook, map scales, protractor, pencils and eraser, an acid bottle and a jack-knife. A camera is a must and a small pair of binoculars can be most useful at times, as is a GPS instrument if it can be afforded, To make a geological map you need a topographic base map (in our case we will use Google earth as source of our image and topographic map) on which to plot your geological observations in the field. You can use electronic tools to perform some stuffs relating in geology in field such as CLINO compass for smarts phone for expert geologist see down. You can export it from phone as excel and move which is used for MOVE software and other geological sketch.
3 Introduction QGIS Quantum GIS is an open source software to create, modify and analyze Geographic Information Systems developed by the Open Source Geospatial Foundation (OSGeo). Main feature is the possibility to work on geo-- spatial data and the associated attributes. Based on a modular design, many functions (called plug-- in) can be added to the basic software. Being an open source project, new and better plug-- ins are constantly developed and tested. Website -- Quantum GIS, which is often called QGIS, is an open source GIS desktop application. Comparing to ArcGIS, QGIS can be installed on various operating systems, such as Windows, Mac OS X, Linux (Ubuntu), and Unix, while ArcGIS only has Windows version. More importantly, QGIS is FREE and has many plugins, adding different functions. However, since QGIS mainly relies on community support and voluntary developers, it does not have abundant documents and sometimes is not intuitive to use. Hence, making maps in QGIS needs some explanation. The two major steps, browsing data and making maps, are divided into five parts shown in the following table No. Steps Difficulties 1 Load Geospatial Data Data formats into QGIS 2 Identify the features and attributes to present Layer order, feature selection, and (briefly) frequent-used 3 Define how to show the data projections Transparency (raster and vector), data classification, and layer file 4 Add maps components Geospatial data references 5 Export maps File formats
4 Geological mapping with QGIS After you install your QGIS from Website and it is ready to use just double click on QGIS, this page will appear Loading an existing layer is done through the Layer menu, either by choosing Add Raster Layer or Add Vector Layer depending the dataset you re importing. Here I will use just add raster layer from here look down

.")
5 Then choose from your computer the image you already took it from Google earth for mapping, for example I am planning to perform geological map for my village area(haqel ALFARED, DAMT, NW YEMEN). Go to Google earth and save it from there to your computer.
.")

6 A Raster is a spatial dataset that defines space as an array of equal sized cells arranged into rows and columns (e.g. Satellite imagery or referenced geological maps). When you browsing to choose image which you copy it from Google earth this window will appears, just tick on WGS84 After click on WGS84 your image this will appear


7 Then you have to relocate the image which you import for mapping by geo-references. Take at least four point to get good geo-referenced image. To georeference an image is to define where it sits in a particular space (or this case, a defined datum). Choose the Georeferencer tool from the Raster menu. This dialogues will appears, Add Control Points by making sure that Add Point is highlighted then select a point on the map where the coordinates are known. Input the required easting and northing.

8 Add the same image by click on add raster, when you click anywhere in image box of datum dialogue will open and you just fill the longitude and latitude for this point. Take at least four point, better to georeference from the corners of image. The information of these points you should collected before while your geological trip for study area, or collect it from Google earth. Choose the transformation type: Linear, Resampling Method: Linear. Change the Target SRS to a more modern projection (WGS 84/Zone 54S). Give the file an appropriate title and location.
. Give the file an appropriate title and location. Select Start Georeferencing.")

9 From the Settings menu, choose Transformation Settings. Choose the transformation type: Linear, Resampling Method: Linear. Change the Target SRS to a more modern projection (WGS 84/Zone 54S). Give the file an appropriate title and location. Select Start Georeferencing. When you finish taking points, click on start Georeferences, this will appear as you successfully relocate and project your image. Congratulations, now your image ready for geological mapping and adding features. Just close QGIS now and open it again and use your geo-referenced image. When you leave mouse anywhere will show you the longitude and latitude directly.

10 What to do now to perform geological map: First of all the geological features will add as different type of shape layers, - Faults will be adding as line - Strata will add as polygons - Wells and others will add as point Now I will start to add shape layer as lines for faults by following these steps: Click on Layer create layer- new shape file layer as below. Then you will get this window which has three choices of shape file layer, for fault system you will tick on line as mentioned below, the name will be filled by you as fault or as features you study. Then click ok. Save the line project in specific folder
, right click on it and choose toggle edition as below:")
11 Then you will see your shape file layer on QGIS (layered panel window), right click on it and choose toggle edition as below:

12 Click on toggle editing; now you can draw your lines in faults area as you see above the lines by click on add features button which is located in tool bar as mentioned down by red line. When you finish drawing your lines just click on toggle editing again, save your shape file. Congratulation your faults shape layer file performed. For wells you will choose file shape layer as points and follow instruction as we did in fault system. Notice -From the New shape file Layer window, choose Point. -Choose the correct CRS. - Give the new layer at least one Attribute. -Save the Layer in a reasonable location -Make sure that the Digitizing toolbar is selected. -The correct Layer needs to be highlighted (Points) - From the Digitizing ribbon, select the Toggle Edits cursor. - Select the Add Feature button. - Select a point of interest; give it the Attributes that you previously assigned. - Click Save Edits once you re done. Congratulation you perform wells shape file layer and the output as map below:
13 Repeat same instructions for strata and other features as rocks outcrops, rivers and lakes by choose new shape file layer as polygon. Layers that are created as Polygons are initially added in the same way that polylines and points are. - Polygons are used to define enclosed 2D areas. It is defined by a set of (x,y) co-ordinate pairs. - Create an initial polygon by selecting four points on the map, the program will join these four points with straight lines. - By using the Snapping Options from the Settings menu and choosing the tolerance as around 20 pixels, you can snap to a node from your polygon when you are close to it. - By adding extra nodes to a line, by double clicking on the edge of a polygon with the Node Tool selected. - With the Node tool still selected, each of these individual nodes can be maneuvered to better represent the underlying geology. - By doing this over the entire area you can create a polygon that is representative of this geology

14 Congratulations now your map ready for finalizing technically. - Adding lithology symbols - Add scale bar - Add some articulations - Add north logo direction Adding lithology symbols as the QGIS and most of mapping software lack of lithology mapping I add lithology symbols at me research gate page: Download free at: / freestuff / cartoscript When you download lithology symbols just add it for QGIS as raster as instructions below: Click on features you add to layers panel, for my area is sandstone, right click, then click on properties, as mentioned in next illustration.


15 When you click on properties this box will appear: Click on raster image fill to add lithology symbols from your file which you download from website. Choose the type of lithology symbol and add it to your map.


16 Then your shape file features will change to that symbol you add.

 THEN THIS EMPTY BOX WILL appear, name it as you want, then click ok, new box will display and empty")
17 Print composer The Print Composer is accessed by using the Project Menu. - In the Composition tab, you can edit the size and shape of your background map - It can be used to add scale bar, legends and other visuals to a map for presenting and publishing maps. - Making good maps is often the easiest way to portray geological information, as well as make a convincing argument. For adding north and scale bar etc., you will go to new print composer under project as below illustration or you will do ( CTRL +P) THEN THIS EMPTY BOX WILL appear, name it as you want, then click ok, new box will display and empty In the Print Composer there are several fundamental tools which you need to be able to manipulate to create sensible maps Firstly the Add New Map tool, which allows you to draw a box that will visualize what, is currently displayed in your QGIS window.

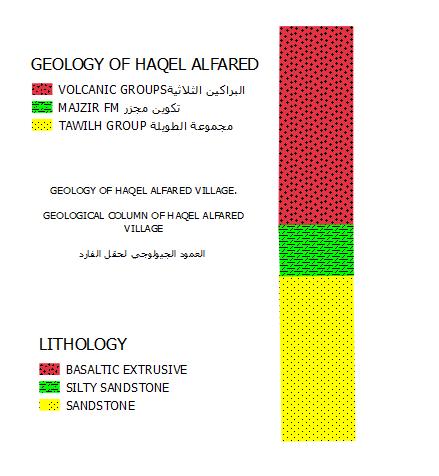
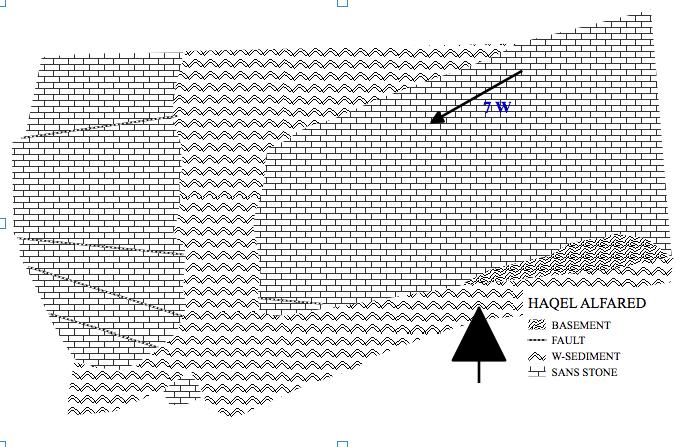
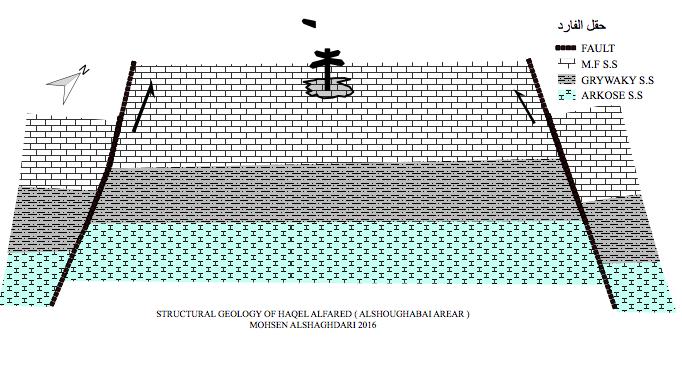
18 From this windows you can add text, image, north logo, any logo related your work, scale bar. And the output will be fantastic and your job is performed. حقل Now you can see all your field work display in geological map as I achieved for my village (HAQEL ALFARED ; DOWN AS YOU SEE (الفارد You can perform separately your features as you can just tick only on what features and print it and add illustration as needed like these maps what I performed for my village (same map). See down - Wells and structural geology - The boundary between salinity water and fresh water - Perform geological column - Contour map

19
20

21 IF YOU MISS TO TAKE THE LONGITUDE AND LATITUDE IN LOCATION. JUST DOWNLOAD TCX CONVERTER. - GO GOOGLE EARTH, - MAKE NEW PATH AND PASS THROUGH ALL AREA EVEN MORE 1000 POINT - SAVE YOUR PATH AS KML - IMPORT YOU FILE TO TCX CONVERTER AND UPDATE ALTITUDE - EXPORT AS LAS, EXCEL FILE.
22 Notes - Geologist should learn how to drive and swim - Always wear hard hat to avoid damage your head - Use proper tools for your job For contact and any question MOHSEN ALSHAGHDARI mhsenhm@gmail.com
QGIS for Geoscientists
 QGIS for Geoscientists Robin Armit, Tom Carmichael, Lachlan Grose Monash Structural Geophysics group 22 nd 26th February 2016 GIS A geographic information system (GIS) is a system designed to capture,
A Practical Guide to Using QGIS
 A Practical Guide to Using QGIS 1.1 INTRODUCTION Quantum GIS (QGIS) is a useful mapping software that enables the compilation and displaying of spatial data in the form of a map. Gaining experience in
Bharath Setturu Research scholar, EWRG, Center for Ecological Sciences, IISc, Bangalore & EWRG-CES IIIT-HYDERABAD
 Bharath Setturu Research scholar, EWRG, Center for Ecological Sciences, IISc, Bangalore settur@ces.iisc.ernet.in & IIIT-HYDERABAD Introduction to QGIS oquantum GIS (QGIS) is a GIS tool for managing geographical
Bharath Setturu Research scholar, EWRG, Center for Ecological Sciences, IISc, Bangalore & IIIT-HYDERABAD
 Bharath Setturu Research scholar, EWRG, Center for Ecological Sciences, IISc, Bangalore settur@ces.iisc.ernet.in & IIIT-HYDERABAD Introduction to QGIS oquantum GIS (QGIS) is a GIS tool for managing geographical
Geographic Information Systems. using QGIS
 Geographic Information Systems using QGIS 1 - INTRODUCTION Generalities A GIS (Geographic Information System) consists of: -Computer hardware -Computer software - Digital Data Generalities GIS softwares
CHAPTER 2 GEOREFERENCING AND SHAPEFILE CREATION
 CHAPTER 2 GEOREFERENCING AND SHAPEFILE CREATION Georeferencing is the process of assigning real-world coordinates to each pixel of the raster. These coordinates are obtained by doing field surveys - collecting
Orchard Link Mapping Workshop (QGIS Training) Contact
 Contact") Orchard Link Mapping Workshop (QGIS Training) Contact email: info@neetmaps.co.uk for technical support, bespoke mapping or further information or visit www.neetmaps.co.uk 1 2 1: Introduction to QGIS What
Orchard Link Mapping Workshop (QGIS Training) Contact email: info@neetmaps.co.uk for technical support, bespoke mapping or further information or visit www.neetmaps.co.uk 1 2 1: Introduction to QGIS What
All data is in Universal Transverse Mercator (UTM) Zone 6 projection, and WGS 84 datum.
 Zone 6 projection, and WGS 84 datum.") 111 Mulford Hall, College of Natural Resources, UC Berkeley (510) 643-4539 EXPLORING MOOREA DATA WITH QUANTUM GIS In this exercise, you will be using an open-source FREE GIS software, called Quantum GIS,
111 Mulford Hall, College of Natural Resources, UC Berkeley (510) 643-4539 EXPLORING MOOREA DATA WITH QUANTUM GIS In this exercise, you will be using an open-source FREE GIS software, called Quantum GIS,
16) After contour layer is chosen, on column height_field, choose Elevation, and on tag_field column, choose <None>. Click OK button.
 After contour layer is chosen, on column height_field, choose Elevation, and on tag_field column, choose <None>. Click OK button.") 16) After contour layer is chosen, on column height_field, choose Elevation, and on tag_field column, choose . Click OK button. 17) The process of TIN making will take some time. Various process
16) After contour layer is chosen, on column height_field, choose Elevation, and on tag_field column, choose . Click OK button. 17) The process of TIN making will take some time. Various process
Launch QGIS. Launch QGIS from. Open window Quantum GIS (Figure 1.1 below) Start All Programs Quantum GIS. QGISIcon on the desk top
 Start All Programs Quantum GIS. QGISIcon on the desk top") QGIS Launch QGIS Launch QGIS from Start All Programs Quantum GIS OR QGISIcon on the desk top Open window Quantum GIS (Figure 1.1 below) 2 Figure 1.1 3 Opening Raster For this exercise we demonstrate three
QGIS Launch QGIS Launch QGIS from Start All Programs Quantum GIS OR QGISIcon on the desk top Open window Quantum GIS (Figure 1.1 below) 2 Figure 1.1 3 Opening Raster For this exercise we demonstrate three
Basic Tasks in ArcGIS 10.3.x
 Basic Tasks in ArcGIS 10.3.x This guide provides instructions for performing a few basic tasks in ArcGIS 10.3.1, such as adding data to a map document, viewing and changing coordinate system information,
ArcGIS for Geoscientists
 School of Geosciences ArcGIS for Geoscientists R. Armit & T. Carmichael GIS A geographic information system (GIS) is a system designed to capture, store, manipulate, analyze, manage, and present all types
Introduction to using QGIS for Archaeology and History Workshop by the Empirical Reasoning Center
 Introduction to using QGIS for Archaeology and History Workshop by the Empirical Reasoning Center In this workshop, we will cover the basics of working with spatial data, as well as its main uses for archaeology.
Quick Guide to MapWindow GIS Desktop Application
 Quick Guide to MapWindow 1 Quick Guide to MapWindow GIS Desktop Application Version 2 January 2007 Adapted by Tom Croft. This is a summary user guide for commonly used tools and capabilities and does not
QGIS Workshop Su Zhang and Laura Gleasner 11/10/2016. QGIS Workshop
 1. Introduction to Quantum GIS (QGIS) QGIS Workshop QGIS is a free and open source Geographic Information System (GIS). QGIS can help you create, edit, visualize, and publish geospatial information on
Introduction to GIS software
 Introduction to GIS software There are a wide variety of GIS software packages available. Some of these software packages are freely available for you to download and could be used in your classroom. ArcGIS
Georeferencing Topo Sheets and Scanned Maps
 Georeferencing Topo Sheets and Scanned Maps QGIS Tutorials and Tips Author Ujaval Gandhi http://www.spatialthoughts.com This work is licensed under a Creative Commons Attribution 4.0 International License.
INTRODUCTION TO GIS WORKSHOP EXERCISE
 111 Mulford Hall, College of Natural Resources, UC Berkeley (510) 643-4539 INTRODUCTION TO GIS WORKSHOP EXERCISE This exercise is a survey of some GIS and spatial analysis tools for ecological and natural
QGIS Workshop Su Zhang and Laura Gleasner 11/15/2018. QGIS Workshop
 1. Introduction to QGIS QGIS Workshop QGIS is a free and open source Geographic Information System (GIS). QGIS can help users create, edit, visualize, analyze, and publish geospatial information on various
The Data Journalist Chapter 7 tutorial Geocoding in ArcGIS Desktop
 The Data Journalist Chapter 7 tutorial Geocoding in ArcGIS Desktop Summary: In many cases, online geocoding services are all you will need to convert addresses and other location data into geographic data.
Making flow direction data
 Step 4. Making flow direction data Training Module 1) The first step in hydrology analysis is making flow direction data. On Arc Toolbox window, click symbol + on Spatial Analyst Tools Hydrology, double
Technical Specifications
 1 Contents INTRODUCTION...3 ABOUT THIS LAB...3 IMPORTANCE OF THIS MODULE...3 EXPORTING AND IMPORTING DATA...4 VIEWING PROJECTION INFORMATION...5...6 Assigning Projection...6 Reprojecting Data...7 CLIPPING/SUBSETTING...7
City of Richmond Interactive Map (RIM) User Guide for the Public
 User Guide for the Public") Interactive Map (RIM) User Guide for the Public Date: March 26, 2013 Version: 1.0 3479477 3479477 Table of Contents Table of Contents Table of Contents... i About this
Interactive Map (RIM) User Guide for the Public Date: March 26, 2013 Version: 1.0 3479477 3479477 Table of Contents Table of Contents Table of Contents... i About this
v SMS Tutorials Working with Rasters Prerequisites Requirements Time Objectives
 v. 12.2 SMS 12.2 Tutorial Objectives Learn how to import a Raster, view elevations at individual points, change display options for multiple views of the data, show the 2D profile plots, and interpolate
RAPIDMAP Geocortex HTML5 Viewer Manual
 RAPIDMAP Geocortex HTML5 Viewer Manual This site was developed using the evolving HTML5 web standard and should work in most modern browsers including IE, Safari, Chrome and Firefox. Even though it was
QUANTUM GIS GUIDE FOR WASH FACILITY DATA COLLECTORS AND -MANAGERS
 COWASH Training Quantum GIS 1 QUANTUM GIS GUIDE FOR WASH FACILITY DATA COLLECTORS AND -MANAGERS Quantum GIS (QGIS) is widely used open source GIS software which usage is very similar to GIS-software market
Spatial data and QGIS
 Spatial data and QGIS Xue Jingbo IT Center 2017.08.07 A GIS consists of: Spatial Data. Computer Hardware. Computer Software. Longitude Latitude Disease Date 26.870436-31.909519 Mumps 13/12/2008 26.868682-31.909259
Building Vector Layers
 Building Vector Layers in QGIS Introduction: Spatially referenced data can be separated into two categories, raster and vector data. This week, we focus on the building of vector features. Vector shapefiles
GY301 Geomorphology Lab 5 Topographic Map: Final GIS Map Construction
 GY301 Geomorphology Lab 5 Topographic Map: Final GIS Map Construction Introduction This document describes how to take the data collected with the total station for the campus topographic map project and
I. An Intro to ArcMap Version 9.3 and 10. 1) Arc Map is basically a build your own Google map
 Arc Map is basically a build your own Google map") I. An Intro to ArcMap Version 9.3 and 10 What is Arc Map? 1) Arc Map is basically a build your own Google map a. Display and manage geo-spatial data (maps, images, points that have a geographic location)
I. An Intro to ArcMap Version 9.3 and 10 What is Arc Map? 1) Arc Map is basically a build your own Google map a. Display and manage geo-spatial data (maps, images, points that have a geographic location)
+ Make it from the satellite images in sale, (Easier & Faster, but not always available) (It does cost much. An astronomical number!
 (It does cost much. An astronomical number!") BaseMap: + Look for it among the existent digital maps, (Easiest & Fastest because no processing required) (Therefore, the most desirable, but not always available) (It can cost much) + Make it from the
BaseMap: + Look for it among the existent digital maps, (Easiest & Fastest because no processing required) (Therefore, the most desirable, but not always available) (It can cost much) + Make it from the
Introduction to QGIS
 Introduction to QGIS David Kramar, Ph.D. Minnesota State University Moorhead Department of Anthropology and Earth Science http://www.qgis.org/en/site/ Overview of Workshop What is QGIS? How do I get QGIS
Fig 1. Geometry of DGPS
 CARRYING DGPS SURVEY AND PREPARATION OF DIGITAL ELEVATION MODEL Tarun Nehra Assistant Professor Department of Civil Engineering, Quantum School of Technology, Roorkee Abstract This work presents a report
Tutorial 1: Finding and Displaying Spatial Data Using ArcGIS
 Tutorial 1: Finding and Displaying Spatial Data Using ArcGIS This tutorial will introduce you to the following: Websites where you may browse to find geospatial information Identifying spatial data, usable
Objectives Learn how to work with projections in GMS, and how to combine data from different coordinate systems into the same GMS project.
 v. 10.2 GMS 10.2 Tutorial Working with map projections in GMS Objectives Learn how to work with projections in GMS, and how to combine data from different coordinate systems into the same GMS project.
Geographical Information Systems Institute. Center for Geographic Analysis, Harvard University. LAB EXERCISE 1: Basic Mapping in ArcMap
 Harvard University Introduction to ArcMap Geographical Information Systems Institute Center for Geographic Analysis, Harvard University LAB EXERCISE 1: Basic Mapping in ArcMap Individual files (lab instructions,
Lesson 2 Installing and Using Quantum GIS (QGIS)
") Lesson 2 Installing and Using Quantum GIS (QGIS) Use file Explorer to open County QGIS portable hard drive provided. The program execute (.exe) will be at the bottom of the list. Double click on the file.
Lesson 2 Installing and Using Quantum GIS (QGIS) Use file Explorer to open County QGIS portable hard drive provided. The program execute (.exe) will be at the bottom of the list. Double click on the file.
Introducing ArcScan for ArcGIS
 Introducing ArcScan for ArcGIS An ESRI White Paper August 2003 ESRI 380 New York St., Redlands, CA 92373-8100, USA TEL 909-793-2853 FAX 909-793-5953 E-MAIL info@esri.com WEB www.esri.com Copyright 2003
button in the lower-left corner of the panel if you have further questions throughout this tutorial.
 Mosaic Tutorial: Simple Workflow This tutorial demonstrates how to use the Seamless Mosaic tool to mosaic six overlapping digital aerial scenes. You will learn about displaying footprints and image data
Digitising a map in arcgis desktop 10.3
 Digitising a map in arcgis desktop 10.3 1 CONTENTS 2 Evaluating your map... 2 3 Setting up the base map... 3 4 Georeferencing your map/maps... 3 4.1 Georeferencing tips.... 4 5 Digitising your maps...
Download the Latest LTR QGIS version (2.18) from the QGIS website: download.qgis.org/ >> Settings > Options > Locale
 from the QGIS website: download.qgis.org/ >> Settings > Options > Locale") Exercise 1: Introduction to QGIS Aim: To understand the basis of GIS To learn the basics of a GIS software (QGIS) INTRODUCTION Software Access Download the Latest LTR QGIS version (2.18) from the QGIS
Exercise 1: Introduction to QGIS Aim: To understand the basis of GIS To learn the basics of a GIS software (QGIS) INTRODUCTION Software Access Download the Latest LTR QGIS version (2.18) from the QGIS
Introduction to QGIS: Instructor s Notes
 2016 Introduction to QGIS: Instructor s Notes Created by: MARK DE BLOIS, CEO / FOUNDER, UPANDE LIMITED WITH SUPPORT FROM THE WORLD BANK AND THE UK DEPARTMENT FOR INTERNATIONAL DEVELOPMENT (DFID) Module
How to calculate population and jobs within ½ mile radius of site
 How to calculate population and jobs within ½ mile radius of site Caltrans Project P359, Trip Generation Rates for Transportation Impact Analyses of Smart Growth Land Use Projects SECTION PAGE Population
Please refer to for specifics and limitations with these operating systems.
 Appendix B ArcReader User Guide For the Southeast Ocean Based Renewable Energy Project INTRODUCTION The purpose of this document is to provide guidance and assistance to users with ArcReader, so that they
Lab#6: Editing Shapefiles With ArcMap. create a point layer from a text file, then join a table to your point attribute table
 NRM338 Fall 2018 Lab#6 Page#1 of 17 In this lab, you will Lab#6: Editing Shapefiles With ArcMap create a point layer from a text file, then join a table to your point attribute table create hyperlinks
GGR 375 QGIS Tutorial
 GGR 375 QGIS Tutorial With text taken from: Sherman, Gary E. Shuffling Quantum GIS into the Open Source GIS Stack. Free and Open Source Software for Geospatial (FOSS4G) Conference. 2007. Available online
GIS.XL. User manual of Excel add-in for spatial data analysis and visualization.
 GIS.XL User manual of Excel add-in for spatial data analysis and visualization http://gisxl.com Content 1 Introduction... 2 2 Requirements... 3 3 Installation... 4 4 Uninstallation... 7 5 Add-in Setup...
OS OpenData masterclass 2013 Cartographic Design workshop
 OS OpenData masterclass 2013 Cartographic Design workshop 1 Quantum GIS Quantum GIS (QGIS) is a user-friendly Open Source Geographic Information System (GIS,) licensed under the GNU General Public License.
Purpose: To explore the raster grid and vector map element concepts in GIS.
 GIS INTRODUCTION TO RASTER GRIDS AND VECTOR MAP ELEMENTS c:wou:nssi:vecrasex.wpd Purpose: To explore the raster grid and vector map element concepts in GIS. PART A. RASTER GRID NETWORKS Task A- Examine
Exercise 5: Import Tabular GPS Data and Digitizing
 Exercise 5: Import Tabular GPS Data and Digitizing You can create NEW GIS data layers by digitizing on screen with an aerial photograph or other image as a back-drop. You can also digitize using imported
HEC-RAS 5.0 Training New Zealand Workshop Guide
 HEC-RAS 5.0 Training New Zealand Workshop Guide Prepared by: Krey Price Surface Water Solutions 57 Bromfield Drive Kelmscott WA 6111 Australia Tel. +61 400 367 542 e-mail: info@surfacewater.biz website:
Main concepts of ILWIS 3.0
 CHAPTER 2 Main concepts of ILWIS 3.0 In chapter one, Introduction to ILWIS, you started with ILWIS, and learned the basics of the user interface. This chapter presents some key concepts of ILWIS. In section
Exercise 03 Creating and Editing Shapefiles Assigned Feb. 2, 2018 Due Feb. 9, 2018
 Exercise 03 Creating and Editing Shapefiles Assigned Feb. 2, 2018 Due Feb. 9, 2018 On the class website I've posted an exercise_03_data.zip file which contains a USGS 7.5' quad map of Laramie (as laramie_quad_usgs_1963.tiff)
ArcGIS Extension User's Guide
 ArcGIS Extension 2010 - User's Guide Table of Contents OpenSpirit ArcGIS Extension 2010... 1 Installation ( ArcGIS 9.3 or 9.3.1)... 3 Prerequisites... 3 Installation Steps... 3 Installation ( ArcGIS 10)...
From data source to data view: A practical guide to uploading spatial data sets into MapX
 From data source to data view: A practical guide to uploading spatial data sets into MapX Thomas Piller UNEP/GRID Geneva I Table of contents 1. Adding a new data source to MapX... 1 1.1 Method 1: upload
Objectives Learn how to work with projections in SMS, and how to combine data from different coordinate systems into the same SMS project.
 v. 12.2 SMS 12.2 Tutorial Working with map projections in SMS Objectives Learn how to work with projections in SMS, and how to combine data from different coordinate systems into the same SMS project.
QGIS LAB SERIES GST 101: Introduction to Geospatial Technology Lab 5: Creating Geospatial Data
 QGIS LAB SERIES GST 101: Introduction to Geospatial Technology Lab 5: Creating Geospatial Data Objective Digitize Information from a Scanned Hardcopy Source Document Version: 2014-06-03 (Final) Author:
This user guide covers select features of the desktop site. These include:
 User Guide myobservatory Topics Covered: Desktop Site, Select Features Date: January 27, 2014 Overview This user guide covers select features of the desktop site. These include: 1. Data Uploads... 2 1.1
US Geo-Explorer User s Guide. Web:
 US Geo-Explorer User s Guide Web: http://usgeoexplorer.org Updated on October 26, 2016 TABLE OF CONTENTS Introduction... 3 1. System Interface... 5 2. Administrative Unit... 7 2.1 Region Selection... 7
Heads-up Digitizing from Scanned Hard-Copy Maps Part I Georeferencing Scanned Images 1
 Data conversion/entry (GIS, databases) November 21-25, 2006 Freetown, Sierra Leone Heads-up Digitizing from Scanned Hard-Copy Maps Part I Georeferencing Scanned Images 1 Objectives: Explore digital archives
Objectives Learn how to work with projections in SMS, and how to combine data from different coordinate systems into the same SMS project.
 v. 12.3 SMS 12.3 Tutorial Working with map projections in SMS Objectives Learn how to work with projections in SMS, and how to combine data from different coordinate systems into the same SMS project.
Getting Started with the NH Stone Wall Mapper January 2019
 Getting Started with the NH Stone Wall Mapper January 2019 Stone walls are significant cultural and historical features of the New England landscape. Creating a statewide inventory of existing stone walls
Georeferencing Imagery in ArcGIS 10.3.x
 Georeferencing Imagery in ArcGIS 10.3.x Georeferencing is the process of aligning imagery (maps, air photos, etc.) with spatial data such as point, lines or polygons (for example, roads and water bodies).
City of La Crosse Online Mapping Website Help Document
 City of La Crosse Online Mapping Website Help Document This document was created to assist in using the new City of La Crosse online mapping sites. When the website is first opened, a map showing the City
Introduction to Solo Forest
 Introduction to Solo Forest Project Settings Collecting Data Office Procedures - Exporting Shapefiles - Syncing with the PC - Transferring files Opening Solo Forest To open Solo Forest, select Start >
SURFACE WATER MODELING SYSTEM. This tutorial requires that you have Google Earth installed on your computer.
 SURFACE WATER MODELING SYSTEM Google Earth Files This lesson is designed to help you understand how to save SMS data to a *.kmz file format. Files of this type are Google Earth files and will allow you
Exercises Open Source Software for Preprocessing GIS Data for Hydrological Models
 Exercises Open Source Software for Preprocessing GIS Data for Hydrological Models Dr. Hans van der Kwast Senior Lecturer in Ecohydrological Modelling Water Science and Engineering Department E-mail: j.vanderkwast@unesco-ihe.org
GIS Workshop Spring 2016
 1/ 14 GIS Geographic Information System. An integrated collection of computer software and data used to view and manage information about geographic places, analyze spatial relationships, and model spatial
Converting AutoCAD Map 2002 Projects to ArcGIS
 Introduction This document outlines the procedures necessary for converting an AutoCAD Map drawing containing topologies to ArcGIS version 9.x and higher. This includes the export of polygon and network
Importing GPS points and Hyperlinking images.
 Geol 3050 GIS for Geologists Exercise 15 Exercise 15 Making a Virtual Fieldtrip: Importing GPS points and Hyperlinking images. Due: Thursday, March 22. Goal: A) Get familiar with importing GPS points and
Segmentation Guide using open source resources By Paul Russell, Ana Carolina Fiorini, and Trevor Caughlin
 Segmentation Guide using open source resources By Paul Russell, Ana Carolina Fiorini, and Trevor Caughlin This guide aims to give you a step by step guidance to digitize tree cover in google earth using
Estuary Data Viewer User Guide
 1. Introduction 2. Page Layout 3. Navigation Tools 4. Table of Contents Tabs 5. Action Tools 6. System Requirements Estuary Data Viewer User Guide 1. Introduction Welcome to the Estuary Planner Data Viewer.
GIS IN ECOLOGY: CREATING RESEARCH MAPS
 GIS IN ECOLOGY: CREATING RESEARCH MAPS Contents Introduction... 2 Elements of Cartography... 2 Course Data Sources... 3 Tasks... 3 Establishing the Map Document... 3 Laying Out the Map... 5 Exporting Your
Heads-up Digitizing from Scanned Hard-Copy Maps Part II - Vector Point, Segment and Polygon Editing 1
 Data conversion/entry (GIS, databases) February 18-25, 2007 Freetown, Sierra Leone Heads-up Digitizing from Scanned Hard-Copy Maps Part II - Vector Point, Segment and Polygon Editing 1 Objectives: Create
Welcome to the Surface Water Data Viewer!
 1 Welcome to the Surface Water Data Viewer! The Surface Water Data Viewer is a mapping tool for the State of Wisconsin. It provides interactive web mapping tools for a variety of datasets, including chemistry,
Class #2. Data Models: maps as models of reality, geographical and attribute measurement & vector and raster (and other) data structures
 data structures") Class #2 Data Models: maps as models of reality, geographical and attribute measurement & vector and raster (and other) data structures Role of a Data Model Levels of Data Model Abstraction GIS as Digital
Class #2 Data Models: maps as models of reality, geographical and attribute measurement & vector and raster (and other) data structures Role of a Data Model Levels of Data Model Abstraction GIS as Digital
FOR 240 Lab 8 Assignment Using GPS to Collect Spatial Data of Forest Management Introduction to Computing in Natural Resources
 FOR 240 Lab 8 Assignment Using GPS to Collect Spatial Data of Forest Management Introduction to Computing in Natural Resources In this lab, we are going to use the GPS to collect timber cruising data.
Lab 3: Digitizing in ArcGIS Pro
 Lab 3: Digitizing in ArcGIS Pro What You ll Learn: In this Lab you ll be introduced to basic digitizing techniques using ArcGIS Pro. You should read Chapter 4 in the GIS Fundamentals textbook before starting
QGIS Level 2 Stuart Ladd
 QGIS Level 2 Stuart Ladd Introduction This guide will take you through some more advanced, field work-related tasks that can be done with QGIS. It assumes you have successfully been through the Level 1
MapInfo ProViewer 11.0 USER GUIDE
 MapInfo ProViewer 11.0 USER GUIDE Information in this document is subject to change without notice and does not represent a commitment on the part of the vendor or its representatives. No part of this
Exercise 4: Import Tabular GPS Data and Digitizing
 Exercise 4: Import Tabular GPS Data and Digitizing You can create NEW GIS data layers by digitizing on screen with an aerial photograph or other image as a back-drop. You can also digitize using imported
Low Cost and Free Public Health Mapping Tools
 Low Cost and Free Public Health Mapping Tools Quantum GIS - QGIS 1) Download and Install a) QGIS can be quickly and easily installed on Windows, Macs and Linux from installers found here: http://hub.qgis.org/projects/quantum-gis/wiki/download
Exercise 1-1: Using GPS track data to create a field boundary
 Exercise 1-1: Using GPS track data to create a field boundary Learning objectives: Add QGIS plugins Create a point vector file from a text file Convert GPS tracking points to a field boundary Data folder:
Dataset2: Fleurac. Contents. Using a dataset containing geo-tags Getting familiar with spatial reference systems Advanced features
 Dataset2: Fleurac Using a dataset containing geo-tags Getting familiar with spatial reference systems Advanced features Contents 1. Creating a new project... 2 2. Importing your data... 3 3. Checking the
An Introduction to Geographic Information Systems (GIS) using ArcGIS 9.2
 using ArcGIS 9.2") An Introduction to Geographic Information Systems (GIS) using ArcGIS 9.2 by Marcel Fortin, GIS and Map Librarian, University of Toronto Libraries, 2009 gis.maps@utoronto.ca http://www.library.utoronto.ca/maplib/
An Introduction to Geographic Information Systems (GIS) using ArcGIS 9.2 by Marcel Fortin, GIS and Map Librarian, University of Toronto Libraries, 2009 gis.maps@utoronto.ca http://www.library.utoronto.ca/maplib/
OziExplorer Training and Help Manual for Use with Soil Resource Stewardship Monitoring Checklist: Cutblock-Level
 for Use with Soil Resource Stewardship Monitoring Checklist: Cutblock-Level Stéphane Dubé, Soil Scientist MOFR Northern Interior Forest Region May 2009 Version 2 Starting up This section will describe
GEO/GY461 Applied GIS: Environmental Geology of the Cheaha Mountain, AL, 7.5' Quadrangle Project
 Figure 1: Reference points spreadsheet for Cheaha Mt. 7.5' quadrangle (LatLongCalc_24k.xls). Page -1- Figure 2: RMS statistic from the Cheaha Mountain field map georeference. Page -2- Figure 3: Appearance
Geology & Geophysics REU GPS/GIS 1-day workshop handout #3: Working with data in ArcGIS
 Geology & Geophysics REU GPS/GIS 1-day workshop handout #3: Working with data in ArcGIS In this lab you ll start to use some basic ArcGIS routines to display your data. These include overlaying data on
v Working with Rasters SMS 12.1 Tutorial Requirements Raster Module Map Module Mesh Module Time minutes Prerequisites Overview Tutorial
 v. 12.1 SMS 12.1 Tutorial Objectives This tutorial teaches how to import a Raster, view elevations at individual points, change display options for multiple views of the data, show the 2D profile plots,
Modern Tools for NTDs Control Programmes
 Modern Tools for NTDs Control Programmes www.thiswormyworld.org Practical 1 Becoming familiar with QGIS interface and GIS features www.thiswormyworld.org 2 Aim of practical This first practical aims to
Lab 18c: Spatial Analysis III: Clip a raster file using a Polygon Shapefile
 Environmental GIS Prepared by Dr. Zhi Wang, CSUF EES Department Lab 18c: Spatial Analysis III: Clip a raster file using a Polygon Shapefile These instructions enable you to clip a raster layer in ArcMap
Calculate a Distance Matrix of Locations along River Network
 Calculate a Distance Matrix of Locations along River Network These instructions enable you to measure the length of line segments between points, which is much more useful than simple straight-line distances
Georeferencing in ArcGIS Pro. Overview of the Esri Georeferencing tools. Exercise
 Georeferencing in ArcGIS Pro Historic maps contain a wealth of information that can be used in research. You can use the scanned historic map as a background to your own data or you can digitize the information
Introduction to QGIS: Student Workbook
 2016 Introduction to QGIS: Student Workbook Created by: MARK DE BLOIS, CEO / FOUNDER, UPANDE LIMITED WITH SUPPORT FROM THE WORLD BANK AND THE UK DEPARTMENT FOR INTERNATIONAL DEVELOPMENT (DFID) Module 3:
1. Below is an example 1D river reach model built in HEC-RAS and displayed in the HEC-RAS user interface:
 How Do I Import HEC-RAS Cross-Section Data? Flood Modeller allows you to read in cross sections defined in HEC-RAS models, automatically converting them to Flood Modeller 1D cross sections. The procedure
Editing with ArcGIS. Contents
 Editing with ArcGIS This tutorial is designed to introduce you to the basic editing tools used in ArcMap for the both the creation and modification of geospatial data. Editing is an essential skill for
v Importing Rasters SMS 11.2 Tutorial Requirements Raster Module Map Module Mesh Module Time minutes Prerequisites Overview Tutorial
 v. 11.2 SMS 11.2 Tutorial Objectives This tutorial teaches how to import a Raster, view elevations at individual points, change display options for multiple views of the data, show the 2D profile plots,
Downloading and importing DEM data from ASTER or SRTM (~30m resolution) into ArcMap
 into ArcMap") Downloading and importing DEM data from ASTER or SRTM (~30m resolution) into ArcMap Step 1: ASTER or SRTM? There has been some concerns about the quality of ASTER data, nicely exemplified in the following
Downloading and importing DEM data from ASTER or SRTM (~30m resolution) into ArcMap Step 1: ASTER or SRTM? There has been some concerns about the quality of ASTER data, nicely exemplified in the following
Software Tutorial for the Installation of Quantum GIS 1.8
 Software Tutorial for the Installation of Quantum GIS 1.8 JOU1526 - COMPUTER-ASSISTED REPORTING Algonquin College Fall Semester 2013 Professor : David McKie GIS Assistant: Matt Pulleyblank 1 Installation
v Online Data Dynamic Images SMS Tutorials Prerequisites Requirements Time Objectives
 v. 13.0 SMS 13.0 Tutorial Dynamic Images Objectives This tutorial instructs on the basic skills concerning how to use the dynamic image option offered by SMS. This option connects SMS through an internet