Perception-Based Transfer Function Design
|
|
|
- Percival Fowler
- 6 years ago
- Views:
Transcription

1 Perception-Based Transfer Function Design Huamin Qu Department of Computer Science and Engineering The Hong Kong University of Science and Technology Outline Introduction Transfer Function Design Based on Editing Direct Volume Rendering Images Quality Enhancement of Direct Volume Rendered Images Quantitative Effectiveness Metrics for Direct Volume Rendering 1


2 Outline Introduction Transfer Function Design Based on Editing Direct Volume Rendering Images Quality Enhancement of Direct Volume Rendered Images Quantitative Effectiveness Metrics for Direct Volume Rendering Direct Volume Rendering Direct Volume Rendering (DVR) is a powerful and flexible volume visualization tool and has been widely used in many fields Volume DVR by shading and compositing Direct Volume Rendered Image (DVRI) 2
3 Object-Based Methods V.S. Image-Based Methods Direct Volume Rendering (DVR): Object-order DVR (forward mapping) Image-order DVR (backward mapping) Transfer Functions (1/2) Transfer functions (TFs) assign opacity and color to the different features in the volume data Emphasize the region of focus Subjugate the unimportant details Data Value Transfer Function Color and Opacity 3
![α Transfer Function(2/2) RGB [Kindlmann 2002] f RGB(f) a(f) CT Human Tooth Shading, Compositing Perception-Guided Transfer Function Specification The effectiveness of DVR largely depends on](/docs-images/75/72106228/images/4-0.jpg "the TF used Appropriate TFs allow users to reveal important features in the data Inappropriate ones may obscure these features Finding appropriate TFs is difficult in practice One major")

4 α Transfer Function(2/2) RGB [Kindlmann 2002] f RGB(f) a(f) CT Human Tooth Shading, Compositing Perception-Guided Transfer Function Specification The effectiveness of DVR largely depends on the TF used Appropriate TFs allow users to reveal important features in the data Inappropriate ones may obscure these features Finding appropriate TFs is difficult in practice One major reason is that the search space for finding TFs is huge even for one dimensional TFs, not to mention multi-dimensional TFs We propose a perception-guided volume exploration framework Transfer function design framework based on editing DVRIs and its frontend intuitive interfaces Quality enhancement for the edited DVRIs Quantitative effectiveness evaluation for direct volume rendering 4
5 Outline Introduction Transfer Function Design Based on Editing Direct Volume Rendering Images Quality Enhancement of Direct Volume Rendered Images Quantitative Effectiveness Metrics for Direct Volume Rendering Motivation Physicians usually prefer to directly work on 2D slice images rather than in the TF domain It is more straightforward for them to identify features in 2D slice images Some 3D structures can be more easily identified in direct volume rendered images (DVRIs) than in 2D gray-scale slice images Therefore, it is more intuitive and convenient for users to directly work on DVRIs Usually, a number of partially good DVRIs can be easily generated by previous volume visualization methods, however, these DVRIs may only partially satisfy users demands Some context in one image may need to be removed Some features in different image may need to be combined 5

 Traditional")
6 Two Straight Solutions Some DVRI editing operations, such as fusing features from different DVRIs, blending two DVRIs, and erasing unwanted features in DVRIs, may be very useful in practice There are two straightforward solutions for fusing: Traditional 2D image editing operations Linear combination of several TFs They both fail to achieve goals in most cases Traditional 2D image editing operations DVRIs are different from traditional 2D images DVRIs are used to reveal information contained in 3D volume data so multi-layer transparent surfaces are usually displayed Traditional images usually show objects in a real world setting, thus opaque surfaces are often presented Alpha Blending is not suitable for DVRIs Lose depth cues and introduce misleading information (a) Traditional Image created by blending two images (b) DVRI 6
 DVRI rendered with a linearly combined TF: TF3 =α*tf1+ ß *TF2, where a = 0.")
7 Linear Combination of TFs Linear Combination of TFs Nonlinear operations of the integration used in DVR makes it inappropriate for the general fusing problems (a) (b) (c) (d) (a)-(b) Source images 1 and 2, and their TFs: TF1 and TF2; (c) DVRI rendered with a linearly combined TF: TF3 =α*tf1+ ß *TF2, where a = 0.3 and ß = 1; (d) DVRI rendered with our method by fusing (a) and (b) A Robust DVRI Editing Framework We introduce a general and robust editing framework to solve the general DVRI editing problem Allows users to directly manipulates features in DVRIs Integrates user knowledge into the optimization process The uses of the framework are two-fold: As an image editing tool For users without expertise in TF, our system is a Photoshop-style editing tool for DVRIs while TFs are only used internally and will not be exposed to users. As an interactive TF design method For expert users, our system can show the generated TF, which can be further edited or manually fine-tuned by users. The system allows users to interactively and intuitively design TFs from simple to complex by gradually editing simple DVRIs into comprehensive ones 7
 System")


8 System Overview (a) (b) (a) User interface which consists of source DVRIs and their TFs, target DVRI and its TF, and a history region; (b) System architecture which consists of energy function generator, transfer function producer, direct volume renderer, and image similarity evaluator Feature Selection Our approach allows users to select desired features in DVRIs to edit using rectangles or semi-automatic feature selection tools Rectangles Lazy Snapping 8
9 Editing Operations Fusing Operation Combines multiple user selected features which appear in different DVRIs into a comprehensive one Blending Operation Composites two DVRIs and generate a similar resulting image from alpha blending. Deleting Operation Removes extra features from a DVRI Energy Function Generator 9
 module The values are used to determine which genomes in the")
 (b) (c) (d) (e) (f) (g) The fusing operation: (a)-(d) Source")
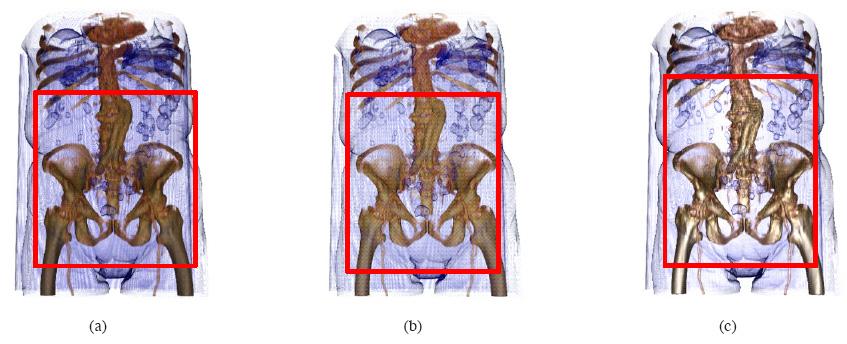
10 Energy Function An energy function for evaluating the fitness of candidate solutions should be formed after users specify editing operations in DVRIs The energy function is based on image similarity and editing operations to objectively evaluate the fitness of intermediate TFs It returns the measurement to the Genetic Algorithm (GA) module The values are used to determine which genomes in the current population are more likely to be selected to survive Fusing Operation The energy function: n : number of source images to be fused V k : the vote (or user expected similarity value) given by users for the features in source image k S k : the computed image similarity value between the candidate image and source image k (a) (b) (c) (d) (e) (f) (g) The fusing operation: (a)-(d) Source DVRIs; (e) Target DVRI generated with V1 = 0.7, V2 = 0.3, V3 = 0.4, and V4 = 0.6; (f) Target DVRI generated with V1 = 0.5, V2 = 0.5, V3 = 0.5, and V4 = 0.6; (g) Target DVRI generated with V1 = 0.3, V2 = 0.7, V3 = 0.6, and V4 =
 (b) (c) The blending operation: (a)-(b) Source images with bone and skin respectively; (c) Target image generated by blending (a) and (b) using our system Deleting Operation The energy")
 (b) (c) The deleting operation: (a) A DVRI where the skin is to be removed; (b) Mask created from (a) using lazy snapping; (c) Resulting DVRI after executing the deleting")
11 Blending Operation The energy function: α 1 andα 2 : the alpha values used for blending S 1 and S 2 : the computed image similarity value between the candidate image and the source images to be blended (a) (b) (c) The blending operation: (a)-(b) Source images with bone and skin respectively; (c) Target image generated by blending (a) and (b) using our system Deleting Operation The energy function: S 1 is the computed image similarity value between the candidate image and the source image within region A where a selected feature is to be removed, and S 2 is defined the same as S 1 but outside A (a) (b) (c) The deleting operation: (a) A DVRI where the skin is to be removed; (b) Mask created from (a) using lazy snapping; (c) Resulting DVRI after executing the deleting operation 11

12 Mix Multiple Editing Operations Our system enables users to mix different basic operations together Users can fuse multiple features in distinct DVRIs together and can meanwhile remove certain features from some DVRIs The energy function: Editing Features from Different Viewpoints Given n viewpoints and their corresponding DVRIs Select a common good viewpoint Re-render the user selected features from this viewpoint Apply the basic DVRI editing operations to these new DVRIs (a) (b) (c) The editing operation on DVRIs generated from different viewpoints: (a)-(b) Source images generated from different viewpoints; (c) Resulting image generated by blending the (a) and (b) 12
13 Transfer Function Producer Genetic Algorithm A Genetic Algorithm (GA) is a search algorithm imitating the process of natural evolution It is particularly useful for searching solutions to optimization problems, especially when the search space is huge and unknown 13
14 Solution Encoder/Decoder The solution encoder/decoder specifies the genome representation by analyzing the source TFs 1D array of floating numbers The process: Smoothens the source TFs Samples TFs adaptively above the Nyquist frequency Genome Representation The samples are then used to specify the genome representation They can be used to restrict the search space to improve the GA performance The yellow points below are the genome representation Opacity TF 1 TF 2 TF 1 TF 2 Scalar Value 14
15 Image Similarity Evaluator Image Similarity Metric A contour-based similarity metric is developed to compare two DVRIs The preprocessing: Converts DVRIs into grey-scale images Detects the edge images from the grey-scale images with Canny edge detector Smoothes the edge images with a Gaussian filter 15
16 How to Compute Image Similarity The image similarity value S k is: N source : the number of all pixels on the edges of the source k s edge image K and K :are the Gaussian filtered target and source edge images with resolution (width, height) Supplement to Image Similarity Notice that we consider only the pixels on the source edge image k for S k S k is only computed if K (x,y)!=0 If there are user-selected features in the DVRIs which are to be compared, our system considers only the pixels within these features N source becomes the number of pixels within the features on the edges of the source edge image 16
, (b), and (c) into a comprehensive one (d) with V 1 =0.3, V 2 =0.4, and V 3 =0.")
 and (b) (c) Obtained by traditional alpha-bending (d) Created by our approach (better details)")
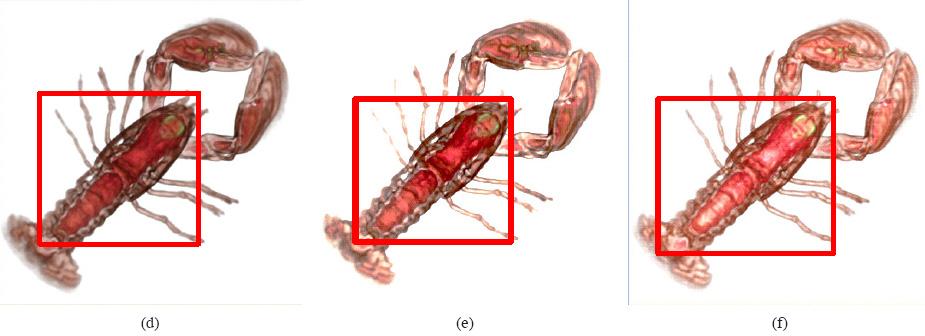
17 Results for The Basic Editing Operations (Fusing) Create a new DVRI (d) by fusing the features in multiple DVRIs (a), (b), and (c) into a comprehensive one (d) with V 1 =0.3, V 2 =0.4, and V 3 =0.3 (a) (b) (c) (d) Results for The Basic Editing Operations (Blending) Generate a new DVRI (c) by blending DVRIs (a) and (b) (c) Obtained by traditional alpha-bending (d) Created by our approach (better details) (a) (b) (c) (c) 17
 indicated by blue strokes while retaining the feature selected")

18 Results for The Basic Editing Operations (Deleting) Generate a new DVRI (b) by deleting feature (a) indicated by blue strokes while retaining the feature selected by yellow strokes (a) (b) Examples for TF Design (1/2) Creating a DVRI of better quality (i.e., clearer contours) by fusing the selected features in (a) and (b) (a) (b) (c) 18


19 Examples for Generating Animations Generating intermediate frames for animations (a) keyframe1 (b) keyframe2 Intermediate frames created by the blending operation Palette-Style Interface and Radial Graph Interface A palette style intuitive interface is further developed to server as the front-end of the editing framework A radial graph interface arranges the resulting images based on viewpoints and image quality for detailed exploration Palette-Style Volume Exploration Interface Radial Graph 19

20 Palette-Style Interface A palette-style interface motivated by the color palette is proposed for intuitive DVRI generation to increase exploration intuitiveness, reduce exploration redundancy, and save and share exploration results Moses Harris: the first color wheel to classify red, blue and yellow as the three primary colors Palette-Style Volume Exploration Interface Visualization Process with The Interface 1. Primary opacity TFs and DVRIs (analogy of the primary color in the color palette) are created automatically or semi-automatically 2. More DVRIs of different opacity TFs can be created by fusing the primary DVRIs in the DVRI wheel 3. The system enables users to further explore the data using the created opacity TF with different parameters in a separate radial graph 20


21 Primary DVRI Generation Primary DVRIs (analogy of primary colors in the color palettes) can be created by experts manually or semi-automatically which makes boundaries of structures in volumetric data visible For non-expert users, other high-level methods can be adopted for primary DVRI generation without the knowledge of TFs Kindlmann and Durkin 1998 Salama et al Editing Operations on The DVRI Wheel After creating primary DVRIs, our system allows users to generate more DVRIs from the primary ones intuitively Users just need to select a point on the DVRI wheel and indicate how to fuse the DVRIs using the DVRI editing framework 21

22 Animation Generation Animation can be used to reveal 3D relationships between the different structures more effectively than a still image Users can create an animation for volume visualization using the DVRI wheel intuitively based on the fusing operation Animation operation Support for Multiple Viewpoints Primary DVRIs can be generated from different viewpoints However, image similarity can be computed only for DVRIs rendered from the same viewpoint 22
23 Radial Graph for Detailed Exploration Users may need to further explore the volume using the opacity TF with different lighting parameters, color TFs, and viewpoints A new radial graph style interface was proposed to arrange the resulting images based on viewpoints and image quality Graph Layout The graph layout consists of multiple concentric circles, and the radii for these concentric circles are r 1 r n from inside to outside and defined as where i >=3 and r 2 = 2r 1, and r 1 =C, and C is determined by users A radial graph for detailed volume exploration with the same opacity TF The graph is further divided into multiple sectors for storing the DVRIs created from different viewpoints 23
24 Image Quality Evaluation In each sector, the DVRIs are sorted in terms of image quality so that better DVRIs have larger sizes and are closer to the center The features and details in an image with a higher contrast are always better perceived by viewers Contrast can be interpreted as the standard deviation of the pixel values in the image: where Ω is the image and v(i) is the intensity of pixel i, and μ is the mean value of all pixels in the image Volume Exploration (1) Intuitive Volume Exploration 24
25 Volume Exploration (2) A palette-style DVRI wheel for creating animation An animation was generated along the user selected path P1 P2 P3 Image Quality Evaluation A radial graph for detailed volume exploration The radial graph was divided into multiple sectors for different viewpoints, and the DVRIs in each sector were sorted according to the image quality such that DVRIs with higher image quality lie closer to the center 25
26 Outline Introduction Transfer Function Design Based on Editing Direct Volume Rendering Images Quality Enhancement of Direct Volume Rendered Images Quantitative Effectiveness Metrics for Direct Volume Rendering Introduction (1/3) Direct volume rendering for scientific visualization Revealing different structures by specifying proper transfer functions Allowing visual analysis on the volumetric data Quality of the DVRIs is an important issue Ensuring features are clearly shown (enhanced features) Preserving the information in the volume Delivering a pleasing result (better contrast) 26
27 Introduction (2/3) Quality enhancement in image domain Commonly used image processing approaches, e.g., contrast and feature enhancement Formation of a new image with certain mapping of pixel values Objective: easy interpretation of image information Drawbacks: information may be missing in the image and cannot be restored Introduction (3/3) Our approach: working in transfer function and volume domains Image measurement: evaluating the effectiveness of the image in conveying the volume information Parameter refinement: adjusting the rendering parameters for better image quality Restoring the missing information due to poor lighting and rendering settings Revealing the information in the volume by analyzing the composition of the rays in the rendering process 27
28 Limitations of Image-Based Approaches Limitations of image-based approaches Cannot recover the missing details due to poor lighting Cannot enhance the structure with respect to the topology and shape in the volumetric data Our method: Taking the volume into consideration to preserve the details Typical Problems in DVRIs (1/2) Structures are not clearly shown due to poor lighting and rendering parameter settings Pixels in the DVRIs cannot give any implication on the existence of structure Homogenous regions in DVRI may represent some fine features They should demonstrate certain variations in the image to convey the information of the structures 28
 is the result generated by adjusting the rendering parameters.")
29 Typical Problems in DVRIs (2/2) An example using the CT engine dataset: (a) shows the original image with a poor contrast; (b) and (c) are the images enhanced by Photoshop and manual adjustment using various image filters; (d) is the result generated by adjusting the rendering parameters. Idea: with the help of the volumetric data and the knowledge of the rendering process of DVRIs, we can Further improve the image quality accordingly Reinforce the hidden details about the volume in the image Image Quality Measurement The quality of DVRIs is defined as the effectiveness of the rendered images in presenting the information in the volumetric data Determine whether the image can show a significant variation in regions where the rays carry different information To quantitatively analyze a DVRI, we establish several measurements for both image and volume data information 29
30 Image Measure Variations / information in an image are interpreted as contrast Homogeneity measurement [Cheng et al. 03 ] Image standard deviation σ as Image entropy h as Estimate the visual information in the image Final image measure: Ray Measure Each sample point contributes to the final image in different degrees and their contribution can be estimated by We estimate the information carried by the rays and their variations by considering those visible sample points along the rays Ray measure can be represented as Entropy term on the composition of the rays Signifying the information variation among rays 30
31 Composite Measure Compositing measure on the quality of an image Indicating the deviation between the image and ray information at each pixel in the image Minimizing the overall information deviation - preserving the information of the volume in the image domain. Parameter Refinement Adjusting different rendering parameters for better results Manual adjustment Tedious and non-trivial task Optimization of the parameters using a genetic algorithm Image quality measure as the fitness measure Parameters involved: Reflection / illumination model» Ambient, diffuse and specular coefficients Transfer function» HSV (brightness and saturation)» YIQ (luma information)» Only safe channels are modified to preserve the original color 31
32 Genetic Algorithm Combinatorial optimization of parameters Efficient search of an optimal solution in the parameter space through the evolution process Process driven by the image quality measure to obtain a better result Advantages: stochastic search - avoiding local optima efficient Adaptive Enhancement and User Interaction Adaptive enhancement Preserve the under-enhanced details missing in the global configuration Enhance and refine on certain parts of the DVRI User interaction Highlight regions in the image Select Structure in volume / intensity domain Process on the selected regions and the corresponding rays 32
33 Experimental Results Experimental Results 33
34 Outline Introduction Transfer Function Design Based on Editing Direct Volume Rendering Images Quality Enhancement of Direct Volume Rendered Images Quantitative Effectiveness Metrics for Direct Volume Rendering Visualization Tasks and Features of Interest The effectiveness of a visualization highly depends on the tasks that can be classified into two categories Routine tasks Users usually have prior knowledge of the features that they intend to visualize Exploration tasks Features of interest are unknown Use other visualization techniques to explore the volume and gain some knowledge Use our system in a divide-and-conquer manner Estimate the useful information in the data automatically In summary, features of interest (or desired features) can be either specified by users or predicted by the system 34
35 Effectiveness Metrics (1/3) It is very difficult to design an ideal visualization system which can automatically reveal desired features to users Huge parameter space (e.g., transfer function, viewpoint, lighting) Merely displaying these desired features one by one is not enough Users want to know context and spatial relations between the features Even if only one feature needs to be displayed, self occlusion may become an issue. Artifacts and illusions may be introduced because of inappropriate lighting or view angles Effectiveness Metrics (2/3) User interactions such as changing viewpoints and specifying transfer functions are needed Routine tasks and exploration tasks Even if we know what users want, we may not have a perfect solution to present the information to users automatically so user interactions are still needed The interactions by non-expert users are often error prone and may introduce misleading information leading to unreliable conclusions A scheme is needed to let users know whether their fine tuned transfer functions or view angles are effective or not 35

36 Effectiveness Metrics (3/3) There are two sets of effectiveness metrics Adequate effectiveness metrics If these metrics are satisfied then the visualizations tasks can be achieved They are the holy grail of volume visualization and may not be possible for many applications in the near future Necessary effectiveness metrics If these metrics are not satisfied then visualization tasks cannot be achieved. However, even if these necessary metrics are satisfied, there is still no guarantee that the visualization tasks can be achieved They are more practical and what we want to deal with New Visualization Pipeline 36
 The visibility metric measures the visibility of an important feature in a volume by counting the visible")
37 Effectiveness Evaluator The effectiveness evaluator is used to quantitatively and objectively assess the effectiveness of a DVRI or a whole visualization process based on three effectiveness metrics Visibility metric Distinguishability metric Contour Clarity metric Visibility Metric (1/2) The visibility metric measures the visibility of an important feature in a volume by counting the visible voxels of the feature Two common cases where the visibility metric is needed: (a) DVRI of the CT Knee where the fibula of the left knee is invisible; (b) DVRI of the simulated Neghip having large variance of the intensity values 37

38 Visibility Metric (2/2) The visibility of voxels can be estimated in the process of full imageorder volume rendering Estimate visibility values for the sampling points along each ray Visibility value V i for sampling point i V i would be distributed to the neighboring voxels based on the corresponding weights used in the interpolation The visibility value of a DVRI can then be estimate as E = n i / n n i and n are the number of visible voxels and the number of all voxels inside the important feature, respectively Distinguishability Metric (1/2) The distinguishability metric evaluates how well a feature can be visually differentiated from its surroundings (a) (b) (c) (a) Structure A in blue; (b) Structure B in purple; (c) Blending A and B as well as a green structure C into a new DVRI where A and B are indistinguishable 38

 The contour clarity metric")
39 Distinguishability Metric (2/2) The distinguishability metric aims at detecting the ambiguity caused by the blending effect 1. Segment a given DVRI into a number of fragments 2. Classify the fragments into two classes - fragments with the desired feature and fragments without the desired feature 3. If the fragment with the desired feature has color similar to any fragments without the feature, the metric will record the feature s voxels that contribute to the fragment as indistinguishable voxels The distinguishability value of a DVRI can then be estimated as the ratio of the distinguishable voxels to indistinguishable voxels Contour Clarity Metric (1/2) The contour clarity metric measures how clear the contours of a desired feature are presented in a DVRI (a) (b) A common scenario in volume rendering where the contour clarity metric is needed: the contours of an important feature as shown in (a) are fuzzy and unclear in (b) although the feature is visible and distinguishable 39


40 Contour Clarity Metric (2/2) The metric measures the contour clarity by estimating the similarity between the DVRI and the iso-surface of the salient feature 1. Derive the edge images of both DVRI and the iso-surface 2. Estimate the similarity between the two edge images A given DVRI Salient iso-surface Effectiveness for A Whole Visualization Process For the visibility and distinguishability metrics, we accumulate each voxel s effectiveness values at each DVRI in the visualization process The overall effectiveness values can then be measured as the percentage of the visible and distinguishable voxels after the accumulation to all voxels, respectively. For each of other metrics, Collect all explored viewpoints in the visualization process Each viewpoint stores a highest effectiveness value for the metric and treat it as the metric value at this viewpoint for the whole process Select the lowest effectiveness value among all explored viewpoints as the metric s effectiveness value of the process 40
41 Effectiveness Feedback Manager It organizes and presents the effectiveness values to the end-users in an intuitive manner Conclusions Perception-based transfer function design and evaluation Transfer function design based on editing DVRIs Quality enhancement of DVRIs Effectiveness assessment of DVRIs 41
, pp.")
42 References Yingcai Wu, Huamin Qu. Interactive Transfer Function Design Based on Editing Direct Volume Rendered Images", IEEE Transactions on Visualization and Computer Graphics (TVCG), Vol. 13, No.5, pp , 2007 Ming-Yuen Chan, Yingcai Wu, and Huamin Qu. "Quality Enhancement of Direct Volume Rendered Images", 6th IEEE/EG International Symposium on Volume Graphics (VG'07), pp , (Cover Image) Yingcai Wu, Anbang Xu, Ming-Yuen Chan, Huamin Qu, and Ping Guo. "Palette-Style Volume Visualization", to appear in 6th IEEE/EG International Symposium on Volume Graphics (VG'07), pp , Yingcai Wu, Huamin Qu, Ka-Kei Chung, Wai-Ho Mak, Anbang Xu. "Quantitative Effectiveness Metrics for Direct Volume Rendering". Poster, in the poster session of IEEE Visualization 2007 (Best Poster Candidate). Q & A Thank you for your attention! 42
IEEE TRANSACTIONS ON VISUALIZATION AND COMPUTER GRAPHICS, VOL. 13, NO. 5, SEPTEMBER/OCTOBER
 IEEE TRANSACTIONS ON VISUALIZATION AND COMPUTER GRAPHICS, VOL. 13, NO. 5, SEPTEMBER/OCTOBER 2007 1027 Interactive Transfer Function Design Based on Editing Direct Volume Rendered Images Yingcai Wu, Student
Palette-Style Volume Visualization
 Volume Graphics (2007) H. - C. Hege, R. Machiraju (Editors) Palette-Style Volume Visualization Yingcai Wu 1, Anbang Xu 1, Ming-Yuen Chan 1, Huamin Qu 1, and Ping Guo 2 1 The Hong Kong University of Science
Scalar Data. CMPT 467/767 Visualization Torsten Möller. Weiskopf/Machiraju/Möller
 Scalar Data CMPT 467/767 Visualization Torsten Möller Weiskopf/Machiraju/Möller Overview Basic strategies Function plots and height fields Isolines Color coding Volume visualization (overview) Classification
Scalar Data. Visualization Torsten Möller. Weiskopf/Machiraju/Möller
 Scalar Data Visualization Torsten Möller Weiskopf/Machiraju/Möller Overview Basic strategies Function plots and height fields Isolines Color coding Volume visualization (overview) Classification Segmentation
Mirrored LH Histograms for the Visualization of Material Boundaries
 Mirrored LH Histograms for the Visualization of Material Boundaries Petr Šereda 1, Anna Vilanova 1 and Frans A. Gerritsen 1,2 1 Department of Biomedical Engineering, Technische Universiteit Eindhoven,
cs6630 November TRANSFER FUNCTIONS Alex Bigelow University of Utah
 cs6630 November 14 2014 TRANSFER FUNCTIONS Alex Bigelow University of Utah 1 cs6630 November 13 2014 TRANSFER FUNCTIONS Alex Bigelow University of Utah slide acknowledgements: Miriah Meyer, University
Previously... contour or image rendering in 2D
 Volume Rendering Visualisation Lecture 10 Taku Komura Institute for Perception, Action & Behaviour School of Informatics Volume Rendering 1 Previously... contour or image rendering in 2D 2D Contour line
Volume Visualization
 Volume Visualization Part 1 (out of 3) Overview: Volume Visualization Introduction to volume visualization On volume data Surface vs. volume rendering Overview: Techniques Simple methods Slicing, cuberille
Volume Visualization. Part 1 (out of 3) Volume Data. Where do the data come from? 3D Data Space How are volume data organized?
 Volume Data. Where do the data come from? 3D Data Space How are volume data organized?") Volume Data Volume Visualization Part 1 (out of 3) Where do the data come from? Medical Application Computed Tomographie (CT) Magnetic Resonance Imaging (MR) Materials testing Industrial-CT Simulation
Volume Data Volume Visualization Part 1 (out of 3) Where do the data come from? Medical Application Computed Tomographie (CT) Magnetic Resonance Imaging (MR) Materials testing Industrial-CT Simulation
Pipeline Operations. CS 4620 Lecture 10
 Pipeline Operations CS 4620 Lecture 10 2008 Steve Marschner 1 Hidden surface elimination Goal is to figure out which color to make the pixels based on what s in front of what. Hidden surface elimination
Volume Rendering. Lecture 21
 Volume Rendering Lecture 21 Acknowledgements These slides are collected from many sources. A particularly valuable source is the IEEE Visualization conference tutorials. Sources from: Roger Crawfis, Klaus
4. Basic Mapping Techniques
 4. Basic Mapping Techniques Mapping from (filtered) data to renderable representation Most important part of visualization Possible visual representations: Position Size Orientation Shape Brightness Color
Computer Graphics. Shadows
 Computer Graphics Lecture 10 Shadows Taku Komura Today Shadows Overview Projective shadows Shadow texture Shadow volume Shadow map Soft shadows Why Shadows? Shadows tell us about the relative locations
Volume visualization. Volume visualization. Volume visualization methods. Sources of volume visualization. Sources of volume visualization
 Volume visualization Volume visualization Volumes are special cases of scalar data: regular 3D grids of scalars, typically interpreted as density values. Each data value is assumed to describe a cubic
RINGS : A Technique for Visualizing Large Hierarchies
 RINGS : A Technique for Visualizing Large Hierarchies Soon Tee Teoh and Kwan-Liu Ma Computer Science Department, University of California, Davis {teoh, ma}@cs.ucdavis.edu Abstract. We present RINGS, a
Volume Rendering. Computer Animation and Visualisation Lecture 9. Taku Komura. Institute for Perception, Action & Behaviour School of Informatics
 Volume Rendering Computer Animation and Visualisation Lecture 9 Taku Komura Institute for Perception, Action & Behaviour School of Informatics Volume Rendering 1 Volume Data Usually, a data uniformly distributed
Introduction. Illustrative rendering is also often called non-photorealistic rendering (NPR)
") Introduction Illustrative rendering is also often called non-photorealistic rendering (NPR) we shall use these terms here interchangeably NPR offers many opportunities for visualization that conventional
Introduction Illustrative rendering is also often called non-photorealistic rendering (NPR) we shall use these terms here interchangeably NPR offers many opportunities for visualization that conventional
First Steps in Hardware Two-Level Volume Rendering
 First Steps in Hardware Two-Level Volume Rendering Markus Hadwiger, Helwig Hauser Abstract We describe first steps toward implementing two-level volume rendering (abbreviated as 2lVR) on consumer PC graphics
Volume Graphics Introduction
 High-Quality Volume Graphics on Consumer PC Hardware Volume Graphics Introduction Joe Kniss Gordon Kindlmann Markus Hadwiger Christof Rezk-Salama Rüdiger Westermann Motivation (1) Motivation (2) Scientific
Display. Introduction page 67 2D Images page 68. All Orientations page 69 Single Image page 70 3D Images page 71
 Display Introduction page 67 2D Images page 68 All Orientations page 69 Single Image page 70 3D Images page 71 Intersecting Sections page 71 Cube Sections page 72 Render page 73 1. Tissue Maps page 77
BCC Sphere Transition
 BCC Sphere Transition The Sphere Transition shape models the source image onto a sphere. Unlike the Sphere filter, the Sphere Transition filter allows you to animate Perspective, which is useful in creating
Interactive Boundary Detection for Automatic Definition of 2D Opacity Transfer Function
 Interactive Boundary Detection for Automatic Definition of 2D Opacity Transfer Function Martin Rauberger, Heinrich Martin Overhoff Medical Engineering Laboratory, University of Applied Sciences Gelsenkirchen,
Volume Illumination, Contouring
 Volume Illumination, Contouring Computer Animation and Visualisation Lecture 0 tkomura@inf.ed.ac.uk Institute for Perception, Action & Behaviour School of Informatics Contouring Scaler Data Overview -
11/1/13. Visualization. Scientific Visualization. Types of Data. Height Field. Contour Curves. Meshes
 CSCI 420 Computer Graphics Lecture 26 Visualization Height Fields and Contours Scalar Fields Volume Rendering Vector Fields [Angel Ch. 2.11] Jernej Barbic University of Southern California Scientific Visualization
Visualization. CSCI 420 Computer Graphics Lecture 26
 CSCI 420 Computer Graphics Lecture 26 Visualization Height Fields and Contours Scalar Fields Volume Rendering Vector Fields [Angel Ch. 11] Jernej Barbic University of Southern California 1 Scientific Visualization
Pipeline Operations. CS 4620 Lecture Steve Marschner. Cornell CS4620 Spring 2018 Lecture 11
 Pipeline Operations CS 4620 Lecture 11 1 Pipeline you are here APPLICATION COMMAND STREAM 3D transformations; shading VERTEX PROCESSING TRANSFORMED GEOMETRY conversion of primitives to pixels RASTERIZATION
Conveying 3D Shape and Depth with Textured and Transparent Surfaces Victoria Interrante
 Conveying 3D Shape and Depth with Textured and Transparent Surfaces Victoria Interrante In scientific visualization, there are many applications in which researchers need to achieve an integrated understanding
Adobe Illustrator CS Design Professional CREATING TEXT AND GRADIENTS
 Adobe Illustrator CS Design Professional CREATING TEXT AND GRADIENTS Chapter Lessons Create and format text Flow text into an object Position text on a path Create colors and gradients Apply colors and
DETECTION OF SMOOTH TEXTURE IN FACIAL IMAGES FOR THE EVALUATION OF UNNATURAL CONTRAST ENHANCEMENT
 DETECTION OF SMOOTH TEXTURE IN FACIAL IMAGES FOR THE EVALUATION OF UNNATURAL CONTRAST ENHANCEMENT 1 NUR HALILAH BINTI ISMAIL, 2 SOONG-DER CHEN 1, 2 Department of Graphics and Multimedia, College of Information
Visualization Computer Graphics I Lecture 20
 15-462 Computer Graphics I Lecture 20 Visualization Height Fields and Contours Scalar Fields Volume Rendering Vector Fields [Angel Ch. 12] April 15, 2003 Frank Pfenning Carnegie Mellon University http://www.cs.cmu.edu/~fp/courses/graphics/
Height Fields and Contours Scalar Fields Volume Rendering Vector Fields [Angel Ch. 12] April 23, 2002 Frank Pfenning Carnegie Mellon University
![Height Fields and Contours Scalar Fields Volume Rendering Vector Fields [Angel Ch. 12] April 23, 2002 Frank Pfenning Carnegie Mellon University](/thumbs/90/102611276.jpg "Height Fields and Contours Scalar Fields Volume Rendering Vector Fields [Angel Ch. 12] April 23, 2002 Frank Pfenning Carnegie Mellon University") 15-462 Computer Graphics I Lecture 21 Visualization Height Fields and Contours Scalar Fields Volume Rendering Vector Fields [Angel Ch. 12] April 23, 2002 Frank Pfenning Carnegie Mellon University http://www.cs.cmu.edu/~fp/courses/graphics/
15-462 Computer Graphics I Lecture 21 Visualization Height Fields and Contours Scalar Fields Volume Rendering Vector Fields [Angel Ch. 12] April 23, 2002 Frank Pfenning Carnegie Mellon University http://www.cs.cmu.edu/~fp/courses/graphics/
Volume Illumination. Visualisation Lecture 11. Taku Komura. Institute for Perception, Action & Behaviour School of Informatics
 Volume Illumination Visualisation Lecture 11 Taku Komura Institute for Perception, Action & Behaviour School of Informatics Taku Komura Volume Illumination & Vector Vis. 1 Previously : Volume Rendering
Pipeline Operations. CS 4620 Lecture 14
 Pipeline Operations CS 4620 Lecture 14 2014 Steve Marschner 1 Pipeline you are here APPLICATION COMMAND STREAM 3D transformations; shading VERTEX PROCESSING TRANSFORMED GEOMETRY conversion of primitives
Data Visualization (CIS/DSC 468)
") Data Visualization (CIS/DSC 46) Volume Rendering Dr. David Koop Visualizing Volume (3D) Data 2D visualization slice images (or multi-planar reformating MPR) Indirect 3D visualization isosurfaces (or surface-shaded
Data Visualization (CIS/DSC 46) Volume Rendering Dr. David Koop Visualizing Volume (3D) Data 2D visualization slice images (or multi-planar reformating MPR) Indirect 3D visualization isosurfaces (or surface-shaded
Working with the BCC Bump Map Generator
 Working with the BCC Bump Map Generator Bump mapping is used to create three dimensional detail on an image based on the luminance information in the image. The luminance value of each pixel of the image
COMP371 COMPUTER GRAPHICS
 COMP371 COMPUTER GRAPHICS LECTURE 14 RASTERIZATION 1 Lecture Overview Review of last class Line Scan conversion Polygon Scan conversion Antialiasing 2 Rasterization The raster display is a matrix of picture
Scalar Data. Alark Joshi
 Scalar Data Alark Joshi Announcements Pick two papers to present Email me your top 3/4 choices. FIFO allotment Contact your clients Blog summaries: http://cs.boisestate.edu/~alark/cs564/participants.html
2. Review of current methods
 Transfer Functions for Direct Volume Rendering Gordon Kindlmann gk@cs.utah.edu http://www.cs.utah.edu/~gk Scientific Computing and Imaging Institute School of Computing University of Utah Contributions:
Volume Illumination and Segmentation
 Volume Illumination and Segmentation Computer Animation and Visualisation Lecture 13 Institute for Perception, Action & Behaviour School of Informatics Overview Volume illumination Segmentation Volume
CIS 467/602-01: Data Visualization
 CIS 467/60-01: Data Visualization Isosurfacing and Volume Rendering Dr. David Koop Fields and Grids Fields: values come from a continuous domain, infinitely many values - Sampled at certain positions to
EE795: Computer Vision and Intelligent Systems
 EE795: Computer Vision and Intelligent Systems Spring 2012 TTh 17:30-18:45 WRI C225 Lecture 02 130124 http://www.ee.unlv.edu/~b1morris/ecg795/ 2 Outline Basics Image Formation Image Processing 3 Intelligent
Lecture overview. Visualisatie BMT. Transparency. Transparency. Transparency. Transparency. Transparency Volume rendering Assignment
 Visualisatie BMT Lecture overview Assignment Arjan Kok a.j.f.kok@tue.nl 1 Makes it possible to see inside or behind objects Complement of transparency is opacity Opacity defined by alpha value with range
Overcompressing JPEG images with Evolution Algorithms
 Author manuscript, published in "EvoIASP2007, Valencia : Spain (2007)" Overcompressing JPEG images with Evolution Algorithms Jacques Lévy Véhel 1, Franklin Mendivil 2 and Evelyne Lutton 1 1 Inria, Complex
Scalar Visualization
 Scalar Visualization 5-1 Motivation Visualizing scalar data is frequently encountered in science, engineering, and medicine, but also in daily life. Recalling from earlier, scalar datasets, or scalar fields,
Visualization. Images are used to aid in understanding of data. Height Fields and Contours Scalar Fields Volume Rendering Vector Fields [chapter 26]
![Visualization. Images are used to aid in understanding of data. Height Fields and Contours Scalar Fields Volume Rendering Vector Fields [chapter 26]](/thumbs/74/70771954.jpg "Visualization. Images are used to aid in understanding of data. Height Fields and Contours Scalar Fields Volume Rendering Vector Fields [chapter 26]") Visualization Images are used to aid in understanding of data Height Fields and Contours Scalar Fields Volume Rendering Vector Fields [chapter 26] Tumor SCI, Utah Scientific Visualization Visualize large
Visualization Images are used to aid in understanding of data Height Fields and Contours Scalar Fields Volume Rendering Vector Fields [chapter 26] Tumor SCI, Utah Scientific Visualization Visualize large
A Topology Based Visualization for Exploring Data with Uncertainty. Keqin Wu, 10/24/2011 Mississippi state University
 A Topology Based Visualization for Exploring Data with Uncertainty Keqin Wu, 10/24/2011 Mississippi state University Outline Introduction Related Work Method - Contour Tree Layout and Tree View Graph Design
This work is about a new method for generating diffusion curve style images. Although this topic is dealing with non-photorealistic rendering, as you
 This work is about a new method for generating diffusion curve style images. Although this topic is dealing with non-photorealistic rendering, as you will see our underlying solution is based on two-dimensional
BCC Rays Ripply Filter
 BCC Rays Ripply Filter The BCC Rays Ripply filter combines a light rays effect with a rippled light effect. The resulting light is generated from a selected channel in the source image and spreads from
Data Visualization (DSC 530/CIS )
") Data Visualization (DSC 530/CIS 60-0) Isosurfaces & Volume Rendering Dr. David Koop Fields & Grids Fields: - Values come from a continuous domain, infinitely many values - Sampled at certain positions
Data Visualization (DSC 530/CIS 60-0) Isosurfaces & Volume Rendering Dr. David Koop Fields & Grids Fields: - Values come from a continuous domain, infinitely many values - Sampled at certain positions
Visualization Computer Graphics I Lecture 20
 15-462 Computer Graphics I Lecture 20 Visualization Height Fields and Contours Scalar Fields Volume Rendering Vector Fields [Angel Ch. 12] November 20, 2003 Doug James Carnegie Mellon University http://www.cs.cmu.edu/~djames/15-462/fall03
Computer Graphics 10 - Shadows
 Computer Graphics 10 - Shadows Tom Thorne Slides courtesy of Taku Komura www.inf.ed.ac.uk/teaching/courses/cg Overview Shadows Overview Projective shadows Shadow textures Shadow volume Shadow map Soft
Working with the BCC 3D Image Shatter Filter
 Working with the BCC 3D Image Shatter Filter 3D Image Shatter shatters the image in 3D space and disperses the image fragments. The Þlter provides a variety of explosion, velocity, and gravity parameters
Lecture 15: Shading-I. CITS3003 Graphics & Animation
 Lecture 15: Shading-I CITS3003 Graphics & Animation E. Angel and D. Shreiner: Interactive Computer Graphics 6E Addison-Wesley 2012 Objectives Learn that with appropriate shading so objects appear as threedimensional
Computer Graphics. Shading. Based on slides by Dianna Xu, Bryn Mawr College
 Computer Graphics Shading Based on slides by Dianna Xu, Bryn Mawr College Image Synthesis and Shading Perception of 3D Objects Displays almost always 2 dimensional. Depth cues needed to restore the third
Visual Perception. Visual contrast
 TEXTURE Visual Perception Our perception of the visual shape, size, color, and texture of things is affected by the optical environment in which we see them and the relationships we can discern between
Emissive Clip Planes for Volume Rendering Supplement.
 Emissive Clip Planes for Volume Rendering Supplement. More material than fit on the one page version for the SIGGRAPH 2003 Sketch by Jan Hardenbergh & Yin Wu of TeraRecon, Inc. Left Image: The clipped
Introduction to Visualization and Computer Graphics
 Introduction to Visualization and Computer Graphics DH2320, Fall 2015 Prof. Dr. Tino Weinkauf Introduction to Visualization and Computer Graphics Visibility Shading 3D Rendering Geometric Model Color Perspective
OpenGl Pipeline. triangles, lines, points, images. Per-vertex ops. Primitive assembly. Texturing. Rasterization. Per-fragment ops.
 OpenGl Pipeline Individual Vertices Transformed Vertices Commands Processor Per-vertex ops Primitive assembly triangles, lines, points, images Primitives Fragments Rasterization Texturing Per-fragment
Local Illumination. CMPT 361 Introduction to Computer Graphics Torsten Möller. Machiraju/Zhang/Möller
 Local Illumination CMPT 361 Introduction to Computer Graphics Torsten Möller Graphics Pipeline Hardware Modelling Transform Visibility Illumination + Shading Perception, Interaction Color Texture/ Realism
Working with the BCC Brick Generator
 Working with the BCC Brick Generator Brick is a versatile generator of tiled surfaces with realistic texture and lighting controls. The bricks can act as a Þlter on a layer or generate a brick surface
Comparative Visualization and Trend Analysis Techniques for Time-Varying Data
 Comparative Visualization and Trend Analysis Techniques for Time-Varying Data I was just noticing Problem Statement Time varying visualization for scientific data has typically been done with animation
CS4758: Rovio Augmented Vision Mapping Project
 CS4758: Rovio Augmented Vision Mapping Project Sam Fladung, James Mwaura Abstract The goal of this project is to use the Rovio to create a 2D map of its environment using a camera and a fixed laser pointer
Color. making some recognition problems easy. is 400nm (blue) to 700 nm (red) more; ex. X-rays, infrared, radio waves. n Used heavily in human vision
 to 700 nm (red) more; ex. X-rays, infrared, radio waves. n Used heavily in human vision") Color n Used heavily in human vision n Color is a pixel property, making some recognition problems easy n Visible spectrum for humans is 400nm (blue) to 700 nm (red) n Machines can see much more; ex. X-rays,
Color n Used heavily in human vision n Color is a pixel property, making some recognition problems easy n Visible spectrum for humans is 400nm (blue) to 700 nm (red) n Machines can see much more; ex. X-rays,
Illumination and Shading
 Illumination and Shading Illumination (Lighting)! Model the interaction of light with surface points to determine their final color and brightness! The illumination can be computed either at vertices or
Digital Makeup Face Generation
 Digital Makeup Face Generation Wut Yee Oo Mechanical Engineering Stanford University wutyee@stanford.edu Abstract Make up applications offer photoshop tools to get users inputs in generating a make up
User Documentation for IDVR (Importance driven volume rendering)
") User Documentation for IDVR (Importance driven volume rendering) Bernhard Pflugfelder e0027467 Christopher Thurnher e0125913 Institute of Computer Graphics and Algorithms Loading a Dataset... - 4 - Loading
User Documentation for IDVR (Importance driven volume rendering) Bernhard Pflugfelder e0027467 Christopher Thurnher e0125913 Institute of Computer Graphics and Algorithms Loading a Dataset... - 4 - Loading
The VesselGlyph: Focus & Context Visualization in CT-Angiography
 The VesselGlyph: Focus & Context Visualization in CT-Angiography Matúš Straka M. Šrámek, A. La Cruz E. Gröller, D. Fleischmann Contents Motivation:» Why again a new visualization method for vessel data?
One image is worth 1,000 words
 Image Databases Prof. Paolo Ciaccia http://www-db. db.deis.unibo.it/courses/si-ls/ 07_ImageDBs.pdf Sistemi Informativi LS One image is worth 1,000 words Undoubtedly, images are the most wide-spread MM
Data Visualization (DSC 530/CIS )
") Data Visualization (DSC 530/CIS 60-01) Scalar Visualization Dr. David Koop Online JavaScript Resources http://learnjsdata.com/ Good coverage of data wrangling using JavaScript Fields in Visualization Scalar
Data Visualization (DSC 530/CIS 60-01) Scalar Visualization Dr. David Koop Online JavaScript Resources http://learnjsdata.com/ Good coverage of data wrangling using JavaScript Fields in Visualization Scalar
Vector Visualization
 Vector Visualization Vector Visulization Divergence and Vorticity Vector Glyphs Vector Color Coding Displacement Plots Stream Objects Texture-Based Vector Visualization Simplified Representation of Vector
DI TRANSFORM. The regressive analyses. identify relationships
 July 2, 2015 DI TRANSFORM MVstats TM Algorithm Overview Summary The DI Transform Multivariate Statistics (MVstats TM ) package includes five algorithm options that operate on most types of geologic, geophysical,
Volume Illumination & Vector Field Visualisation
 Volume Illumination & Vector Field Visualisation Visualisation Lecture 11 Institute for Perception, Action & Behaviour School of Informatics Volume Illumination & Vector Vis. 1 Previously : Volume Rendering
Education and Training CUFMEM14A. Exercise 2. Create, Manipulate and Incorporate 2D Graphics
 Education and Training CUFMEM14A Exercise 2 Create, Manipulate and Incorporate 2D Graphics Menu Exercise 2 Exercise 2a: Scarecrow Exercise - Painting and Drawing Tools... 3 Exercise 2b: Scarecrow Exercise
Volume Ray Casting Neslisah Torosdagli
 Volume Ray Casting Neslisah Torosdagli Overview Light Transfer Optical Models Math behind Direct Volume Ray Casting Demonstration Transfer Functions Details of our Application References What is Volume
BCC Rays Streaky Filter
 BCC Rays Streaky Filter The BCC Rays Streaky filter produces a light that contains streaks. The resulting light is generated from a chosen channel in the source image, and spreads from a source point in
Information Visualization. Overview. What is Information Visualization? SMD157 Human-Computer Interaction Fall 2003
 INSTITUTIONEN FÖR SYSTEMTEKNIK LULEÅ TEKNISKA UNIVERSITET Information Visualization SMD157 Human-Computer Interaction Fall 2003 Dec-1-03 SMD157, Information Visualization 1 L Overview What is information
Working with the BCC 2D Particles Filter
 Working with the BCC 2D Particles Filter 2D Particles breaks the source image into particles and disperses them in 2D space. This Þlter also provides a variety of explosion, velocity, and gravity controls
Applying Synthetic Images to Learning Grasping Orientation from Single Monocular Images
 Applying Synthetic Images to Learning Grasping Orientation from Single Monocular Images 1 Introduction - Steve Chuang and Eric Shan - Determining object orientation in images is a well-established topic
This research aims to present a new way of visualizing multi-dimensional data using generalized scatterplots by sensitivity coefficients to highlight
 This research aims to present a new way of visualizing multi-dimensional data using generalized scatterplots by sensitivity coefficients to highlight local variation of one variable with respect to another.
Automatic Trimap Generation for Digital Image Matting
 Automatic Trimap Generation for Digital Image Matting Chang-Lin Hsieh and Ming-Sui Lee Department of Computer Science and Information Engineering, National Taiwan University, Taipei, Taiwan, R.O.C. E-mail:
A Statistical Approach to Culture Colors Distribution in Video Sensors Angela D Angelo, Jean-Luc Dugelay
 A Statistical Approach to Culture Colors Distribution in Video Sensors Angela D Angelo, Jean-Luc Dugelay VPQM 2010, Scottsdale, Arizona, U.S.A, January 13-15 Outline Introduction Proposed approach Colors
Morphological and Statistical Techniques for the Analysis of 3D Images. Enric Meinhardt-Llopis
 Morphological and Statistical Techniques for the Analysis of 3D Images Enric Meinhardt-Llopis 3 3 2011 2 / 57 Outline Motivation: 2D/3D differences The 3D tree of shapes Applications of the tree of shapes
Lecture 6: Edge Detection
 #1 Lecture 6: Edge Detection Saad J Bedros sbedros@umn.edu Review From Last Lecture Options for Image Representation Introduced the concept of different representation or transformation Fourier Transform
Color. Today. part 2. How to Read a Research Paper Components of a Well-written Research Paper 3 Readings for Today
 Color part 2 Today How to Read a Research Paper Components of a Well-written Research Paper 3 Readings for Today Modeling Color Difference for Visualization Design Szafir, IEEE TVCG / IEEE VIS 2017 Hue-Preserving
Work with Shapes. Concepts CHAPTER. Concepts, page 3-1 Procedures, page 3-5
 3 CHAPTER Revised: November 15, 2011 Concepts, page 3-1, page 3-5 Concepts The Shapes Tool is Versatile, page 3-2 Guidelines for Shapes, page 3-2 Visual Density Transparent, Translucent, or Opaque?, page
SIFT - scale-invariant feature transform Konrad Schindler
 SIFT - scale-invariant feature transform Konrad Schindler Institute of Geodesy and Photogrammetry Invariant interest points Goal match points between images with very different scale, orientation, projective
Digital Image Processing ERRATA. Wilhelm Burger Mark J. Burge. An algorithmic introduction using Java. Second Edition. Springer
 Wilhelm Burger Mark J. Burge Digital Image Processing An algorithmic introduction using Java Second Edition ERRATA Springer Berlin Heidelberg NewYork Hong Kong London Milano Paris Tokyo 12.1 RGB Color
Scalar Visualization
 Scalar Visualization Visualizing scalar data Popular scalar visualization techniques Color mapping Contouring Height plots outline Recap of Chap 4: Visualization Pipeline 1. Data Importing 2. Data Filtering
Buffers, Textures, Compositing, and Blending. Overview. Buffers. David Carr Virtual Environments, Fundamentals Spring 2005 Based on Slides by E.
 INSTITUTIONEN FÖR SYSTEMTEKNIK LULEÅ TEKNISKA UNIVERSITET Buffers, Textures, Compositing, and Blending David Carr Virtual Environments, Fundamentals Spring 2005 Based on Slides by E. Angel Compositing,
Babu Madhav Institute of Information Technology Years Integrated M.Sc.(IT)(Semester - 7)
(Semester - 7)") 5 Years Integrated M.Sc.(IT)(Semester - 7) 060010707 Digital Image Processing UNIT 1 Introduction to Image Processing Q: 1 Answer in short. 1. What is digital image? 1. Define pixel or picture element?
5 Years Integrated M.Sc.(IT)(Semester - 7) 060010707 Digital Image Processing UNIT 1 Introduction to Image Processing Q: 1 Answer in short. 1. What is digital image? 1. Define pixel or picture element?
Clipping. CSC 7443: Scientific Information Visualization
 Clipping Clipping to See Inside Obscuring critical information contained in a volume data Contour displays show only exterior visible surfaces Isosurfaces can hide other isosurfaces Other displays can
Medical Image Processing using MATLAB
 Medical Image Processing using MATLAB Emilia Dana SELEŢCHI University of Bucharest, Romania ABSTRACT 2. 3. 2. IMAGE PROCESSING TOOLBOX MATLAB and the Image Processing Toolbox provide a wide range of advanced
Raycasting. Ronald Peikert SciVis Raycasting 3-1
 Raycasting Ronald Peikert SciVis 2007 - Raycasting 3-1 Direct volume rendering Volume rendering (sometimes called direct volume rendering) stands for methods that generate images directly from 3D scalar
Paint by Numbers and Comprehensible Rendering of 3D Shapes
 Paint by Numbers and Comprehensible Rendering of 3D Shapes Prof. Allison Klein Announcements Sign up for 1 st presentation at end of class today Undergrads: Thinking about grad school? Still here over
BCC Comet Generator Source XY Source Z Destination XY Destination Z Completion Time
 BCC Comet Generator Comet creates an auto-animated comet that streaks across the screen. The comet is compromised of particles whose sizes, shapes, and colors can be adjusted. You can also set the length
CHAPTER 6 PERCEPTUAL ORGANIZATION BASED ON TEMPORAL DYNAMICS
 CHAPTER 6 PERCEPTUAL ORGANIZATION BASED ON TEMPORAL DYNAMICS This chapter presents a computational model for perceptual organization. A figure-ground segregation network is proposed based on a novel boundary
2. If a window pops up that asks if you want to customize your color settings, click No.
 Practice Activity: Adobe Photoshop 7.0 ATTENTION! Before doing this practice activity you must have all of the following materials saved to your USB: runningshoe.gif basketballshoe.gif soccershoe.gif baseballshoe.gif
Visualisatie BMT. Rendering. Arjan Kok
 Visualisatie BMT Rendering Arjan Kok a.j.f.kok@tue.nl 1 Lecture overview Color Rendering Illumination 2 Visualization pipeline Raw Data Data Enrichment/Enhancement Derived Data Visualization Mapping Abstract
Visual Representation from Semiology of Graphics by J. Bertin
 Visual Representation from Semiology of Graphics by J. Bertin From a communication perspective Communication is too often taken for granted when it should be taken to pieces. (Fiske 91) Two basic schools
move object resize object create a sphere create light source camera left view camera view animation tracks
 Computer Graphics & Animation: CS Day @ SIUC This session explores computer graphics and animation using software that will let you create, display and animate 3D Objects. Basically we will create a 3