What is visualization? Why is it important?
|
|
|
- Magdalen Benson
- 6 years ago
- Views:
Transcription
1 What is visualization? Why is it important?
2 What does visualization do?
3 What is the difference between scientific data and information data

4 Visualization Pipeline
5 Visualization Pipeline Overview Data acquisition Data are generated. Data enhancement Data are processed. Visualization mapping Data are mapped to visual primitives, e.g. colors, geometry, etc. Rendering (ND >2D) Images are generated.

 Mathematical and technical models > e.g.")
 Artificial world (documented/log ) Data that")
6 Visualization Pipeline Step 1 Data acquisition Real world (measured) Measurements and observations, e.g., CT/MRI, GIS (MB), seismic data (GB), Hubble Space Telescope (TB) Theoretical world (computed) Mathematical and technical models > e.g., Structural mechanics (MB), CFD simulation (GB TB/steady, TB and beyond for time series) Artificial world (documented/log ) Data that is designed, e.g. drawing (MB), game industry (GB)
, denoising Resampling (e.g., on a different resolution grid) Reduce data size")
 For continuous data only Analysis (may be separated into different steps)")
7 Visualization Pipeline Step 2 Data enhancement Filtering (e.g., smoothing), denoising Resampling (e.g., on a different resolution grid) Reduce data size Calibrate different data sources Data interpolation (e.g., linear, cubic, basis, ) For continuous data only Analysis (may be separated into different steps) Feature identification Data derivation (e.g., gradients, limits, curvature, closed sub sets, structure, )
8 Visualization Pipeline Step 3 Visualization mapping = map data to something that is renderable Choose proper geometric elements Grids (e.g., the original meshes, images, etc.) typically come with the data. Iso contour/surface calculation (create continuity or discontinuity) need to be extracted Glyphs, Icons determination need to be constructed, map data to the shape, orientation, size, boundary of the glyphs Graph layout calculation (determine geometric locations) Choose proper optical attributes for the geometric elements as above color, transparency, texture
9 Visualization Pipeline Step 4 Rendering = image generation with Computer Graphics techniques View point selection Visibility calculation Illumination (determine pixel colors) Compositing (combine transparent objects, ) Animation (a sequence of static images)
10 Visualization Pipeline Overview Data acquisition Data enhancement Changing view point/parameters Selecting different attributes User interactions Visualization mapping Rendering (ND >2D)
11 Mike s Visualization Pipeline Seven Steps to Creating a Visualization 1. Get the data. Find out something about it. Units? Spatial dimension? Data dimension? 2. Formulate a scientific strategy. What do you want to show? How do you want to show it? What final format/medium do you need it in? 3. Import the data. (This often takes more time than you would ever expect ) 4. Create a simple program, network, script, etc. 5. Incrementally embellish it. Save it often! 6. Choose what quantities you want to interact with. Change the interaction styles to match the quantities being modified. 7. Create the final output. Pay attention to your color choices!
12 Some Useful Principles Data owners Domain experts Know the content of the application, and characteristics of the data Understand or translate what the user is looking for Visualization mapping, User Interface


13 Simulation (Data Acquisition) Expected Effects Data Enhancement Domain expert interpretations Visual mapping Rendering Various Visualizations
14 Reading Robert S. Laramee, How to Read a Visualization Research Paper: Extracting the Essentials amee09how2read.pdf A great tutorial for getting into this area
15 Data and Its Representation


16 General Data Types I Data Dimensionality 1D: slider bars for scalar value range 2D: geographical data, images, maps, 2D slices of 3D data 3D: CAD, architecture, medical, biological, scientific computing, N D: records in logs, data entries in database, social media Time series: things that are changing over time
17 General Data Types II Data organization Sequential: lists (linear relation) Rational: tables Tree: hierarchical data, nested data Graphs: computer network, social network
18 LET US FOCUS ON SCIENTIFIC DATA
19 Scientific Data Data Types determined by Characteristics of datasets: dimension of domain: number of coordinates or parameters dimension of values static vs. time dependent Representation discretized data type of discretization: (un )structured grid, scattered data, deterministic vs. stochastic (uncertain)

20 In many cases, scientific data describe certain functions with the input as the spatial coordinates and time, and the output as the data values. f Source: VIS, University of Stuttgart 1D 2D 3D +time scalar vector tensor
21 A Complexity Space of Data Data sizes Petabytes Terabytes Gigabytes Megabytes 2D+time 3D Kilobytes 2D scalar vector tensor Higher order tensor Data Values 3D+time Higher dimensional Domain 21
22 Data Representation In the scientific data regime, the data typically describe continuous physical events in the continuous physical space+time. This is contradict to the discrete natural of the digital machine. In order to represent these data in the machine with finite space, discrete representation is necessary how to sample structured vs. unstructured Sampling case Cartesian grids, images, spacing, etc. Unstructured, connectivity, spacing, primitives (e.g. simplexes) Lists Continuous basis, e.g. polynomials, spectral, wavelet

 Numerical simulation data: structured,")


23 Data Discretizations Discretization strategy is determined by the types of data sources : Measurement data: typically scattered (no grid) Numerical simulation data: structured, block structured, unstructured grids adaptively refined meshes etc. Houston air monitor stations Imaging methods: uniform grids Mathematical functions: uniform/adaptive sampling on demand


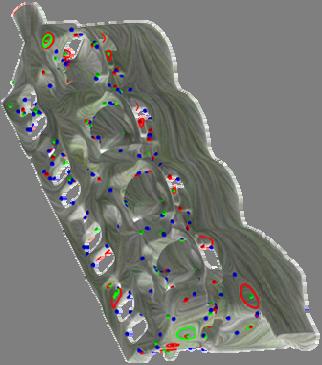
24 Scattered Data Scattered data means: only nodes, no cells Typical data sources: measurement data, e.g. meteorological Options for visualization: point based methods (relatively few algorithms) triangulation, e.g. constrained Delaunay, difficult in 3D resampling on uniform grid

25 Voronoi Diagram Source:

26 Delaunay Triangulation Source:
 unstructured cells are triangles and/or quadrangles domain can be a")
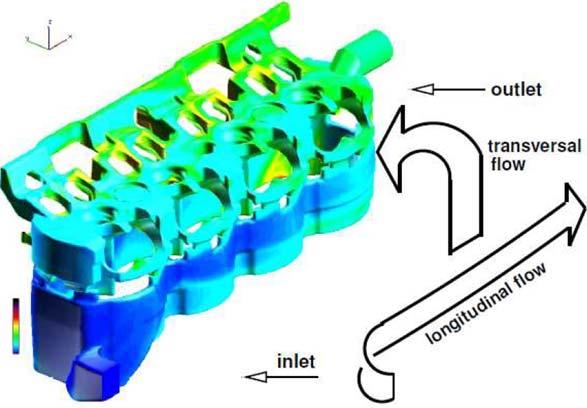
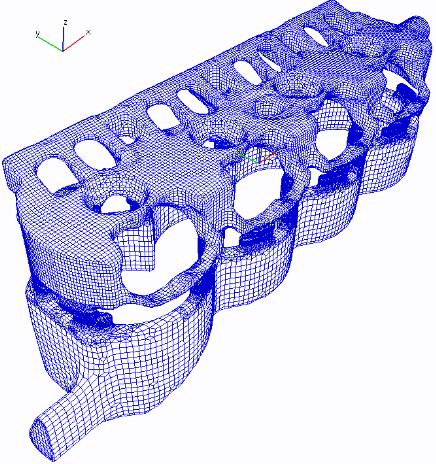
27 Data Stored on Grids Unstructured Typical data sources: simulation data, e.g. CFD 2D (plane or surfaces) unstructured cells are triangles and/or quadrangles domain can be a surface embedded in 3 space


28 Arbitrary Surfaces Mesh (geometry) Discrete representation Parametric surfaces Triangular mesh
29 Shape visualization Arbitrary Surfaces Attributes that can be used by visualization: Shading/lighting Silhouette Feature curves Colors Transparency
30 What do we need to represent an unstructured grid? For 2 manifold surfaces: Vertex (0D) Edge (1D) Face (2D) Corner Polyhedron (contains the above member variables)
31 Polyhedron (Container) Vertex list vertex **vlist; int num_verts, max_verts; Face flist face **flist; int num_faces, max_faces; Edge elist face **elist; int num_edges, max_edges; Corner clist corner **clist; int num_corners, max_corners;
32 Vertex (required) V=(x, y, z) Basic (x, y, z) coordinates, necessary index almost always needed, automatic based on ordering Attributes or data, like (nx, ny, nz) normal, optional Derived List of faces incident to the vertex almost always needed, constructed later List of edges incident to the vertex almost always needed, constructed later
33 Face D C (required) A B F=(A, B,C,D) Basic List of vertices necessary, typically the indices of the vertices index almost always needed, automatic based on ordering Attributes and data, optional Derived List of edges almost always necessary, constructed later
 require additional types: wedge (3 sided prism), and pyramid (4")
34 Unstructured Grids 3D (volume) unstructured cells are tetrahedra or hexahedra mixed grids ( zoo meshes ) require additional types: wedge (3 sided prism), and pyramid (4 sided)


35 What Should be Stored? Tetrahedral Vertex list 3D cell list with four vertices for each cell Hexahedra Vertex list 3D cell list with edges (pairs of vertices) that form a cell Hybrid Vertex list 2D cell list 3D cell list

, y =")

36 Structured Grids General case: curvilinear grid nodes given in array Ni Nj Nk cells are implicit Special case: rectilinear grid simpler coordinate functions: x = x (i), y = y (j), z = z(k) More special: uniform grid coordinates defined by axis aligned bounding box ( 2 points)
37 Data Value Storage where are my data stored? Point based Cell based Dual
38 PLY format Header Elements Properties Data
39 PLY format of a Cube ply format ascii 1.0 comment created by platoply element vertex 8 property float32 x property float32 y property float32 z element face 6 property list uint8 int32 vertex_indices end_header Vertex list Face list header Data
40 PLY format (header) ply format ascii1.0 comment created by platoply element vertex 8 property float32 x property float32 y property float32 z element face 6 property list uint8 int32 vertex_indices end_header
41 PLY format Vertex list Face list z y x
42 X Y Z PLY format z y x
43 PLY format Face list z y #of vertices Vertex indices x
44 PLY format Face list z y #of vertices Vertex indices x
45 PLY format Face list z y #of vertices Vertex indices x
46 Store Values in PLY Files X Y Z v1 v element vertex 8 property float32 x property float32 y property float32 z property float32 v1 property float32 v2
47 VISUALIZATION LIBRARY

48 Free open source software for 3D computer graphics, image processing and visualization Consists of a C++ class library VTK classes implemented with.h and.cxx files Several interpreted interface layers, including Python, Tcl/Tk, and Java Supports a wide variety of visualization algorithms including scalar, vector, tensor, texture, and volumetric Advanced modeling techniques implicit modeling, polygon reduction, mesh smoothing, cutting, contouring and Delaunay triangulation Design and implementation influenced by object oriented principles
 Documentation Online help, HTML based (http://www.")
 Companion Text Books The Visualization Toolkit The VTK User s Guide")
49 VTK Visualization Toolkit Resources Source distribution (source and binaries) Kitware, Inc. Distribution comes with many examples ( Documentation Online help, HTML based ( ) Companion Text Books The Visualization Toolkit The VTK User s Guide
50 Carlos A. Vinhais
51 Carlos A. Vinhais
52 Carlos A. Vinhais
53 Carlos A. Vinhais


54 VTK ParaView VisIt Many Others
55 Acknowledgment Thanks for materials from Dr. Eugene Zhang Dr. Ronald Peikert Carlos A. Vinhais
What is visualization? Why is it important?
 What is visualization? Why is it important? What does visualization do? What is the difference between scientific data and information data Cycle of Visualization Storage De noising/filtering Down sampling
Scientific Visualization
 Scientific Visualization Dr. Ronald Peikert Summer 2007 Ronald Peikert SciVis 2007 - Introduction 1-1 Introduction to Scientific Visualization Ronald Peikert SciVis 2007 - Introduction 1-2 What is Scientific
The capability of traditional presentation techniques is not sufficient for the increasing amount of data to be interpreted
 2. Basics Data sources Visualization pipeline Data representation Domain Data structures Data values Data classification 1 2.1. Data Sources The capability of traditional presentation techniques is not
Scientific Visualization
 Scientific Visualization University of Houston, Fall 2012 Instructor: GuoningChen Course Information Location: PGH 376 Time: 10am~11:30am Tuesday and Thursday Office Hours: TBA Course webpage: http://www2.cs.uh.edu/~chengu/teaching/sci
ACGV 2008, Lecture 1 Tuesday January 22, 2008
 Advanced Computer Graphics and Visualization Spring 2008 Ch 1: Introduction Ch 4: The Visualization Pipeline Ch 5: Basic Data Representation Organization, Spring 2008 Stefan Seipel Filip Malmberg Mats
Data Representation in Visualisation
 Data Representation in Visualisation Visualisation Lecture 4 Taku Komura Institute for Perception, Action & Behaviour School of Informatics Taku Komura Data Representation 1 Data Representation We have
Insight VisREU Site. Agenda. Introduction to Scientific Visualization Using 6/16/2015. The purpose of visualization is insight, not pictures.
 2015 VisREU Site Introduction to Scientific Visualization Using Vetria L. Byrd, Director Advanced Visualization VisREU Site Coordinator REU Site Sponsored by NSF ACI Award 1359223 Introduction to SciVis(High
Visualization Toolkit (VTK) An Introduction
 An Introduction") Visualization Toolkit (VTK) An Introduction An open source, freely available software system for 3D computer graphics, image processing, and visualization Implemented as a C++ class library, with interpreted
Visualization Toolkit (VTK) An Introduction An open source, freely available software system for 3D computer graphics, image processing, and visualization Implemented as a C++ class library, with interpreted
Introduction to Scientific Visualization
 CS53000 - Spring 2018 Introduction to Scientific Visualization Introduction to January 11, 2018 The Visualization Toolkit Open source library for Visualization Computer Graphics Imaging Written in C++
Visualisierung W, VU, 2.0h, 3.0EC
 Visualisierung 1 2014W, VU, 2.0h, 3.0EC 186.827 Eduard Gröller Johanna Schmidt Oana Moraru Institute of Computer Graphics and Algorithms (ICGA), VUT Austria Visualization Examples VolVis InfoVis FlowVis
11/1/13. Visualization. Scientific Visualization. Types of Data. Height Field. Contour Curves. Meshes
 CSCI 420 Computer Graphics Lecture 26 Visualization Height Fields and Contours Scalar Fields Volume Rendering Vector Fields [Angel Ch. 2.11] Jernej Barbic University of Southern California Scientific Visualization
Visualization. CSCI 420 Computer Graphics Lecture 26
 CSCI 420 Computer Graphics Lecture 26 Visualization Height Fields and Contours Scalar Fields Volume Rendering Vector Fields [Angel Ch. 11] Jernej Barbic University of Southern California 1 Scientific Visualization
Scientific Visualization Example exam questions with commented answers
 Scientific Visualization Example exam questions with commented answers The theoretical part of this course is evaluated by means of a multiple- choice exam. The questions cover the material mentioned during
Part I: Theoretical Background and Integration-Based Methods
 Large Vector Field Visualization: Theory and Practice Part I: Theoretical Background and Integration-Based Methods Christoph Garth Overview Foundations Time-Varying Vector Fields Numerical Integration
Visualization Computer Graphics I Lecture 20
 15-462 Computer Graphics I Lecture 20 Visualization Height Fields and Contours Scalar Fields Volume Rendering Vector Fields [Angel Ch. 12] April 15, 2003 Frank Pfenning Carnegie Mellon University http://www.cs.cmu.edu/~fp/courses/graphics/
Height Fields and Contours Scalar Fields Volume Rendering Vector Fields [Angel Ch. 12] April 23, 2002 Frank Pfenning Carnegie Mellon University
![Height Fields and Contours Scalar Fields Volume Rendering Vector Fields [Angel Ch. 12] April 23, 2002 Frank Pfenning Carnegie Mellon University](/thumbs/90/102611276.jpg "Height Fields and Contours Scalar Fields Volume Rendering Vector Fields [Angel Ch. 12] April 23, 2002 Frank Pfenning Carnegie Mellon University") 15-462 Computer Graphics I Lecture 21 Visualization Height Fields and Contours Scalar Fields Volume Rendering Vector Fields [Angel Ch. 12] April 23, 2002 Frank Pfenning Carnegie Mellon University http://www.cs.cmu.edu/~fp/courses/graphics/
15-462 Computer Graphics I Lecture 21 Visualization Height Fields and Contours Scalar Fields Volume Rendering Vector Fields [Angel Ch. 12] April 23, 2002 Frank Pfenning Carnegie Mellon University http://www.cs.cmu.edu/~fp/courses/graphics/
Contours & Implicit Modelling 4
 Brief Recap Contouring & Implicit Modelling Contouring Implicit Functions Visualisation Lecture 8 lecture 6 Marching Cubes lecture 3 visualisation of a Quadric toby.breckon@ed.ac.uk Computer Vision Lab.
AMCS / CS 247 Scientific Visualization Lecture 4: Data Representation, Pt. 1. Markus Hadwiger, KAUST
 AMCS / CS 247 Scientific Visualization Lecture 4: Data Representation, Pt. 1 Markus Hadwiger, KAUST Reading Assignment #2 (until Sep 1) Read (required): Data Visualization book, finish Chapter 2 Data Visualization
13.472J/1.128J/2.158J/16.940J COMPUTATIONAL GEOMETRY
 13.472J/1.128J/2.158J/16.940J COMPUTATIONAL GEOMETRY Lecture 23 Dr. W. Cho Prof. N. M. Patrikalakis Copyright c 2003 Massachusetts Institute of Technology Contents 23 F.E. and B.E. Meshing Algorithms 2
Visualization. Images are used to aid in understanding of data. Height Fields and Contours Scalar Fields Volume Rendering Vector Fields [chapter 26]
![Visualization. Images are used to aid in understanding of data. Height Fields and Contours Scalar Fields Volume Rendering Vector Fields [chapter 26]](/thumbs/74/70771954.jpg "Visualization. Images are used to aid in understanding of data. Height Fields and Contours Scalar Fields Volume Rendering Vector Fields [chapter 26]") Visualization Images are used to aid in understanding of data Height Fields and Contours Scalar Fields Volume Rendering Vector Fields [chapter 26] Tumor SCI, Utah Scientific Visualization Visualize large
Visualization Images are used to aid in understanding of data Height Fields and Contours Scalar Fields Volume Rendering Vector Fields [chapter 26] Tumor SCI, Utah Scientific Visualization Visualize large
Scalar Data. Alark Joshi
 Scalar Data Alark Joshi Announcements Pick two papers to present Email me your top 3/4 choices. FIFO allotment Contact your clients Blog summaries: http://cs.boisestate.edu/~alark/cs564/participants.html
Contours & Implicit Modelling 1
 Contouring & Implicit Modelling Visualisation Lecture 8 Institute for Perception, Action & Behaviour School of Informatics Contours & Implicit Modelling 1 Brief Recap Contouring Implicit Functions lecture
Visualization Toolkit(VTK) Atul Kumar MD MMST PhD IRCAD-Taiwan
 Atul Kumar MD MMST PhD IRCAD-Taiwan") Visualization Toolkit(VTK) Atul Kumar MD MMST PhD IRCAD-Taiwan Visualization What is visualization?: Informally, it is the transformation of data or information into pictures.(scientific, Data, Information)
Visualization Toolkit(VTK) Atul Kumar MD MMST PhD IRCAD-Taiwan Visualization What is visualization?: Informally, it is the transformation of data or information into pictures.(scientific, Data, Information)
Introduction to Visualization on Stampede
 Introduction to Visualization on Stampede Aaron Birkland Cornell CAC With contributions from TACC visualization training materials Parallel Computing on Stampede June 11, 2013 From data to Insight Data
Isosurface Rendering. CSC 7443: Scientific Information Visualization
 Isosurface Rendering What is Isosurfacing? An isosurface is the 3D surface representing the locations of a constant scalar value within a volume A surface with the same scalar field value Isosurfaces form
Geometric Representations. Stelian Coros
 Geometric Representations Stelian Coros Geometric Representations Languages for describing shape Boundary representations Polygonal meshes Subdivision surfaces Implicit surfaces Volumetric models Parametric
Lecture overview. Visualisatie BMT. Fundamental algorithms. Visualization pipeline. Structural classification - 1. Structural classification - 2
 Visualisatie BMT Fundamental algorithms Arjan Kok a.j.f.kok@tue.nl Lecture overview Classification of algorithms Scalar algorithms Vector algorithms Tensor algorithms Modeling algorithms 1 2 Visualization
Introduction to scientific visualization with ParaView
 Introduction to scientific visualization with ParaView Paul Melis SURFsara Visualization group paul.melis@surfsara.nl (some slides courtesy of Robert Belleman, UvA) Outline Introduction, pipeline and data
HPC Computer Aided CINECA
 HPC Computer Aided Engineering @ CINECA Raffaele Ponzini Ph.D. CINECA SuperComputing Applications and Innovation Department SCAI 16-18 June 2014 Segrate (MI), Italy Outline Open-source CAD and Meshing
3 Data Representation. Data Representation. Department of Computer Science and Engineering 3-1
 Data Representation 3-1 Overview This chapter will introduce you to data representations used for Scientific Visualization. We will discuss different grid structures and ways to represent data using these
Contouring and Isosurfaces. Ronald Peikert SciVis Contouring 2-1
 Contouring and Isosurfaces Ronald Peikert SciVis 2007 - Contouring 2-1 What are contours? Set of points where the scalar field s has a given value c: Examples in 2D: height contours on maps isobars on
0. Introduction: What is Computer Graphics? 1. Basics of scan conversion (line drawing) 2. Representing 2D curves
 2. Representing 2D curves") CSC 418/2504: Computer Graphics Course web site (includes course information sheet): http://www.dgp.toronto.edu/~elf Instructor: Eugene Fiume Office: BA 5266 Phone: 416 978 5472 (not a reliable way) Email:
CSC 418/2504: Computer Graphics Course web site (includes course information sheet): http://www.dgp.toronto.edu/~elf Instructor: Eugene Fiume Office: BA 5266 Phone: 416 978 5472 (not a reliable way) Email:
Visualization Computer Graphics I Lecture 20
 15-462 Computer Graphics I Lecture 20 Visualization Height Fields and Contours Scalar Fields Volume Rendering Vector Fields [Angel Ch. 12] November 20, 2003 Doug James Carnegie Mellon University http://www.cs.cmu.edu/~djames/15-462/fall03
Processing 3D Surface Data
 Processing 3D Surface Data Computer Animation and Visualisation Lecture 12 Institute for Perception, Action & Behaviour School of Informatics 3D Surfaces 1 3D surface data... where from? Iso-surfacing
Scientific visualization concepts
 Scientific visualization concepts Luigi Calori Slides material from: Alex Telea, Groningen University: www.cs.rug.nl/svcg Kitware: www.kitware.com Sandia National Laboratories Argonne National Laboratory
CIS 467/602-01: Data Visualization
 CIS 467/60-01: Data Visualization Isosurfacing and Volume Rendering Dr. David Koop Fields and Grids Fields: values come from a continuous domain, infinitely many values - Sampled at certain positions to
Georgios Tziritas Computer Science Department
 New Video Coding standards MPEG-4, HEVC Georgios Tziritas Computer Science Department http://www.csd.uoc.gr/~tziritas 1 MPEG-4 : introduction Motion Picture Expert Group Publication 1998 (Intern. Standardization
Processing 3D Surface Data
 Processing 3D Surface Data Computer Animation and Visualisation Lecture 17 Institute for Perception, Action & Behaviour School of Informatics 3D Surfaces 1 3D surface data... where from? Iso-surfacing
Visualization with ParaView
 Visualization with Before we begin Make sure you have 3.10.1 installed so you can follow along in the lab section http://paraview.org/paraview/resources/software.html http://www.paraview.org/ Background
Scientific Visualization. CSC 7443: Scientific Information Visualization
 Scientific Visualization Scientific Datasets Gaining insight into scientific data by representing the data by computer graphics Scientific data sources Computation Real material simulation/modeling (e.g.,
Scientific Visualization An Introduction
 Scientific Visualization An Introduction Featuring Vetria L. Byrd, PhD Assistant Professor Research and Technology Development Conference Missouri S&T September 13, 2016 RTD 2016 Thank You! Missouri S&T
An Introduction to Flow Visualization (1) Christoph Garth
 Christoph Garth") An Introduction to Flow Visualization (1) Christoph Garth cgarth@ucdavis.edu Motivation What will I be talking about? Classical: Physical experiments to understand flow. 2 Motivation What will I be talking
An Introduction to Flow Visualization (1) Christoph Garth cgarth@ucdavis.edu Motivation What will I be talking about? Classical: Physical experiments to understand flow. 2 Motivation What will I be talking
Scalar Algorithms: Contouring
 Scalar Algorithms: Contouring Computer Animation and Visualisation Lecture tkomura@inf.ed.ac.uk Institute for Perception, Action & Behaviour School of Informatics Contouring Scaler Data Last Lecture...
Volume visualization. Volume visualization. Volume visualization methods. Sources of volume visualization. Sources of volume visualization
 Volume visualization Volume visualization Volumes are special cases of scalar data: regular 3D grids of scalars, typically interpreted as density values. Each data value is assumed to describe a cubic
Volume Visualization
 Volume Visualization Part 1 (out of 3) Overview: Volume Visualization Introduction to volume visualization On volume data Surface vs. volume rendering Overview: Techniques Simple methods Slicing, cuberille
CS354 Computer Graphics Surface Representation IV. Qixing Huang March 7th 2018
 CS354 Computer Graphics Surface Representation IV Qixing Huang March 7th 2018 Today s Topic Subdivision surfaces Implicit surface representation Subdivision Surfaces Building complex models We can extend
Scalar Visualization
 Scalar Visualization Visualizing scalar data Popular scalar visualization techniques Color mapping Contouring Height plots outline Recap of Chap 4: Visualization Pipeline 1. Data Importing 2. Data Filtering
Introduction to scientific visualization with ParaView
 Introduction to scientific visualization with ParaView Tijs de Kler SURFsara Visualization group Tijs.dekler@surfsara.nl (some slides courtesy of Robert Belleman, UvA) Outline Pipeline and data model (10
9. Three Dimensional Object Representations
 9. Three Dimensional Object Representations Methods: Polygon and Quadric surfaces: For simple Euclidean objects Spline surfaces and construction: For curved surfaces Procedural methods: Eg. Fractals, Particle
Indirect Volume Rendering
 Indirect Volume Rendering Visualization Torsten Möller Weiskopf/Machiraju/Möller Overview Contour tracing Marching cubes Marching tetrahedra Optimization octree-based range query Weiskopf/Machiraju/Möller
8. Tensor Field Visualization
 8. Tensor Field Visualization Tensor: extension of concept of scalar and vector Tensor data for a tensor of level k is given by t i1,i2,,ik (x 1,,x n ) Second-order tensor often represented by matrix Examples:
Resampling Scattered Data into a Regular Grid
 Resampling Scattered Data into a Regular Grid Mike Bailey mjb@cs.oregonstate.edu The Problem Oftentimes data points are located irregularly, that is, they are not in nice, neat rectilinear grids. This
Volume Visualization. Part 1 (out of 3) Volume Data. Where do the data come from? 3D Data Space How are volume data organized?
 Volume Data. Where do the data come from? 3D Data Space How are volume data organized?") Volume Data Volume Visualization Part 1 (out of 3) Where do the data come from? Medical Application Computed Tomographie (CT) Magnetic Resonance Imaging (MR) Materials testing Industrial-CT Simulation
Volume Data Volume Visualization Part 1 (out of 3) Where do the data come from? Medical Application Computed Tomographie (CT) Magnetic Resonance Imaging (MR) Materials testing Industrial-CT Simulation
CHAPTER 1 Graphics Systems and Models 3
 ?????? 1 CHAPTER 1 Graphics Systems and Models 3 1.1 Applications of Computer Graphics 4 1.1.1 Display of Information............. 4 1.1.2 Design.................... 5 1.1.3 Simulation and Animation...........
Data Visualization. What is the goal? A generalized environment for manipulation and visualization of multidimensional data
 Data Visualization NIH-NSF NSF BBSI: Simulation and Computer Visualization of Biological Systems at Multiple Scales June 2-4, 2 2004 Joel R. Stiles, MD, PhD What is the goal? A generalized environment
Level of Details in Computer Rendering
 Level of Details in Computer Rendering Ariel Shamir Overview 1. Photo realism vs. Non photo realism (NPR) 2. Objects representations 3. Level of details Photo Realism Vs. Non Pixar Demonstrations Sketching,
Application of Two Rendering Techniques in the Visualization of 3D Geospatial Data
 Available online at www.sciencedirect.com Procedia Environmental Sciences 12 (2012 ) 1432 1439 2011 International Conference on Environmental Science and Engineering (ICESE 2011) Application of Two Rendering
GiD v12 news. GiD Developer Team: Miguel Pasenau, Enrique Escolano, Jorge Suit Pérez, Abel Coll, Adrià Melendo and Anna Monros
 GiD v12 news GiD Developer Team: Miguel Pasenau, Enrique Escolano, Jorge Suit Pérez, Abel Coll, Adrià Melendo and Anna Monros New preferences window New preferences window: Tree to organize the different
Scalar Field Visualization. Some slices used by Prof. Mike Bailey
 Scalar Field Visualization Some slices used by Prof. Mike Bailey Scalar Fields The approximation of certain scalar function in space f(x,y,z). Most of time, they come in as some scalar values defined on
On a nested refinement of anisotropic tetrahedral grids under Hessian metrics
 On a nested refinement of anisotropic tetrahedral grids under Hessian metrics Shangyou Zhang Abstract Anisotropic grids, having drastically different grid sizes in different directions, are efficient and
Modeling 3D Objects: Part 2
 Modeling 3D Objects: Part 2 Patches, NURBS, Solids Modeling, Spatial Subdivisioning, and Implicit Functions 3D Computer Graphics by Alan Watt Third Edition, Pearson Education Limited, 2000 General Modeling
Introduction to Scientific Visualization
 Introduction to Scientific Visualization Aaron Birkland Cornell Center for Advanced Computing Data Analysis on Ranger January 2012 A lab-intensive workshop Start off with basic concepts Data, transformations,
Subdivision Surfaces
 Subdivision Surfaces 1 Geometric Modeling Sometimes need more than polygon meshes Smooth surfaces Traditional geometric modeling used NURBS Non uniform rational B-Spline Demo 2 Problems with NURBS A single
Implicit Surfaces & Solid Representations COS 426
 Implicit Surfaces & Solid Representations COS 426 3D Object Representations Desirable properties of an object representation Easy to acquire Accurate Concise Intuitive editing Efficient editing Efficient
Using VTK and the OpenGL Graphics Libraries on HPCx
 Using VTK and the OpenGL Graphics Libraries on HPCx Jeremy Nowell EPCC The University of Edinburgh Edinburgh EH9 3JZ Scotland, UK April 29, 2005 Abstract Some of the graphics libraries and visualisation
CIS 467/602-01: Data Visualization
 CIS 467/602-01: Data Visualization Vector Field Visualization Dr. David Koop Fields Tables Networks & Trees Fields Geometry Clusters, Sets, Lists Items Items (nodes) Grids Items Items Attributes Links
Shape modeling Modeling technique Shape representation! 3D Graphics Modeling Techniques
 D Graphics http://chamilo2.grenet.fr/inp/courses/ensimag4mmgd6/ Shape Modeling technique Shape representation! Part : Basic techniques. Projective rendering pipeline 2. Procedural Modeling techniques Shape
Introduction to 3D Scientific Visualization. Training in Visualization for PRACE Summer of HPC 2013 Leon Kos, University of Ljubljana, Slovenia
 Introduction to 3D Scientific Visualization Training in Visualization for PRACE Summer of HPC 2013 Leon Kos, University of Ljubljana, Slovenia Motto Few correctly put words is worth hundreds of images.
Flow Visualization with Integral Surfaces
 Flow Visualization with Integral Surfaces Visual and Interactive Computing Group Department of Computer Science Swansea University R.S.Laramee@swansea.ac.uk 1 1 Overview Flow Visualization with Integral
3D Representation and Solid Modeling
 MCS 585/480 Computer Graphics I 3D Representation and Solid Modeling Week 8, Lecture 16 William Regli and Maxim Peysakhov Geometric and Intelligent Computing Laboratory Department of Computer Science Drexel
Scalar Field Visualization I
 Scalar Field Visualization I What is a Scalar Field? The approximation of certain scalar function in space f(x,y,z). Image source: blimpyb.com f What is a Scalar Field? The approximation of certain scalar
Data Visualization. What is the goal? A generalized environment for manipulation and visualization of multidimensional data
 Data Visualization NIH-NSF NSF BBSI: Simulation and Computer Visualization of Biological Systems at Multiple Scales Joel R. Stiles, MD, PhD What is real? Examples of some mind-bending optical illusions
CSC Computer Graphics
 // CSC. Computer Graphics Lecture Kasun@dscs.sjp.ac.lk Department of Computer Science University of Sri Jayewardanepura Polygon Filling Scan-Line Polygon Fill Algorithm Span Flood-Fill Algorithm Inside-outside
Data analysis with ParaView CSMP Workshop 2009 Gillian Gruen
 Data analysis with ParaView 3.4.0 CSMP Workshop 2009 Gillian Gruen How to...... display a data set ( Contour, Glyph, Clip, Slice) be efficient in displaying similar data sets ( work with Lookmarks )...
DISCONTINUOUS FINITE ELEMENT VISUALIZATION
 1 1 8th International Symposium on Flow Visualisation (1998) DISCONTINUOUS FINITE ELEMENT VISUALIZATION A. O. Leone P. Marzano E. Gobbetti R. Scateni S. Pedinotti Keywords: visualization, high-order finite
Volume Illumination and Segmentation
 Volume Illumination and Segmentation Computer Animation and Visualisation Lecture 13 Institute for Perception, Action & Behaviour School of Informatics Overview Volume illumination Segmentation Volume
Volume Illumination, Contouring
 Volume Illumination, Contouring Computer Animation and Visualisation Lecture 0 tkomura@inf.ed.ac.uk Institute for Perception, Action & Behaviour School of Informatics Contouring Scaler Data Overview -
Scalar Field Visualization I
 Scalar Field Visualization I What is a Scalar Field? The approximation of certain scalar function in space f(x,y,z). Image source: blimpyb.com f What is a Scalar Field? The approximation of certain scalar
Meshing of flow and heat transfer problems
 Meshing of flow and heat transfer problems Luyao Zou a, Zhe Li b, Qiqi Fu c and Lujie Sun d School of, Shandong University of science and technology, Shandong 266590, China. a zouluyaoxf@163.com, b 1214164853@qq.com,
Alaska Mathematics Standards Vocabulary Word List Grade 7
 1 estimate proportion proportional relationship rate ratio rational coefficient rational number scale Ratios and Proportional Relationships To find a number close to an exact amount; an estimate tells
Physically-Based Modeling and Animation. University of Missouri at Columbia
 Overview of Geometric Modeling Overview 3D Shape Primitives: Points Vertices. Curves Lines, polylines, curves. Surfaces Triangle meshes, splines, subdivision surfaces, implicit surfaces, particles. Solids
Meshless Modeling, Animating, and Simulating Point-Based Geometry
 Meshless Modeling, Animating, and Simulating Point-Based Geometry Xiaohu Guo SUNY @ Stony Brook Email: xguo@cs.sunysb.edu http://www.cs.sunysb.edu/~xguo Graphics Primitives - Points The emergence of points
Scalable and Distributed Visualization using ParaView
 Scalable and Distributed Visualization using ParaView Eric A. Wernert, Ph.D. Senior Manager & Scientist, Advanced Visualization Lab Pervasive Technology Institute, Indiana University Big Data for Science
SEOUL NATIONAL UNIVERSITY
 Fashion Technology 5. 3D Garment CAD-1 Sungmin Kim SEOUL NATIONAL UNIVERSITY Overview Design Process Concept Design Scalable vector graphics Feature-based design Pattern Design 2D Parametric design 3D
Structured Grid Generation for Turbo Machinery Applications using Topology Templates
 Structured Grid Generation for Turbo Machinery Applications using Topology Templates January 13th 2011 Martin Spel martin.spel@rtech.fr page 1 Agenda: R.Tech activities Grid Generation Techniques Structured
Outline. Reconstruction of 3D Meshes from Point Clouds. Motivation. Problem Statement. Applications. Challenges
 Reconstruction of 3D Meshes from Point Clouds Ming Zhang Patrick Min cs598b, Geometric Modeling for Computer Graphics Feb. 17, 2000 Outline - problem statement - motivation - applications - challenges
Volume Illumination & Vector Field Visualisation
 Volume Illumination & Vector Field Visualisation Visualisation Lecture 11 Institute for Perception, Action & Behaviour School of Informatics Volume Illumination & Vector Vis. 1 Previously : Volume Rendering
Graphics for VEs. Ruth Aylett
 Graphics for VEs Ruth Aylett Overview VE Software Graphics for VEs The graphics pipeline Projections Lighting Shading Runtime VR systems Two major parts: initialisation and update loop. Initialisation
Vector Field Visualization: Introduction
 Vector Field Visualization: Introduction What is a Vector Field? Why It is Important? Vector Fields in Engineering and Science Automotive design [Chen et al. TVCG07,TVCG08] Weather study [Bhatia and Chen
Overview and Introduction to Scientific Visualization. Texas Advanced Computing Center The University of Texas at Austin
 Overview and Introduction to Scientific Visualization Texas Advanced Computing Center The University of Texas at Austin Scientific Visualization The purpose of computing is insight not numbers. -- R. W.
Computer Graphics 1. Chapter 2 (May 19th, 2011, 2-4pm): 3D Modeling. LMU München Medieninformatik Andreas Butz Computergraphik 1 SS2011
: 3D Modeling. LMU München Medieninformatik Andreas Butz Computergraphik 1 SS2011") Computer Graphics 1 Chapter 2 (May 19th, 2011, 2-4pm): 3D Modeling 1 The 3D rendering pipeline (our version for this class) 3D models in model coordinates 3D models in world coordinates 2D Polygons in
Computer Graphics 1 Chapter 2 (May 19th, 2011, 2-4pm): 3D Modeling 1 The 3D rendering pipeline (our version for this class) 3D models in model coordinates 3D models in world coordinates 2D Polygons in
Geometric Modeling in Graphics
 Geometric Modeling in Graphics Part 10: Surface reconstruction Martin Samuelčík www.sccg.sk/~samuelcik samuelcik@sccg.sk Curve, surface reconstruction Finding compact connected orientable 2-manifold surface
Who has worked on a voxel engine before? Who wants to? My goal is to give the talk I wish I would have had before I started on our procedural engine.
 1 Who has worked on a voxel engine before? Who wants to? My goal is to give the talk I wish I would have had before I started on our procedural engine. Three parts to this talk. A lot of content, so I
GEOMETRY MODELING & GRID GENERATION
 GEOMETRY MODELING & GRID GENERATION Dr.D.Prakash Senior Assistant Professor School of Mechanical Engineering SASTRA University, Thanjavur OBJECTIVE The objectives of this discussion are to relate experiences
SCIENTIFIC VISUALIZATION ON GPU CLUSTERS PETER MESSMER, NVIDIA
 SCIENTIFIC VISUALIZATION ON GPU CLUSTERS PETER MESSMER, NVIDIA Visualization Rendering Visualization Isosurfaces, Isovolumes Field Operators (Gradient, Curl,.. ) Coordinate transformations Feature extraction
Images from 3D Creative Magazine. 3D Modelling Systems
 Images from 3D Creative Magazine 3D Modelling Systems Contents Reference & Accuracy 3D Primitives Transforms Move (Translate) Rotate Scale Mirror Align 3D Booleans Deforms Bend Taper Skew Twist Squash
3D Modeling techniques
 3D Modeling techniques 0. Reconstruction From real data (not covered) 1. Procedural modeling Automatic modeling of a self-similar objects or scenes 2. Interactive modeling Provide tools to computer artists
Subdivision Surfaces
 Subdivision Surfaces 1 Geometric Modeling Sometimes need more than polygon meshes Smooth surfaces Traditional geometric modeling used NURBS Non uniform rational B-Spline Demo 2 Problems with NURBS A single
Overview of 3D Object Representations
 Overview of 3D Object Representations Thomas Funkhouser Princeton University C0S 426, Fall 2000 Course Syllabus I. Image processing II. Rendering III. Modeling IV. Animation Image Processing (Rusty Coleman,
Overview of 3D Object Representations
 Overview of 3D Object Representations Thomas Funkhouser Princeton University C0S 597D, Fall 2003 3D Object Representations What makes a good 3D object representation? Stanford and Hearn & Baker 1 3D Object