Vertical and Horizontal Translations
|
|
|
- Tamsyn Greer
- 6 years ago
- Views:
Transcription
1 SECTION 4.3 Vertical and Horizontal Translations Copyright Cengage Learning. All rights reserved.
2 Learning Objectives Find the vertical translation of a sine or cosine function. Find the horizontal translation of a sine or cosine function. Identify the phase for a sine or cosine function. Graph a sine or cosine function having a horizontal and vertical translation.
3 Vertical Translations In general, the graph of y = f(x) + k is the graph of y = f(x) translated k units vertically. If k is a positive number, the translation is up. If k is a negative number, the translation is down.
4 Example 1 Sketch the graph of and

5 Example 2: Sketch the graph of
6 Example 3: Sketch the graph of
7 Vertical Translations
8 Horizontal Translations If we add a term to the argument of the function, the graph will be translated in a horizontal direction instead of a vertical direction as demonstrated in the next example.

9 Example 4 Graph Solution: Because we have not graphed an equation of this form before, it is a good idea to begin by making a table (Table below).
10 Example 4 Solution In this case, multiples of /2 will be the most convenient replacements for x in the table. Also, if we start with x = /2, our first value of y will be 0. Graphing these points and then drawing the sine curve that connects them gives us the graph of, as shown in Figure below.
11 It seems that the graph of is shifted /2 units to the left of the graph of. We say the graph of has a horizontal translation, or horizontal shift, of /2, where the negative sign indicates the shift is to the left (in the negative direction).
12 We can see why the graph was shifted to the left by looking at how the extra term affects a basic cycle of the sine function. We know that the sine function completes one cycle when the input value, or argument, varies between 0 and 2. One cycle:
13 Notice that a cycle will now begin at instead of at zero, and will end at 3 /2 instead of 2, which agrees with the graph in Figure below.

14 Horizontal Translations Next we look at an example that involves a combination of a period change and a horizontal shift.
15 Example 5 Graph Solution: The amplitude is 4. There is no vertical translation because no number has been added to or subtracted from the cosine function. We determine the period and horizontal translation from a basic cycle.

16 One Cycle: A cycle will begin at x = 3 /4, so the horizontal shift is 3 /4. To find the period, we can subtract the left and right endpoints of the cycle
17 or, equivalently, divide 2 by B = 2 Dividing the period by 4 gives us /4. To mark the x-axis, we begin at x = 3 /4 and add increments of /4 as follows:
18 We draw a frame and then sketch the graph of one complete cycle as shown in Figure below. Because the original problem asked for the graph on the interval, we extend the graph to the right by adding the first quarter of a second cycle.
19 On the left, we add the last three quarters of an additional cycle to reach 0. The final graph is shown in Figure 8.
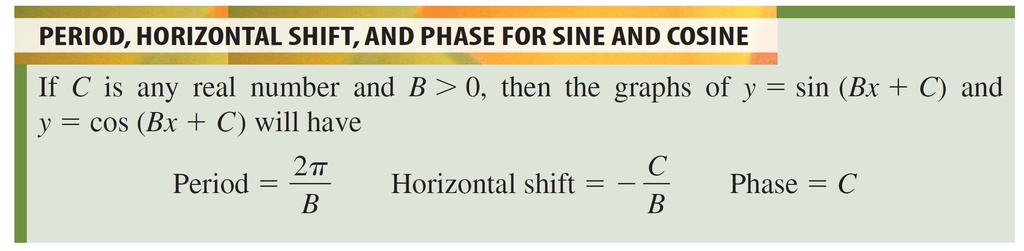
20 Horizontal Translations In general, for or to complete one cycle, the quantity Bx + C must vary from 0 to 2. Therefore, assuming B > 0, if The horizontal shift will be the left end point of the cycle, or C/B. If you find the difference between the end points, you will see that the period is 2 /B as before. The constant C in or is called the phase.
21 Phase is important in situations, such as when working with alternating currents, where two sinusoidal curves are being compared to one another. If x represents time, then the phase is the fraction of a standard period of 2 that a point on the graph of lags or leads a corresponding point on the graph of
22 Horizontal Translations

23 We summarize all the information we have covered about the graphs of the sine and cosine functions.
24 Example 6 Graph one complete cycle of Solution: First, we rewrite the function by factoring out the coefficient of.
25 Example 6 Solution In this case, the values are A = 5, B =, h = 1/4, and k = 3. This gives us
26 To verify the period and horizontal shift, and to help sketch the graph, we examine one cycle. One cycle:
27 Dividing the period by 4 gives, so we will mark the x-axis in increments of starting with. Notice that our frame for the cycle (Figure below) has been shifted upward 3 units, and we have plotted the key points to account for the x-axis reflection.
28 The graph is shown in Figure below.
Lesson 5.2: Transformations of Sinusoidal Functions (Sine and Cosine)
") Lesson 5.2: Transformations of Sinusoidal Functions (Sine and Cosine) Reflections Horizontal Translation (c) Vertical Translation (d) Remember: vertical stretch horizontal stretch 1 Part A: Reflections
Lesson 5.2: Transformations of Sinusoidal Functions (Sine and Cosine) Reflections Horizontal Translation (c) Vertical Translation (d) Remember: vertical stretch horizontal stretch 1 Part A: Reflections
Module 4 Graphs of the Circular Functions
 MAC 1114 Module 4 Graphs of the Circular Functions Learning Objectives Upon completing this module, you should be able to: 1. Recognize periodic functions. 2. Determine the amplitude and period, when given
Section 7.6 Graphs of the Sine and Cosine Functions
 Section 7.6 Graphs of the Sine and Cosine Functions We are going to learn how to graph the sine and cosine functions on the xy-plane. Just like with any other function, it is easy to do by plotting points.
Polynomial and Rational Functions. Copyright Cengage Learning. All rights reserved.
 2 Polynomial and Rational Functions Copyright Cengage Learning. All rights reserved. 2.1 Quadratic Functions Copyright Cengage Learning. All rights reserved. What You Should Learn Analyze graphs of quadratic
Section Graphs of the Sine and Cosine Functions
 Section 5. - Graphs of the Sine and Cosine Functions In this section, we will graph the basic sine function and the basic cosine function and then graph other sine and cosine functions using transformations.
Sketching graphs of polynomials
 Sketching graphs of polynomials We want to draw the graphs of polynomial functions y = f(x). The degree of a polynomial in one variable x is the highest power of x that remains after terms have been collected.
Notice there are vertical asymptotes whenever y = sin x = 0 (such as x = 0).
.") 1 of 7 10/1/2004 6.4 GRAPHS OF THE OTHER CIRCULAR 6.4 GRAPHS OF THE OTHER CIRCULAR Graphs of the Cosecant and Secant Functions Graphs of the Tangent and Cotangent Functions Addition of Ordinates Graphs
1 of 7 10/1/2004 6.4 GRAPHS OF THE OTHER CIRCULAR 6.4 GRAPHS OF THE OTHER CIRCULAR Graphs of the Cosecant and Secant Functions Graphs of the Tangent and Cotangent Functions Addition of Ordinates Graphs
Graphing Techniques and Transformations. Learning Objectives. Remarks
 Graphing Techniques and Transformations Learning Objectives 1. Graph functions using vertical and horizontal shifts 2. Graph functions using compressions and stretches. Graph functions using reflections
Graphs of the Circular Functions. Copyright 2017, 2013, 2009 Pearson Education, Inc.
 4 Graphs of the Circular Functions Copyright 2017, 2013, 2009 Pearson Education, Inc. 1 4.3 Graphs of the Tangent and Cotangent Functions Graph of the Tangent Function Graph of the Cotangent Function Techniques
The x-intercept can be found by setting y = 0 and solving for x: 16 3, 0
 y=-3/4x+4 and y=2 x I need to graph the functions so I can clearly describe the graphs Specifically mention any key points on the graphs, including intercepts, vertex, or start/end points. What is the
Lesson 5.2: Transformations of Sinusoidal Functions (Sine and Cosine)
") Lesson 5.2: Transformations of Sinusoidal Functions (Sine and Cosine) Reflections Horizontal Translation (c) Vertical Translation (d) Remember: vertical stretch horizontal stretch 1 Part A: Reflections
Lesson 5.2: Transformations of Sinusoidal Functions (Sine and Cosine) Reflections Horizontal Translation (c) Vertical Translation (d) Remember: vertical stretch horizontal stretch 1 Part A: Reflections
5.1 Introduction to the Graphs of Polynomials
 Math 3201 5.1 Introduction to the Graphs of Polynomials In Math 1201/2201, we examined three types of polynomial functions: Constant Function - horizontal line such as y = 2 Linear Function - sloped line,
Check In before class starts:
 Name: Date: Lesson 5-3: Graphing Trigonometric Functions Learning Goal: How do I use the critical values of the Sine and Cosine curve to graph vertical shift and vertical stretch? Check In before class
Graphs of Increasing Exponential Functions
 Section 5 2A: Graphs of Increasing Exponential Functions We want to determine what the graph of an exponential function y = a x looks like for all values of a > We will select a value of a > and examine
Graphs of Increasing Exponential Functions
 Section 5 2A: Graphs of Increasing Exponential Functions We want to determine what the graph of an exponential function y = a x looks like for all values of a > We will select a value of a > and examine
Unit 4 Graphs of Trigonometric Functions - Classwork
 Unit Graphs of Trigonometric Functions - Classwork For each of the angles below, calculate the values of sin x and cos x ( decimal places) on the chart and graph the points on the graph below. x 0 o 30
Exploring Quadratic Graphs
 Exploring Quadratic Graphs The general quadratic function is y=ax 2 +bx+c It has one of two basic graphs shapes, as shown below: It is a symmetrical "U"-shape or "hump"-shape, depending on the sign of
Warm-Up Exercises. Find the x-intercept and y-intercept 1. 3x 5y = 15 ANSWER 5; y = 2x + 7 ANSWER ; 7
 Warm-Up Exercises Find the x-intercept and y-intercept 1. 3x 5y = 15 ANSWER 5; 3 2. y = 2x + 7 7 2 ANSWER ; 7 Chapter 1.1 Graph Quadratic Functions in Standard Form A quadratic function is a function that
Section 4.4: Parabolas
 Objective: Graph parabolas using the vertex, x-intercepts, and y-intercept. Just as the graph of a linear equation y mx b can be drawn, the graph of a quadratic equation y ax bx c can be drawn. The graph
9.1: GRAPHING QUADRATICS ALGEBRA 1
 9.1: GRAPHING QUADRATICS ALGEBRA 1 OBJECTIVES I will be able to graph quadratics: Given in Standard Form Given in Vertex Form Given in Intercept Form What does the graph of a quadratic look like? https://www.desmos.com/calculator
Section 18-1: Graphical Representation of Linear Equations and Functions
 Section 18-1: Graphical Representation of Linear Equations and Functions Prepare a table of solutions and locate the solutions on a coordinate system: f(x) = 2x 5 Learning Outcome 2 Write x + 3 = 5 as
GRAPHING WORKSHOP. A graph of an equation is an illustration of a set of points whose coordinates satisfy the equation.
 GRAPHING WORKSHOP A graph of an equation is an illustration of a set of points whose coordinates satisfy the equation. The figure below shows a straight line drawn through the three points (2, 3), (-3,-2),
4.6 GRAPHS OF OTHER TRIGONOMETRIC FUNCTIONS
 4.6 GRAPHS OF OTHER TRIGONOMETRIC FUNCTIONS Copyright Cengage Learning. All rights reserved. What You Should Learn Sketch the graphs of tangent functions. Sketch the graphs of cotangent functions. Sketch
Basic Graphs of the Sine and Cosine Functions
 Chapter 4: Graphs of the Circular Functions 1 TRIG-Fall 2011-Jordan Trigonometry, 9 th edition, Lial/Hornsby/Schneider, Pearson, 2009 Section 4.1 Graphs of the Sine and Cosine Functions Basic Graphs of
1.1 Functions. Cartesian Coordinate System
 1.1 Functions This section deals with the topic of functions, one of the most important topics in all of mathematics. Let s discuss the idea of the Cartesian coordinate system first. Cartesian Coordinate
1. GRAPHS OF THE SINE AND COSINE FUNCTIONS
 GRAPHS OF THE CIRCULAR FUNCTIONS 1. GRAPHS OF THE SINE AND COSINE FUNCTIONS PERIODIC FUNCTION A period function is a function f such that f ( x) f ( x np) for every real numer x in the domain of f every
Trigonometric Graphs Dr. Laura J. Pyzdrowski
 1 Names: About this Laboratory In this laboratory, we will examine trigonometric functions and their graphs. Upon completion of the lab, you should be able to quickly sketch such functions and determine
3. parallel: (b) and (c); perpendicular (a) and (b), (a) and (c)
 and (c); perpendicular (a) and (b), (a) and (c)") SECTION 1.1 1. Plot the points (0, 4), ( 2, 3), (1.5, 1), and ( 3, 0.5) in the Cartesian plane. 2. Simplify the expression 13 7 2. 3. Use the 3 lines whose equations are given. Which are parallel? Which
SECTION 1.1 1. Plot the points (0, 4), ( 2, 3), (1.5, 1), and ( 3, 0.5) in the Cartesian plane. 2. Simplify the expression 13 7 2. 3. Use the 3 lines whose equations are given. Which are parallel? Which
Translation of graphs (2) The exponential function and trigonometric function
 The exponential function and trigonometric function") Lesson 35 Translation of graphs (2) The exponential function and trigonometric function Learning Outcomes and Assessment Standards Learning Outcome 2: Functions and Algebra Assessment Standard Generate
Lesson 35 Translation of graphs (2) The exponential function and trigonometric function Learning Outcomes and Assessment Standards Learning Outcome 2: Functions and Algebra Assessment Standard Generate
Quadratic Functions CHAPTER. 1.1 Lots and Projectiles Introduction to Quadratic Functions p. 31
 CHAPTER Quadratic Functions Arches are used to support the weight of walls and ceilings in buildings. Arches were first used in architecture by the Mesopotamians over 4000 years ago. Later, the Romans
AP Calculus Summer Review Packet
 AP Calculus Summer Review Packet Name: Date began: Completed: **A Formula Sheet has been stapled to the back for your convenience!** Email anytime with questions: danna.seigle@henry.k1.ga.us Complex Fractions
CW High School. Advanced Math A. 1.1 I can make connections between the algebraic equation or description for a function, its name, and its graph.
 1. Functions and Math Models (10.00%) 1.1 I can make connections between the algebraic equation or description for a function, its name, and its graph. 4 Pro cient I can make connections between the algebraic
Section Graphs of the Sine and Cosine Functions
 Section 5. - Graphs of the Sine and Cosine Functions In this section, we will graph the basic sine function and the basic cosine function and then graph other sine and cosine functions using transformations.
Walt Whitman High School SUMMER REVIEW PACKET. For students entering AP CALCULUS BC
 Walt Whitman High School SUMMER REVIEW PACKET For students entering AP CALCULUS BC Name: 1. This packet is to be handed in to your Calculus teacher on the first day of the school year.. All work must be
UNIT 3 EXPRESSIONS AND EQUATIONS Lesson 3: Creating Quadratic Equations in Two or More Variables
 Guided Practice Example 1 Find the y-intercept and vertex of the function f(x) = 2x 2 + x + 3. Determine whether the vertex is a minimum or maximum point on the graph. 1. Determine the y-intercept. The
3.1 INTRODUCTION TO THE FAMILY OF QUADRATIC FUNCTIONS
 3.1 INTRODUCTION TO THE FAMILY OF QUADRATIC FUNCTIONS Finding the Zeros of a Quadratic Function Examples 1 and and more Find the zeros of f(x) = x x 6. Solution by Factoring f(x) = x x 6 = (x 3)(x + )
9.1 Linear Inequalities in Two Variables Date: 2. Decide whether to use a solid line or dotted line:
 9.1 Linear Inequalities in Two Variables Date: Key Ideas: Example Solve the inequality by graphing 3y 2x 6. steps 1. Rearrange the inequality so it s in mx ± b form. Don t forget to flip the inequality
FUNCTIONS AND MODELS
 1 FUNCTIONS AND MODELS FUNCTIONS AND MODELS 1.3 New Functions from Old Functions In this section, we will learn: How to obtain new functions from old functions and how to combine pairs of functions. NEW
Example 1: Give the coordinates of the points on the graph.
 Ordered Pairs Often, to get an idea of the behavior of an equation, we will make a picture that represents the solutions to the equation. A graph gives us that picture. The rectangular coordinate plane,
Functions. Copyright Cengage Learning. All rights reserved.
 Functions Copyright Cengage Learning. All rights reserved. 2.2 Graphs Of Functions Copyright Cengage Learning. All rights reserved. Objectives Graphing Functions by Plotting Points Graphing Functions with
8.2 Graph and Write Equations of Parabolas
 8.2 Graph and Write Equations of Parabolas Where is the focus and directrix compared to the vertex? How do you know what direction a parabola opens? How do you write the equation of a parabola given the
MATH STUDENT BOOK. 12th Grade Unit 4
 MATH STUDENT BOOK th Grade Unit Unit GRAPHING AND INVERSE FUNCTIONS MATH 0 GRAPHING AND INVERSE FUNCTIONS INTRODUCTION. GRAPHING 5 GRAPHING AND AMPLITUDE 5 PERIOD AND FREQUENCY VERTICAL AND HORIZONTAL
Practice Test (page 391) 1. For each line, count squares on the grid to determine the rise and the run. Use slope = rise
 1. For each line, count squares on the grid to determine the rise and the run. Use slope = rise") Practice Test (page 91) 1. For each line, count squares on the grid to determine the rise and the. Use slope = rise 4 Slope of AB =, or 6 Slope of CD = 6 9, or Slope of EF = 6, or 4 Slope of GH = 6 4,
Practice Test (page 91) 1. For each line, count squares on the grid to determine the rise and the. Use slope = rise 4 Slope of AB =, or 6 Slope of CD = 6 9, or Slope of EF = 6, or 4 Slope of GH = 6 4,
A function: A mathematical relationship between two variables (x and y), where every input value (usually x) has one output value (usually y)
, where every input value (usually x) has one output value (usually y)") SESSION 9: FUNCTIONS KEY CONCEPTS: Definitions & Terminology Graphs of Functions - Straight line - Parabola - Hyperbola - Exponential Sketching graphs Finding Equations Combinations of graphs TERMINOLOGY
SESSION 9: FUNCTIONS KEY CONCEPTS: Definitions & Terminology Graphs of Functions - Straight line - Parabola - Hyperbola - Exponential Sketching graphs Finding Equations Combinations of graphs TERMINOLOGY
Applications of Integration. Copyright Cengage Learning. All rights reserved.
 Applications of Integration Copyright Cengage Learning. All rights reserved. Area of a Region Between Two Curves Copyright Cengage Learning. All rights reserved. Objectives Find the area of a region between
slope rise run Definition of Slope
 The Slope of a Line Mathematicians have developed a useful measure of the steepness of a line, called the slope of the line. Slope compares the vertical change (the rise) to the horizontal change (the
MAT 115: Precalculus Mathematics Constructing Graphs of Trigonometric Functions Involving Transformations by Hand. Overview
 MAT 115: Precalculus Mathematics Constructing Graphs of Trigonometric Functions Involving Transformations by Hand Overview Below are the guidelines for constructing a graph of a trigonometric function
Contents 10. Graphs of Trigonometric Functions
 Contents 10. Graphs of Trigonometric Functions 2 10.2 Sine and Cosine Curves: Horizontal and Vertical Displacement...... 2 Example 10.15............................... 2 10.3 Composite Sine and Cosine
Quadratic Functions. *These are all examples of polynomial functions.
 Look at: f(x) = 4x-7 f(x) = 3 f(x) = x 2 + 4 Quadratic Functions *These are all examples of polynomial functions. Definition: Let n be a nonnegative integer and let a n, a n 1,..., a 2, a 1, a 0 be real
) 2 + (y 2. x 1. y c x2 = y
 2 + (y 2. x 1. y c x2 = y") Graphing Parabola Parabolas A parabola is a set of points P whose distance from a fixed point, called the focus, is equal to the perpendicular distance from P to a line, called the directrix. Since this
Graphing Parabola Parabolas A parabola is a set of points P whose distance from a fixed point, called the focus, is equal to the perpendicular distance from P to a line, called the directrix. Since this
This is called the horizontal displacement of also known as the phase shift.
 sin (x) GRAPHS OF TRIGONOMETRIC FUNCTIONS Definitions A function f is said to be periodic if there is a positive number p such that f(x + p) = f(x) for all values of x. The smallest positive number p for
Algebra II Trigonometric Functions
 Slide 1 / 162 Slide 2 / 162 Algebra II Trigonometric Functions 2015-12-17 www.njctl.org Slide 3 / 162 Trig Functions click on the topic to go to that section Radians & Degrees & Co-terminal angles Arc
Math.1330 Section 5.2 Graphs of the Sine and Cosine Functions
 Math.10 Section 5. Graphs of the Sine and Cosine Functions In this section, we will graph the basic sine function and the basic cosine function and then graph other sine and cosine functions using transformations.
Increasing/Decreasing Behavior
 Derivatives and the Shapes of Graphs In this section, we will specifically discuss the information that f (x) and f (x) give us about the graph of f(x); it turns out understanding the first and second
6B Quiz Review Learning Targets ,
 6B Quiz Review Learning Targets 5.10 6.3, 6.5-6.6 Key Facts Double transformations when more than one transformation is applied to a graph o You can still use our transformation rules to identify which
Algebra II. Slide 1 / 162. Slide 2 / 162. Slide 3 / 162. Trigonometric Functions. Trig Functions
 Slide 1 / 162 Algebra II Slide 2 / 162 Trigonometric Functions 2015-12-17 www.njctl.org Trig Functions click on the topic to go to that section Slide 3 / 162 Radians & Degrees & Co-terminal angles Arc
Albertson AP Calculus AB AP CALCULUS AB SUMMER PACKET DUE DATE: The beginning of class on the last class day of the first week of school.
 Albertson AP Calculus AB Name AP CALCULUS AB SUMMER PACKET 2017 DUE DATE: The beginning of class on the last class day of the first week of school. This assignment is to be done at you leisure during the
Section 5.4: Modeling with Circular Functions
 Section 5.4: Modeling with Circular Functions Circular Motion Example A ferris wheel with radius 25 feet is rotating at a rate of 3 revolutions per minute, When t = 0, a chair starts at its lowest point
Unit 7: Trigonometry Part 1
 100 Unit 7: Trigonometry Part 1 Right Triangle Trigonometry Hypotenuse a) Sine sin( α ) = d) Cosecant csc( α ) = α Adjacent Opposite b) Cosine cos( α ) = e) Secant sec( α ) = c) Tangent f) Cotangent tan(
Mastery. PRECALCULUS Student Learning Targets
 PRECALCULUS Student Learning Targets Big Idea: Sequences and Series 1. I can describe a sequence as a function where the domain is the set of natural numbers. Connections (Pictures, Vocabulary, Definitions,
6.4 Vertex Form of a Quadratic Function
 6.4 Vertex Form of a Quadratic Function Recall from 6.1 and 6.2: Standard Form The standard form of a quadratic is: f(x) = ax 2 + bx + c or y = ax 2 + bx + c where a, b, and c are real numbers and a 0.
Graphs of Exponential
 Graphs of Exponential Functions By: OpenStaxCollege As we discussed in the previous section, exponential functions are used for many realworld applications such as finance, forensics, computer science,
Math12 Pre-Calc Review - Trig
 Math1 Pre-Calc Review - Trig Multiple Choice Identify the choice that best completes the statement or answers the question. 1. Which of the following angles, in degrees, is coterminal with, but not equal
Graphs and transformations, Mixed Exercise 4
 Graphs and transformations, Mixed Exercise 4 a y = x (x ) 0 = x (x ) So x = 0 or x = The curve crosses the x-axis at (, 0) and touches it at (0, 0). y = x x = x( x) As a = is negative, the graph has a
Name Homework Packet Week #12
 1. All problems with answers or work are examples. Lesson 4.4 Complete the table for each given sequence then graph each sequence on the coordinate plane. Term Number (n) Value of Term ( ) 1 2 3 4 5 6
Unit 3, Lesson 3.1 Creating and Graphing Equations Using Standard Form
 Unit 3, Lesson 3.1 Creating and Graphing Equations Using Standard Form Imagine the path of a basketball as it leaves a player s hand and swooshes through the net. Or, imagine the path of an Olympic diver
1.8 Coordinate Geometry. Copyright Cengage Learning. All rights reserved.
 1.8 Coordinate Geometry Copyright Cengage Learning. All rights reserved. Objectives The Coordinate Plane The Distance and Midpoint Formulas Graphs of Equations in Two Variables Intercepts Circles Symmetry
Increasing/Decreasing Behavior
 Derivatives and the Shapes of Graphs In this section, we will specifically discuss the information that f (x) and f (x) give us about the graph of f(x); it turns out understanding the first and second
A lg e b ra II. Trig o n o m e tric F u n c tio
 1 A lg e b ra II Trig o n o m e tric F u n c tio 2015-12-17 www.njctl.org 2 Trig Functions click on the topic to go to that section Radians & Degrees & Co-terminal angles Arc Length & Area of a Sector
Functions. Edexcel GCE. Core Mathematics C3
 Edexcel GCE Core Mathematics C Functions Materials required for examination Mathematical Formulae (Green) Items included with question papers Nil Advice to Candidates You must ensure that your answers
Trigonometric Functions. Copyright Cengage Learning. All rights reserved.
 4 Trigonometric Functions Copyright Cengage Learning. All rights reserved. 4.7 Inverse Trigonometric Functions Copyright Cengage Learning. All rights reserved. What You Should Learn Evaluate and graph
Chapter 4. Trigonometric Functions. 4.6 Graphs of Other. Copyright 2014, 2010, 2007 Pearson Education, Inc.
 Chapter 4 Trigonometric Functions 4.6 Graphs of Other Trigonometric Functions Copyright 2014, 2010, 2007 Pearson Education, Inc. 1 Objectives: Understand the graph of y = tan x. Graph variations of y =
Chapter 5.4: Sinusoids
 Chapter 5.4: Sinusoids If we take our circular functions and unwrap them, we can begin to look at the graphs of each trig function s ratios as a function of the angle in radians. We will begin by looking
2.7 Graphing Tangent, Cotangent, Secant, and
 www.ck12.org Chapter 2. Graphing Trigonometric Functions 2.7 Graphing Tangent, Cotangent, Secant, and Cosecant Learning Objectives Apply transformations to the remaining four trigonometric functions. Identify
2-3 Graphing Rational Functions
 2-3 Graphing Rational Functions Factor What are the end behaviors of the Graph? Sketch a graph How to identify the intercepts, asymptotes and end behavior of a rational function. How to sketch the graph
Sec 4.1 Coordinates and Scatter Plots. Coordinate Plane: Formed by two real number lines that intersect at a right angle.
 Algebra I Chapter 4 Notes Name Sec 4.1 Coordinates and Scatter Plots Coordinate Plane: Formed by two real number lines that intersect at a right angle. X-axis: The horizontal axis Y-axis: The vertical
Section 1.2: Points and Lines
 Section 1.2: Points and Lines Objective: Graph points and lines using x and y coordinates. Often, to get an idea of the behavior of an equation we will make a picture that represents the solutions to the
F.BF.B.3: Graphing Polynomial Functions
 F.BF.B.3: Graphing Polynomial Functions 1 Given the graph of the line represented by the equation f(x) = 2x + b, if b is increased by 4 units, the graph of the new line would be shifted 4 units 1) right
Section 2.1 Graphs. The Coordinate Plane
 Section 2.1 Graphs The Coordinate Plane Just as points on a line can be identified with real numbers to form the coordinate line, points in a plane can be identified with ordered pairs of numbers to form
Unit 3 Trig II. 3.1 Trig and Periodic Functions
 Unit 3 Trig II AFM Mrs. Valentine Obj.: I will be able to use a unit circle to find values of sine, cosine, and tangent. I will be able to find the domain and range of sine and cosine. I will understand
Unit 13: Periodic Functions and Trig
 Date Period Unit 13: Periodic Functions and Trig Day Topic 0 Special Right Triangles and Periodic Function 1 Special Right Triangles Standard Position Coterminal Angles 2 Unit Circle Cosine & Sine (x,
Name: Date: Absolute Value Transformations
 Name: Date: Absolute Value Transformations Vocab: Absolute value is the measure of the distance awa from zero on a number line. Since absolute value is the measure of distance it can never be negative!
Transformations. What are the roles of a, k, d, and c in polynomial functions of the form y a[k(x d)] n c, where n?
![Transformations. What are the roles of a, k, d, and c in polynomial functions of the form y a[k(x d)] n c, where n?](/thumbs/95/125766084.jpg "Transformations. What are the roles of a, k, d, and c in polynomial functions of the form y a[k(x d)] n c, where n?") 1. Transformations In the architectural design of a new hotel, a pattern is to be carved in the exterior crown moulding. What power function forms the basis of the pattern? What transformations are applied
1. Transformations In the architectural design of a new hotel, a pattern is to be carved in the exterior crown moulding. What power function forms the basis of the pattern? What transformations are applied
4.3 Quadratic functions and their properties
 4.3 Quadratic functions and their properties A quadratic function is a function defined as f(x) = ax + x + c, a 0 Domain: the set of all real numers x-intercepts: Solutions of ax + x + c = 0 y-intercept:
MULTIPLE CHOICE. Choose the one alternative that best completes the statement or answers the question.
 Exam Name MULTIPLE CHOICE. Choose the one alternative that best completes the statement or answers the question. Convert the angle to decimal degrees and round to the nearest hundredth of a degree. 1)
You are not expected to transform y = tan(x) or solve problems that involve the tangent function.
 or solve problems that involve the tangent function.") In this unit, we will develop the graphs for y = sin(x), y = cos(x), and later y = tan(x), and identify the characteristic features of each. Transformations of y = sin(x) and y = cos(x) are performed and
In this unit, we will develop the graphs for y = sin(x), y = cos(x), and later y = tan(x), and identify the characteristic features of each. Transformations of y = sin(x) and y = cos(x) are performed and
Math 30-1 Sample Test Questions
 Math 30-1 Sample Test Questions Instructions: This sample test is designed to give the student some prior indication of what the course content for Math 30-1 is like It is to be used to help the student
Section 3.7 Notes. Rational Functions. is a rational function. The graph of every rational function is smooth (no sharp corners)
") Section.7 Notes Rational Functions Introduction Definition A rational function is fraction of two polynomials. For example, f(x) = x x + x 5 Properties of Rational Graphs is a rational function. The graph
Section.7 Notes Rational Functions Introduction Definition A rational function is fraction of two polynomials. For example, f(x) = x x + x 5 Properties of Rational Graphs is a rational function. The graph
MHF4U. Advanced Functions Grade 12 University Mitchell District High School. Unit 5 Trig Functions & Equations 5 Video Lessons
 MHF4U Advanced Functions Grade 12 University Mitchell District High School Unit 5 Trig Functions & Equations 5 Video Lessons Allow no more than 12 class days for this unit! This includes time for review
8.4 Graphs of Sine and Cosine Functions Additional Material to Assist in Graphing Trig Functions
 8.4 Graphs of Sine and Cosine Functions Additional Material to Assist in Graphing Trig Functions One of the things that will help a great deal in learning to graph the trig functions is an understanding
Core Mathematics 1 Transformations of Graphs
 Regent College Maths Department Core Mathematics 1 Transformations of Graphs Transformations of Graphs September 2011 C1 Note Knowledge of the effect of simple transformations on the graph of y f( x)
y 1 ) 2 Mathematically, we write {(x, y)/! y = 1 } is the graph of a parabola with 4c x2 focus F(0, C) and directrix with equation y = c.
 2 Mathematically, we write {(x, y)/! y = 1 } is the graph of a parabola with 4c x2 focus F(0, C) and directrix with equation y = c.") Ch. 10 Graphing Parabola Parabolas A parabola is a set of points P whose distance from a fixed point, called the focus, is equal to the perpendicular distance from P to a line, called the directrix. Since
Ch. 10 Graphing Parabola Parabolas A parabola is a set of points P whose distance from a fixed point, called the focus, is equal to the perpendicular distance from P to a line, called the directrix. Since
Today is the last day to register for CU Succeed account AND claim your account. Tuesday is the last day to register for my class
 Today is the last day to register for CU Succeed account AND claim your account. Tuesday is the last day to register for my class Back board says your name if you are on my roster. I need parent financial
PreCalculus Chapter 9 Practice Test Name:
 This ellipse has foci 0,, and therefore has a vertical major axis. The standard form for an ellipse with a vertical major axis is: 1 Note: graphs of conic sections for problems 1 to 1 were made with the
Section 5.3 Graphs of the Cosecant and Secant Functions 1
 Section 5.3 Graphs of the Cosecant, Secant, Tangent, and Cotangent Functions The Cosecant Graph RECALL: 1 csc x so where sin x 0, csc x has an asymptote. sin x To graph y Acsc( Bx C) D, first graph THE
Unit 1 Quadratic Functions
 Unit 1 Quadratic Functions This unit extends the study of quadratic functions to include in-depth analysis of general quadratic functions in both the standard form f ( x) = ax + bx + c and in the vertex
This is called the vertex form of the quadratic equation. To graph the equation
 Name Period Date: Topic: 7-5 Graphing ( ) Essential Question: What is the vertex of a parabola, and what is its axis of symmetry? Standard: F-IF.7a Objective: Graph linear and quadratic functions and show
Transformations with Quadratic Functions KEY
 Algebra Unit: 05 Lesson: 0 TRY THIS! Use a calculator to generate a table of values for the function y = ( x 3) + 4 y = ( x 3) x + y 4 Next, simplify the function by squaring, distributing, and collecting
1.) ( ) Step 1: Factor the numerator and the denominator. Find the domain. is in lowest terms.
 ( ) Step 1: Factor the numerator and the denominator. Find the domain. is in lowest terms.") GP3-HW11 College Algebra Sketch the graph of each rational function. 1.) Step 1: Factor the numerator and the denominator. Find the domain. { } Step 2: Rewrite in lowest terms. The rational function is
GP3-HW11 College Algebra Sketch the graph of each rational function. 1.) Step 1: Factor the numerator and the denominator. Find the domain. { } Step 2: Rewrite in lowest terms. The rational function is
Quadratic Functions In Standard Form In Factored Form In Vertex Form Transforming Graphs. Math Background
 Graphing In Standard Form In Factored Form In Vertex Form Transforming Graphs Math Background Previousl, ou Identified and graphed linear functions Applied transformations to parent functions Graphed quadratic