Making ArcGIS Work for You. Elizabeth Cook USDA-NRCS GIS Specialist Columbia, MO
|
|
|
- Evan Holt
- 6 years ago
- Views:
Transcription
1 Making ArcGIS Work for You Elizabeth Cook USDA-NRCS GIS Specialist Columbia, MO 1
2 Topics Using ArcMap beyond the Toolkit buttons GIS data formats Attributes and what you can do with them Calculating Acres Determining Map coordinates for locations Making and editing shapefiles; calculating acres Using the data on f:\geodata Data analysis (clip, intersect, buffer, dissolve) 2
3 Introductory Thoughts 1. You can use ArcMap and other ArcGIS components outside of Toolkit Quick access to photography, CLU, and other data When not planning or scheduling conservation practices that require reporting In many cases, ArcMap without Toolkit may be an easier and faster way to accomplish a task 3

4 To Open ArcMap without Checking out a customer in Toolkit Start>>All Programs>>ArcGIS>>ArcMap or ArcCatalog 4
5 2. Toolkit buttons in ArcMap shorten the steps of some GIS functions, but are limited in their application, for example, to specific data sets. Knowing the straight ArcMap way to accomplish these functions allows you to use them for other purposes. Examples: add data to a table, select a subset of a layer based on an attribute, spatially clip the extent of a layer NOTE: Toolkit toolbar buttons do not work if you open ArcMap without going through Toolkit 5
6 3. This is conceptual training, not step-bystep. ArcMap is a vast toolbox. We will see what some of the tools do, and then you can decide how they apply to your everyday tasks! 6
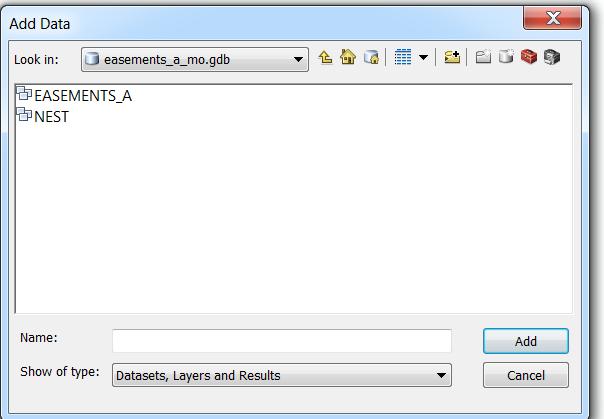
7 GIS Data Formats Shapefiles Are actually a collection of 3-7 files, even though you only see the.shp file listed in an ArcMap browse listing Must have a minimum of.shp,.shx and.dbf files for a shapefile to work Cannot double-click on a shapefile to open; must use Add Data in ArcMap Shapefiles can only contain vector spatial data of one type of geometry per file points, polylines (lines) or polygons 7
8 Raster datasets Data in a grid cell format with each cell being a square representing a certain area on the ground.sid raster is used for aerial imagery (NAIP = 1x1 meter cells); sid is a compression format to make imagery files smaller.tif raster (ex. DRG topographic maps with 2.47 m x 2.47 m cells) GRID raster (ArcGIS specific) are used for digital elevation models; GRIDs are folders rather than files 8
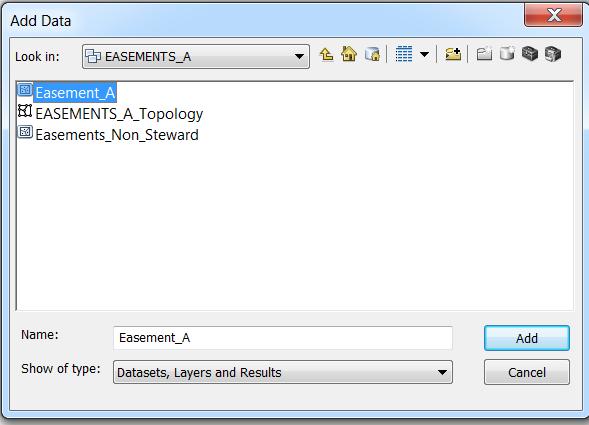
9 Geodatabases Newer data format than shapefiles and stand-alone raster files Three types - personal, file, and SDE Geodatabases can contain mixed types of data (vector point, line, and polygon; raster; external tables, etc.), stored in different feature classes Geodatabases are stored as a folder, ending with.gdb Easements data on f:\geodata are in a file geodatabase Toolkit uses the personal geodatabase format with some unique customizations for PLU and practice data 9

10 Windows Explorer ArcMap 10

11 GIS Servers We are changing from locally stored GIS data to data on centralized servers Still use the Add Data button in ArcMap to access these data, but go to GIS Servers to locate data stored at a web URL Example: NAIP on 11
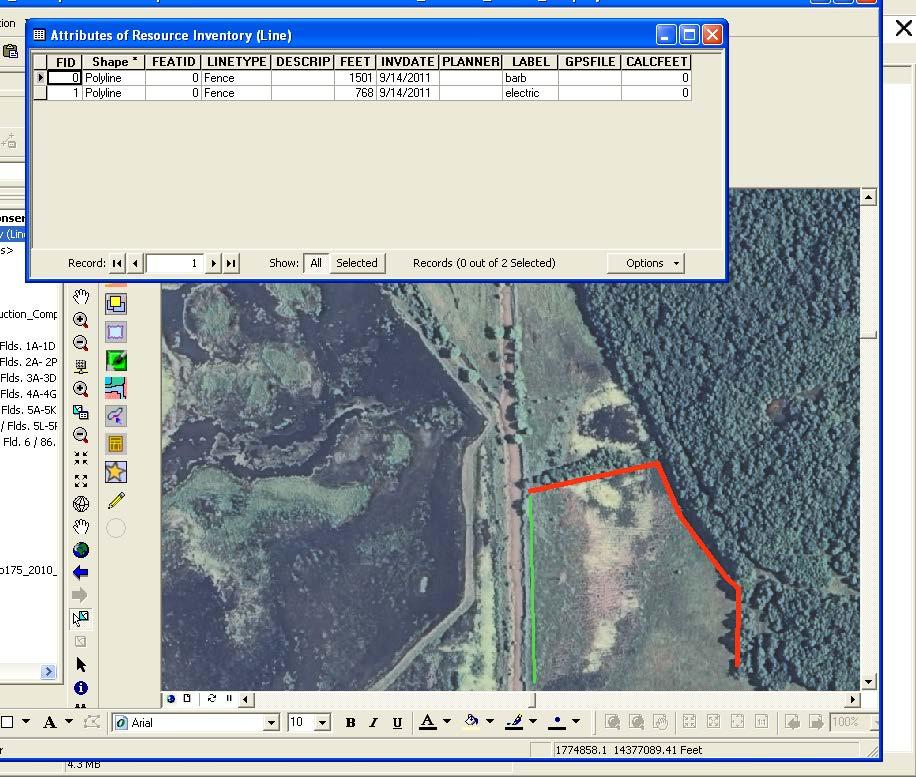
12 Anatomy of GIS Data Where - point, line, polygon or raster (grid cell) representing a feature on the ground; map feature Point representing a well, outlet, photo station Line representing a fence or terrace Polygon representing a field boundary, area of homogenous soils Raster cell representing a 1x1 meter area for which a value like elevation is known 12
13 Anatomy of GIS Data What information about the point, line, polygon or raster Photo station id, well type of a point Fence type such as barbed or electric of a line Map unit symbol for soils polygon Elevation of a raster This information is stored in an attribute table associated with the spatial data. The link between the spatial map feature and the attribute table is an essential element of GIS. 13
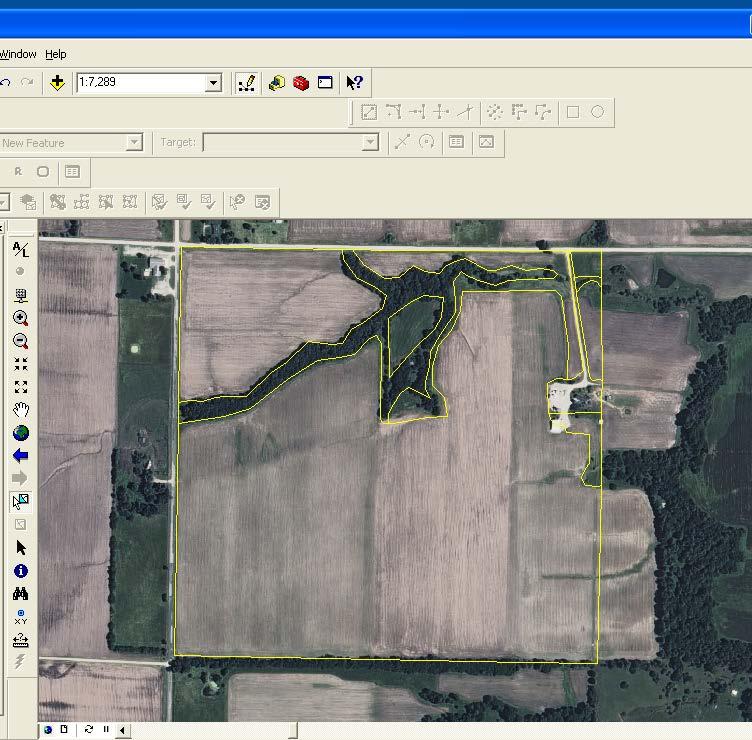
14 Raster aerial photography Polygons of Common Land Units 14

15 Right Mouse Click on CLU>>Open Attribute Table 15
 in the data set")
16 Attributes of the CLU polygons In most cases, there is one record or row in the table for each feature (point, line or polygon) in the data set 16
17 What can attributes do for you? 17

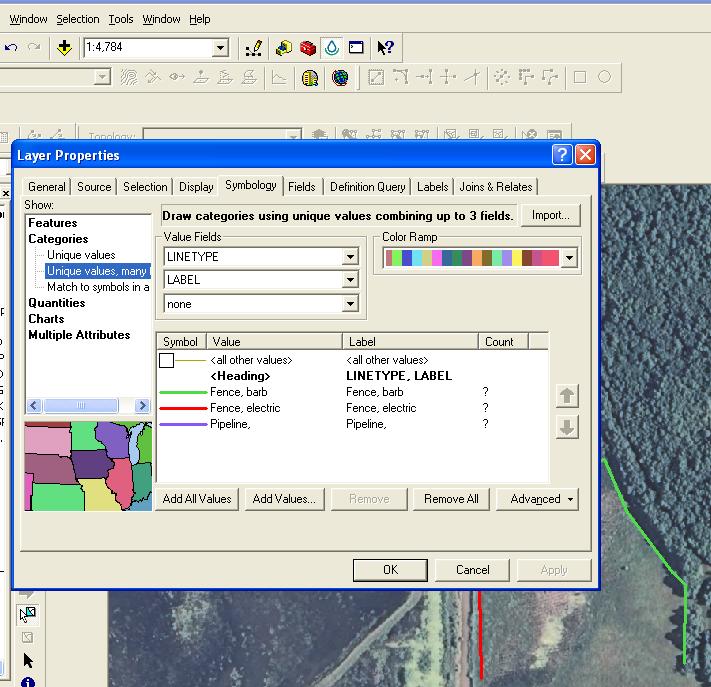
18 Right-mouse Click on data layer>>properties>>symbology Symbolizing Maps 18
19 19
20 20
21 Attributes provide information 21

22 Make a subset based on an attribute value Double-click Attribute field Single click Selection type Double-click from List or type below 22
23 What can you do with a selected subset? 23
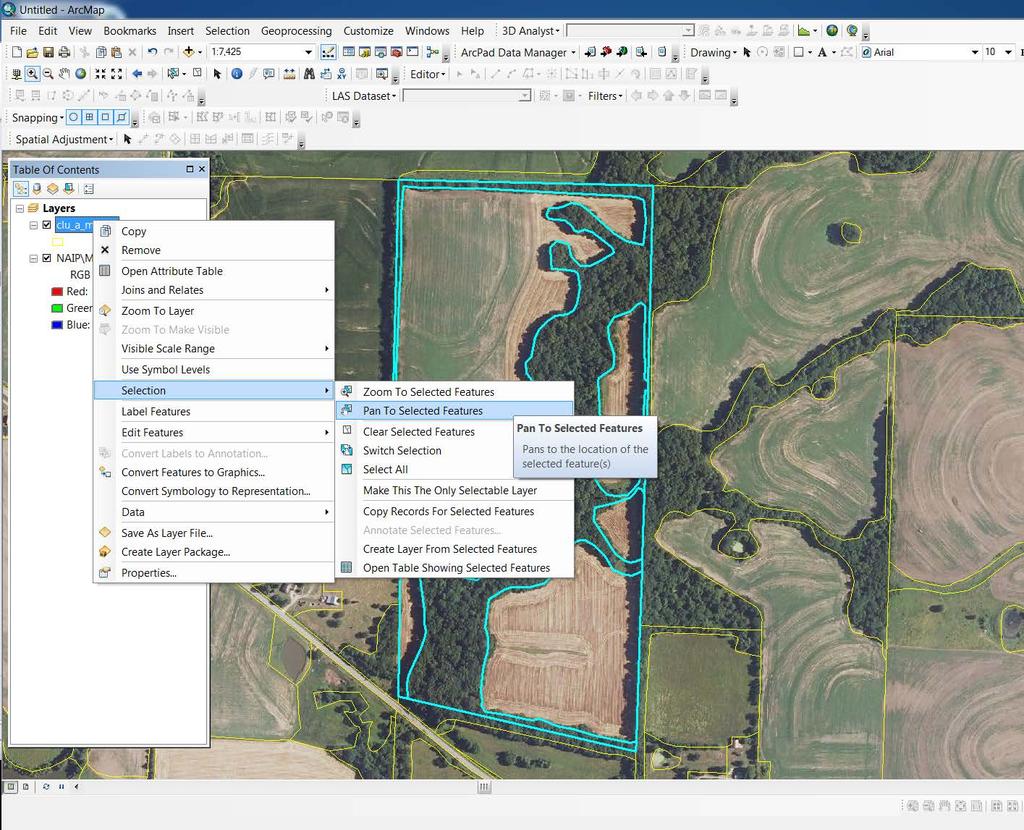
24 Locate 24


25 How many easements in Lafayette Co.? 25


26 Open Easements Attribute Table. Right-mouse click on Nest_Acres. Sum statistic is number of acres in the selected set. Statistics: 1,181.8 ac. of easements In Lafayette Co. 26

27 New Dataset from subset Note same concept is used in Toolkit to use a CLU subset to make a PLU. 27
28 Making a shapefile without using the Toolkit button 28
29 Acres as an Attribute Add Acres field to table of a polygon layer Make sure it is Float type, with at least 0.1 resolution Right-mouse click on acres field>>calculate Geometry 29
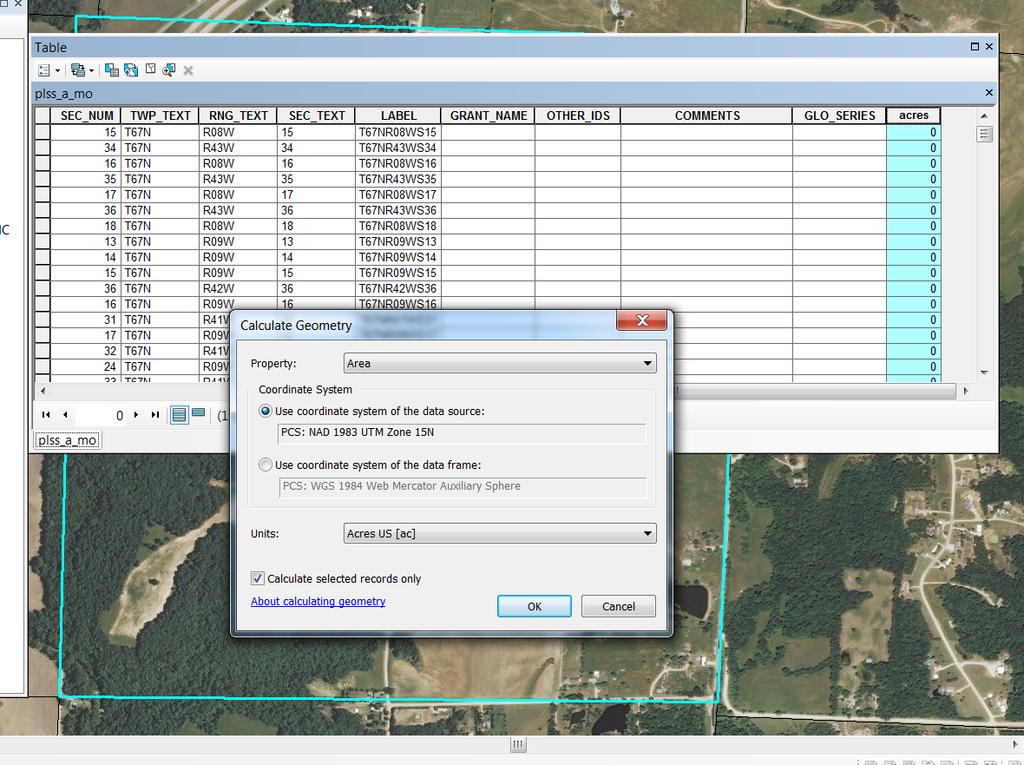
30 30

31 OR: Start>>All Programs>>ArcGIS>>ArcCatalog Go to folder where you want the data stored Right-mouse click>>new>>shapefile 31


32 Name the shapefile Feature Type: Pick Point, Polyline or Polygon (there are others you won t use) Edit to select projected coordinate system (UTM NAD83 Zone 15 or 16) 32
 Add Field")
33 Open Attribute Table Upper left Icon (Options) Add Field 33
, float (decimal numbers) or text) For decimal (float) numbers, Precision is total length of number and Scale is number of decimal")
34 Name the Field (10 character limit; no spaces; certain special characters not allowed) Choose Type most commonly short integer, (whole numbers), float (decimal numbers) or text) For decimal (float) numbers, Precision is total length of number and Scale is number of decimal places 34


35 Select feature to attribute Right-mouse click on field name, Field Calculator 35

36 Text field values must be in Text values are put into double quotes 36

37 Attributes Use attributes to differentiate feature types not separate shapefiles pool.shp trees.shp herbaceous.shp INSTEAD: T1234_habitats.shp with an text attribute field called Type that is calculate to pool, trees planted, or herbaceous 37

38 Map Coordinates for a Location 38
39 Editing Data when not in Toolkit 39

40 Customize>>Toolbars>> Polygon Editor Line Editor Point Editor Editor Topology 40
41 Polygon Editor is a Toolkit Toolbar for editing polygon layers is a bit more user friendly than the ArcMap Editor toolbar. I recommend using it for most polygon editing. Similarly, line and point editor are Toolkit toolbars for those feature types. They are easier to use for basic data entry. 41
42 Polygon Topology For many polygon data layers, the goal is to account for ALL land area once and only once, i.e. no gaps and no overlaps Topology is a term used for the relationships among data; one type of topology is polygons share boundaries with no gaps or overlaps Examples soils, CLU with a few exceptions (some gaps or voids), PLU 42
43 43

44 Violates polygon topology rule of no gaps or overlaps 44
45 Polygon Editor Toolbar Use Add Feature Tool for a new polygon Use Split Feature: to split existing polygon for inclusion polygons Using the appropriate Edit tools ensures topology rules are followed and data is of good quality 45

46 To Split a Feature: Select the feature to split Use Split Feature Tool Begin outside the selected feature Digitize the cut line End outside the selected feature and double-click to end 46

47 Inclusion polygon: Select Feature to contain the polygon Use Split Feature Tool Digitize the inclusion, making sure to redigitize exactly over the starting point. Right-mouse click and select Finish Sketch. This error message means the end point was not redigitized closely enough retry 47

48 In Customize>>Toolbars, turn on Snapping toolbar, and set Snap to Sketch to reduce problem digitizing inclusion polygons. 48
49 Use Add Feature Tool to append a polygon that shares a boundary with an existing polygon but otherwise is outside the polygon. DO NOT redigitize shared boundary. 49

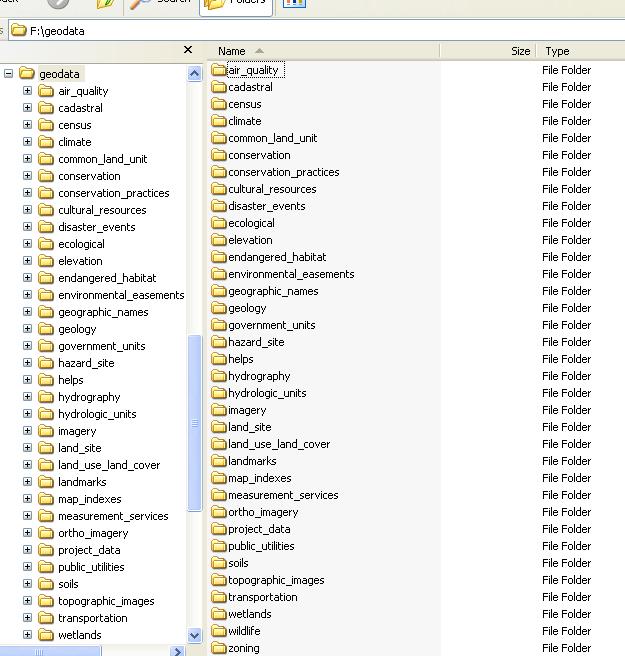
50 Filling a void: First confirm it is a void by doing an Identify in the hole if no attributes are shown it is a void. 50
51 Filling a void: Add feature tool; digitize around void Select new polygon and polygon with void Merge (M) this makes a polygon in the void If want only one polygon, select and Merge again 51
52 Caution on using R on Polygon Editor to reshape a feature: Works on boundaries not Caution: Do not use R (reshape) shared with another polygon on a shared boundary Does not work on shared boundaries Worked here Did not work here 52

53 To reshape a shared boundary: 1. Select polygon to edit with the Topology Edit tool from the topology toolbar. 2. When the polygon turns magenta, use Reshape Edge tool from Topology toolbar. 53

54 Sketch the new shape and both polygons are adjusted. 54
55 Using existing polygons Select a polygon from one layer (ex. CLU). Use copy/paste to put it into another polygon layer you have in edit mode. Ex. A field from the CLU represents the area of a polygon practice. No need to redigitize. 55
56 General Comments on Polygon Editing Merge polygons back together if a split or inclusion is not needed (Select polygons to merge; M on Polygon Editor toolbar or Editor>>Merge on Editor Toolbar). Deleting polygons often leaves voids you don t want. 56
57 Most common reason the Split Feature tool is grayed out is when more than one polygon is selected; can only split one polygon. 57
58 Error in digitizing resulted in 2 polygons on top of each other; Merge to one and proceed with split 58
59 Starting from scratch, such as merging polygons and resplitting, is often much easier than trying to reshape shared boundaries Be cautious, however, if editing polygons associated with CONTRACTS. 59

60 Making Use of Data on f:\geodata 60
61 Highlights f:\geodata\census\towns\towns_a_mo.shp..\cultural_resources\cultural_resources_a_mo.sh p..\ecological\heritage2012_a_mo.shp..\elevation\contour_l_mo<fips>.shp..\environmental_easements\easements_a_mo.gdb all easements wrp,grp,ewp,frpp..\hydrography\femadfirm_a_mo<fips>.shp or femaq3_a_mo<fips>.shp 100-yr and 500 yr floodplains 61
62 \hydrography\nhd24k_l_<8-digit HUC>.shp streams data \hydrologic_units\wbdhu12_a_mo.shp; wbdhu8_a_mo.shp \transportation\roadsmodot_l_mo<fips>/shp \cadastrak\plss_a_mo.shp township/range/sections \government_units\cnty24k_a_mo.shp 62
63 \wetlands\nwi_a_mo<fips>.shp national wetlands inventory data \wetlands\certified_determination_wetlands_a_m o.shp since 2008* * FSA uses this layer for recons of CLU no need to make a map for them Some layers are updated frequently! Request updates if you suspect it is not current. 63
64 Ex.: Locating HUC12 by TRS Select by Attributes 64

65 Zoom to Selected label of HUC12 65
66 Metadata Information about a data layer Stored in a.txt,.met,.xml or.doc file Example: Mapclassification.doc explains NWI coding; stored at f:\geodata\wetlands metadata.txt stored with cultural_resources_a_mo.shp 66
67 Data Analysis ArcToolbox accessed from Geoprocessing>>ArcToolbox or from the ArcToolbox icon 67
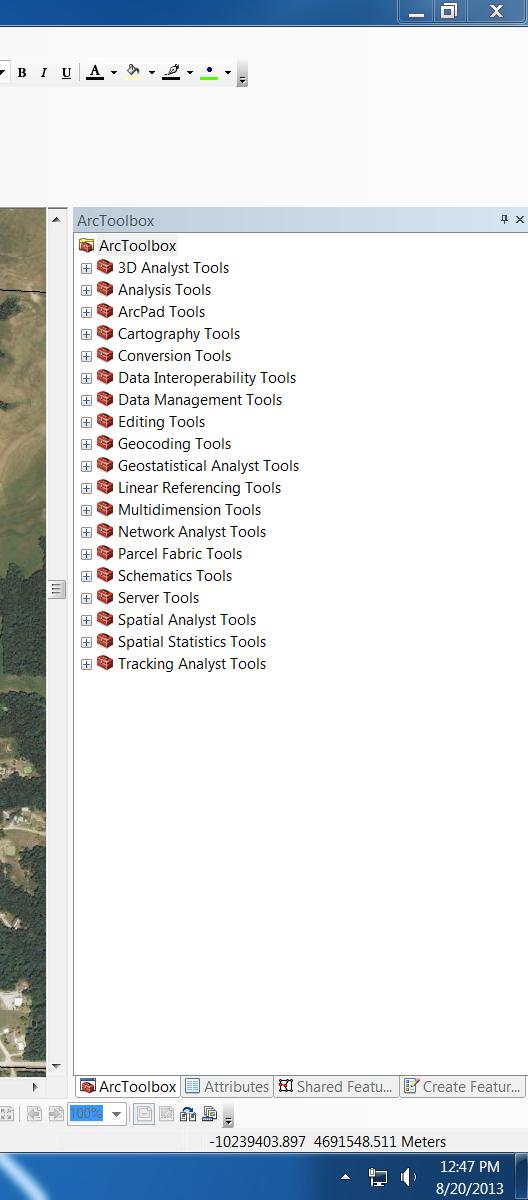
68 68

69 Example: Show only the contours covering one tract Clip creates a new layer containing the features of the input layer limited to the geographic extent of the clip layer 69
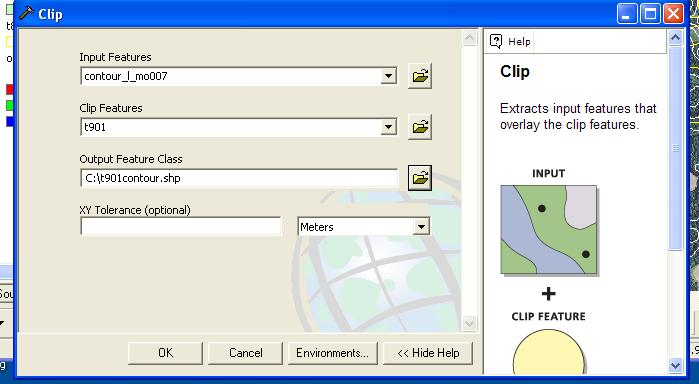
70 70
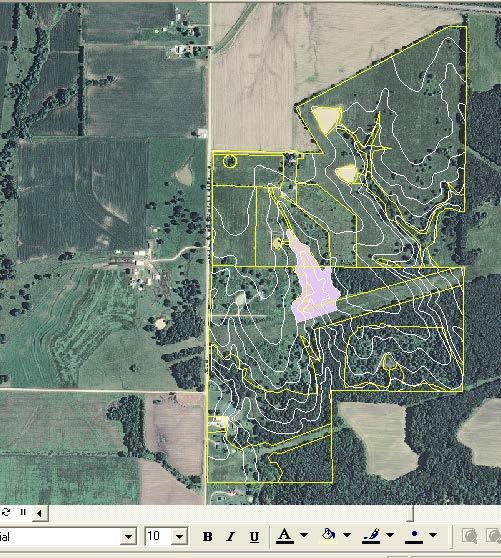
71 71

72 Example: Soil Maps Units by fields of a single tract Intersect creates a new layer that combines the features of two input layers, limited to the geographic extent of the smaller layer 72
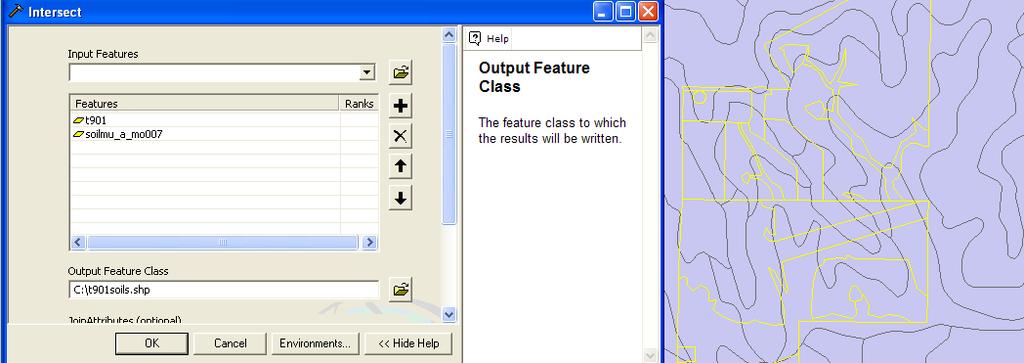
73 73

74 Soils Inventory Button in Toolkit then has some reporting functions built in in this case the Toolkit button saves several steps! 74

75 Instead, what if you wanted the soil map units by subwatersheds of a drainage area: 75

76 Make sure acres have been updated since Intersect was run! Select Watershed 1 Summarize on MUSYM (right mouse click on Field name MUSYM in Table) Sum acres 76

77 Repeat for each subwatershed (More elegantly, you could summarize all subwatersheds by MUSYM and use an Excel Pivot Table to break out the Subwatersheds) 77

78 Use Soil Data Viewer to assign Hydrologic Soil Group to Watershed_Soils Again, summarize a subwatershed selection 78
79 Other tools Analysis>>Proximity>>Buffer Works like the Toolkit buffer tool with a few more options Data Management Tools>>Generalization>>Dissolve (removes boundaries among polygons of the same attribute, such as dissolve CLU on TractNBR for a tract boundary layer) 79
80 Summary ArcMap is a powerful tool that can make certain tasks easier or more effective Do not be caught thinking that GIS is a mapping tool it can assist with map making but is so much more! 80
Name: Date: June 27th, 2011 GIS Boot Camps For Educators Lecture_3
 Name: Date: June 27th, 2011 GIS Boot Camps For Educators Lecture_3 Practical: Creating and Editing Shapefiles Using Straight, AutoComplete and Cut Polygon Tools Use ArcCatalog to copy data files from:
Field-Scale Watershed Analysis
 Conservation Applications of LiDAR Field-Scale Watershed Analysis A Supplemental Exercise for the Hydrologic Applications Module Andy Jenks, University of Minnesota Department of Forest Resources 2013
Welcome to NR402 GIS Applications in Natural Resources. This course consists of 9 lessons, including Power point presentations, demonstrations,
 Welcome to NR402 GIS Applications in Natural Resources. This course consists of 9 lessons, including Power point presentations, demonstrations, readings, and hands on GIS lab exercises. Following the last
GIS LAB 8. Raster Data Applications Watershed Delineation
 GIS LAB 8 Raster Data Applications Watershed Delineation This lab will require you to further your familiarity with raster data structures and the Spatial Analyst. The data for this lab are drawn from
Basics of Using LiDAR Data
 Conservation Applications of LiDAR Basics of Using LiDAR Data Exercise #2: Raster Processing 2013 Joel Nelson, University of Minnesota Department of Soil, Water, and Climate This exercise was developed
Exercise 4: Import Tabular GPS Data and Digitizing
 Exercise 4: Import Tabular GPS Data and Digitizing You can create NEW GIS data layers by digitizing on screen with an aerial photograph or other image as a back-drop. You can also digitize using imported
Data Assembly, Part II. GIS Cyberinfrastructure Module Day 4
 Data Assembly, Part II GIS Cyberinfrastructure Module Day 4 Objectives Continuation of effective troubleshooting Create shapefiles for analysis with buffers, union, and dissolve functions Calculate polygon
Calculate a Distance Matrix of Locations along River Network
 Calculate a Distance Matrix of Locations along River Network These instructions enable you to measure the length of line segments between points, which is much more useful than simple straight-line distances
ArcCatalog or the ArcCatalog tab in ArcMap ArcCatalog or the ArcCatalog tab in ArcMap ArcCatalog or the ArcCatalog tab in ArcMap
 ArcGIS Procedures NUMBER OPERATION APPLICATION: TOOLBAR 1 Import interchange file to coverage 2 Create a new 3 Create a new feature dataset 4 Import Rasters into a 5 Import tables into a PROCEDURE Coverage
Exercise 5: Import Tabular GPS Data and Digitizing
 Exercise 5: Import Tabular GPS Data and Digitizing You can create NEW GIS data layers by digitizing on screen with an aerial photograph or other image as a back-drop. You can also digitize using imported
GIS Workshop Spring 2016
 1/ 14 GIS Geographic Information System. An integrated collection of computer software and data used to view and manage information about geographic places, analyze spatial relationships, and model spatial
Topic 5: Raster and Vector Data Models
 Geography 38/42:286 GIS 1 Topic 5: Raster and Vector Data Models Chapters 3 & 4: Chang (Chapter 4: DeMers) 1 The Nature of Geographic Data Most features or phenomena occur as either: discrete entities
BAEN 673 Biological and Agricultural Engineering Department Texas A&M University ArcSWAT / ArcGIS 10.1 Example 2
 Before you Get Started BAEN 673 Biological and Agricultural Engineering Department Texas A&M University ArcSWAT / ArcGIS 10.1 Example 2 1. Open ArcCatalog Connect to folder button on tool bar navigate
Creating a Smaller Data Set from a Larger Data Set Vector Data
 Creating a Smaller Data Set from a Larger Data Set Vector Data Written by Barbara Parmenter, revised by Carolyn Talmadge January 16, 2015 USING THE SELECTION METHOD QUICK METHOD BY CREATING A LAYER FILE...
Finding and Using Spatial Data
 Finding and Using Spatial Data Introduction In this lab, you will download two different versions of the National Wetlands Inventory (NWI) dataset for a region of Massachusetts, from a source on the internet.
Mid-term exam. GIS and Forest Engineering Applications. Week 5. FE 257. GIS and Forest Engineering Applications. Week 5
 FE 257. GIS and Forest Engineering Applications Week 5 Week 5 Last week (Chapter 3): Acquiring, creating, and editing GIS s Examining Error Chapter 7 Buffering and other proximity operations Questions?
How to Create a Tile Package
 United States Department of Agriculture Digital Mobile Sketch Mapping (DMSM) How to Create a Tile Package (TPK) Forest Service Introduction A tile package (.tpk) allows you to use a set of packaged tiles
ArcMap - EXPLORING THE DATABASE Part I. SPATIAL DATA FORMATS Part II
 Week 5 ArcMap - EXPLORING THE DATABASE Part I SPATIAL DATA FORMATS Part II topics of the week Exploring the Database More on the Table of Contents Exploration tools Identify, Find, Measure, Map tips, Hyperlink,
GEOGRAPHIC INFORMATION SYSTEMS Lecture 17: Geoprocessing and Spatial Analysis
 GEOGRAPHIC INFORMATION SYSTEMS Lecture 17: and Spatial Analysis tools are commonly used tools that we normally use to prepare data for further analysis. In ArcMap, the most commonly used tools appear in
Ex. 4: Locational Editing of The BARC
 Ex. 4: Locational Editing of The BARC Using the BARC for BAER Support Document Updated: April 2010 These exercises are written for ArcGIS 9.x. Some steps may vary slightly if you are working in ArcGIS
GIS LAB 1. Basic GIS Operations with ArcGIS. Calculating Stream Lengths and Watershed Areas.
 GIS LAB 1 Basic GIS Operations with ArcGIS. Calculating Stream Lengths and Watershed Areas. ArcGIS offers some advantages for novice users. The graphical user interface is similar to many Windows packages
ArcGIS Pro Editing. Jennifer Cadkin & Phil Sanchez
 ArcGIS Pro Editing Jennifer Cadkin & Phil Sanchez ArcGIS Pro Editing Overview Provides tools that allow you to maintain, update, and create new data - Modifying geometry, drawing new features - Entering
INTRODUCTION TO GIS WORKSHOP EXERCISE
 111 Mulford Hall, College of Natural Resources, UC Berkeley (510) 643-4539 INTRODUCTION TO GIS WORKSHOP EXERCISE This exercise is a survey of some GIS and spatial analysis tools for ecological and natural
Lab 3: Digitizing in ArcMap
 Lab 3: Digitizing in ArcMap What You ll Learn: In this Lab you ll be introduced to basic digitizing techniques using ArcMap. You should read Chapter 4 in the GIS Fundamentals textbook before starting this
Using LIDAR to Design Embankments in ArcGIS. Written by Scott Ralston U.S. Fish & Wildlife Service Windom Wetland Management District
 Using LIDAR to Design Embankments in ArcGIS Written by Scott Ralston U.S. Fish & Wildlife Service Windom Wetland Management District This tutorial covers the basics of how to design a dike, embankment
Measuring Area/Length of Organisms with GIS
 Measuring Area/Length of Organisms with GIS These instructions enable you to measure the length and area of microscopic organisms in ArcGIS from digital photographs. The four-step process involves: georeferencing
4. If you are prompted to enable hardware acceleration to improve performance, click
 Exercise 1a: Creating new points ArcGIS 10 Complexity: Beginner Data Requirement: ArcGIS Tutorial Data Setup About creating new points In this exercise, you will use an aerial photograph to create a new
Lab#6: Editing Shapefiles With ArcMap. create a point layer from a text file, then join a table to your point attribute table
 NRM338 Fall 2018 Lab#6 Page#1 of 17 In this lab, you will Lab#6: Editing Shapefiles With ArcMap create a point layer from a text file, then join a table to your point attribute table create hyperlinks
Import, view, edit, convert, and digitize triangulated irregular networks
 v. 10.1 WMS 10.1 Tutorial Import, view, edit, convert, and digitize triangulated irregular networks Objectives Import survey data in an XYZ format. Digitize elevation points using contour imagery. Edit
Exercise 3: Creating a Geodatabase
 Exercise 3: Creating a Geodatabase Introduction: A database (DB) is an organized collection of data, that we can visualize as being a group of tables. An example of a simple database can be seen below:
GIS Basics for Urban Studies
 GIS Basics for Urban Studies Date: March 21, 2018 Contacts: Mehdi Aminipouri, Graduate Peer GIS Faciliator, SFU Library (maminipo@sfu.ca) Keshav Mukunda, GIS & Map Librarian Librarian for Geography (kmukunda@sfu.ca)
George Mason University Department of Civil, Environmental and Infrastructure Engineering. Dr. Celso Ferreira Prepared by Lora Baumgartner
 George Mason University Department of Civil, Environmental and Infrastructure Engineering Dr. Celso Ferreira Prepared by Lora Baumgartner Exercise Topic: Getting started with HEC GeoRAS Objective: Create
Appendix 2: Random Plots Workbook: Unstratified Sample
 Appendix 2: Random Plots Workbook: Unstratified Sample These instructions will help users of all skill levels create a random sample of i-tree Eco plot centers, plot areas, and the associated i-tree Eco-required
Protocol for Riparian Buffer Restoration Prioritization in Centre County and Clinton County
 Protocol for Riparian Buffer Restoration Prioritization in Centre County and Clinton County Chesapeake Conservancy has developed this methodology to prioritize riparian buffer restoration in Centre County
CE 549 Lab 1 - Linking Streamflow Data to a Gauging Station
 CE 549 Lab 1 - Linking Streamflow Data to a Gauging Station Prepared by Venkatesh Merwade Lyles School of Civil Engineering, Purdue University vmerwade@purdue.edu January 2018 Objective The objective of
Delineating the Stream Network and Watersheds of the Guadalupe Basin
 Delineating the Stream Network and Watersheds of the Guadalupe Basin Francisco Olivera Department of Civil Engineering Texas A&M University Srikanth Koka Department of Civil Engineering Texas A&M University
ArcMap Editing Tips and Tricks. Sean Jones
 ArcMap Editing Tips and Tricks Sean Jones Overview Topics - Tuning your editing map - Creating features - Editing features and attributes - Aligning and editing coincident features - Addins Format - Software
ArcGIS Pro Editing: An Introduction. Jennifer Cadkin & Phil Sanchez
 ArcGIS Pro Editing: An Introduction Jennifer Cadkin & Phil Sanchez See Us Here WORKSHOP ArcGIS Pro Editing: An Introduction LOCATION SDCC - Ballroom 20 D TIME FRAME Thursday 10:00 11:00 ArcGIS Pro: 3D
Stream Network and Watershed Delineation using Spatial Analyst Hydrology Tools
 Stream Network and Watershed Delineation using Spatial Analyst Hydrology Tools Prepared by Venkatesh Merwade School of Civil Engineering, Purdue University vmerwade@purdue.edu January 2018 Objective The
A Second Look at DEM s
 A Second Look at DEM s Overview Detailed topographic data is available for the U.S. from several sources and in several formats. Perhaps the most readily available and easy to use is the National Elevation
Lab 3: Digitizing in ArcGIS Pro
 Lab 3: Digitizing in ArcGIS Pro What You ll Learn: In this Lab you ll be introduced to basic digitizing techniques using ArcGIS Pro. You should read Chapter 4 in the GIS Fundamentals textbook before starting
Conservation Applications of LiDAR. Terrain Analysis. Workshop Exercises
 Conservation Applications of LiDAR Terrain Analysis Workshop Exercises 2012 These exercises are part of the Conservation Applications of LiDAR project a series of hands on workshops designed to help Minnesota
SilvAssist 3.5 Instruction Manual Instruction Manual for the SilvAssist Toolbar For ArcGIS. Version 3.5
 Instruction Manual for the SilvAssist Toolbar For ArcGIS Version 3.5 1 2 Contents Introduction... 5 Preparing to Use SilvAssist... 6 Polygon Selection... 6 Plot Allocator... 7 Requirements:... 7 Operation...
v Prerequisite Tutorials GSSHA Modeling Basics Stream Flow GSSHA WMS Basics Creating Feature Objects and Mapping their Attributes to the 2D Grid
 v. 10.1 WMS 10.1 Tutorial GSSHA Modeling Basics Developing a GSSHA Model Using the Hydrologic Modeling Wizard in WMS Learn how to setup a basic GSSHA model using the hydrologic modeling wizard Objectives
Getting to Know ModelBuilder
 Getting to Know ModelBuilder Offered by Shane Bradt through the UNH Cooperative Extension Geospatial Technologies Training Center Developed by Sandy Prisloe and Cary Chadwick at the Geospatial Technology
Create a personal geodatabase
 Create a personal geodatabase To create a personal geodatabase that corresponds to the same release as the ArcGIS for Desktop client you are using, follow these steps: 1. In ArcCatalog, right-click the
Steps for Modeling a Proposed New Reservoir in GIS
 Steps for Modeling a Proposed New Reservoir in GIS Requirements: ArcGIS ArcMap, ArcScene, Spatial Analyst, and 3D Analyst There s a new reservoir proposed for Right Hand Fork in Logan Canyon. I wanted
Geographical Information Systems Institute. Center for Geographic Analysis, Harvard University. LAB EXERCISE 1: Basic Mapping in ArcMap
 Harvard University Introduction to ArcMap Geographical Information Systems Institute Center for Geographic Analysis, Harvard University LAB EXERCISE 1: Basic Mapping in ArcMap Individual files (lab instructions,
Creating Contours using ArcMap
 Creating Contours with ArcMap and ArcScene Digital elevation models (DEMs) are geospatial datasets that contain elevation values sampled according to a regularly spaced rectangular grid. They can be used
GSSHA WMS Basics Loading DEMs, Contour Options, Images, and Projection Systems
 v. 10.0 WMS 10.0 Tutorial GSSHA WMS Basics Loading DEMs, Contour Options, Images, and Projection Systems Learn how to work with DEMs and images and to convert between projection systems in the WMS interface
Chapter 17 Creating a New Suit from Old Cloth: Manipulating Vector Mode Cartographic Data
 Chapter 17 Creating a New Suit from Old Cloth: Manipulating Vector Mode Cartographic Data Imagine for a moment that digital cartographic databases were a perfect analog of the paper map. Once you digitized
Lab 11: Terrain Analyses
 Lab 11: Terrain Analyses What You ll Learn: Basic terrain analysis functions, including watershed, viewshed, and profile processing. There is a mix of old and new functions used in this lab. We ll explain
Spatial Analysis with Raster Datasets
 Spatial Analysis with Raster Datasets Francisco Olivera, Ph.D., P.E. Srikanth Koka Lauren Walker Aishwarya Vijaykumar Keri Clary Department of Civil Engineering April 21, 2014 Contents Brief Overview of
Combine Yield Data From Combine to Contour Map Ag Leader
 Combine Yield Data From Combine to Contour Map Ag Leader Exporting the Yield Data Using SMS Program 1. Data format On Hard Drive. 2. Start program SMS Basic. a. In the File menu choose Open. b. Click on
GIS Fundamentals: Supplementary Lessons with ArcGIS Pro
 Station Analysis (parts 1 & 2) What You ll Learn: - Practice various skills using ArcMap. - Combining parcels, land use, impervious surface, and elevation data to calculate suitabilities for various uses
Making the Most of Raster Analysis with Living Atlas Data. Aileen Buckley, PhD, Research Cartographer Esri - Redlands
 Making the Most of Raster Analysis with Living Atlas Data Aileen Buckley, PhD, Research Cartographer Esri - Redlands Spatial Analysis with Online Data Your Desktop Web Device Never scrounge for or download
_Tutorials. Arcmap. Linking additional files outside from Geodata
 _Tutorials Arcmap Linking additional files outside from Geodata 2017 Sourcing the Data (Option 1): Extracting Data from Auckland Council GIS P1 First you want to get onto the Auckland Council GIS website
Watershed Modeling Using Online Spatial Data to Create an HEC-HMS Model
 v. 10.1 WMS 10.1 Tutorial Watershed Modeling Using Online Spatial Data to Create an HEC-HMS Model Learn how to setup an HEC-HMS model using WMS online spatial data Objectives This tutorial shows how to
Georeferencing and Digitizing
 INTRODUCTION There is a great deal of geographic data available in formats that cannot be immediately integrated with other GIS data. In order to use these types of data in GIS it is necessary to align
Lab 18c: Spatial Analysis III: Clip a raster file using a Polygon Shapefile
 Environmental GIS Prepared by Dr. Zhi Wang, CSUF EES Department Lab 18c: Spatial Analysis III: Clip a raster file using a Polygon Shapefile These instructions enable you to clip a raster layer in ArcMap
Undo Button Clicking this tool will undo the last action. Clicking on this tool multiple times will undo all subsequent changes that were made.
 SMS Featured Icons: Editor Window This document includes a brief description of the tools in the SMS Desktop Software Editor windows, as well as showing you the toolbar shortcuts to easily access these
RASTER ANALYSIS S H A W N L. P E N M A N E A R T H D A T A A N A LY S I S C E N T E R U N I V E R S I T Y O F N E W M E X I C O
 RASTER ANALYSIS S H A W N L. P E N M A N E A R T H D A T A A N A LY S I S C E N T E R U N I V E R S I T Y O F N E W M E X I C O TOPICS COVERED Spatial Analyst basics Raster / Vector conversion Raster data
2) Make sure that the georeferencing extension is on by right-clicking in the task bar area and selecting Georeferencing
 Make sure that the georeferencing extension is on by right-clicking in the task bar area and selecting Georeferencing") HGIS Workshop Module 1 Georeferencing Large Scale Scanned Historical Maps Objective: Learn the Principles of Georeferencing 1) In ArcMap, open the project 01 data\arcdata_10_1\arcdata\toronto\georeference.mxd
HGIS Workshop Module 1 Georeferencing Large Scale Scanned Historical Maps Objective: Learn the Principles of Georeferencing 1) In ArcMap, open the project 01 data\arcdata_10_1\arcdata\toronto\georeference.mxd
Table of Contents. 1. Prepare Data for Input. CVEN 2012 Intro Geomatics Final Project Help Using ArcGIS
 Table of Contents 1. Prepare Data for Input... 1 2. ArcMap Preliminaries... 2 3. Adding the Point Data... 2 4. Set Map Units... 3 5. Styling Point Data: Symbology... 4 6. Styling Point Data: Labels...
Working with Attribute Data and Clipping Spatial Data. Determining Land Use and Ownership Patterns associated with Streams.
 GIS LAB 3 Working with Attribute Data and Clipping Spatial Data. Determining Land Use and Ownership Patterns associated with Streams. One of the primary goals of this course is to give you some hands-on
Remote Sensing in an
 Chapter 2: Adding Data to a Map Document Remote Sensing in an ArcMap Environment Remote Sensing Analysis in an ArcMap Environment Tammy E. Parece Image source: landsat.usgs.gov Tammy Parece James Campbell
Sedimentation in Aquilla Lake Hill County, Texas
 Sedimentation in Aquilla Lake Hill County, Texas by Lorena Roque Martinez, GIS and GPS Applications in Earth Sciences (GEO 327G) Introduction The Texas Water Development Board (TWDB) is in charge of offering
Notes: Notes: Notes: Notes:
 NR406 GIS Applications in Fire Ecology & Management Lesson 2 - Overlay Analysis in GIS Gathering Information from Multiple Data Layers One of the many strengths of a GIS is that you can stack several data
George Mason University Department of Civil, Environmental and Infrastructure Engineering
 George Mason University Department of Civil, Environmental and Infrastructure Engineering Dr. Celso Ferreira Prepared by Lora Baumgartner December 2015 Revised by Brian Ross July 2016 Exercise Topic: Getting
George Mason University Department of Civil, Environmental and Infrastructure Engineering
 George Mason University Department of Civil, Environmental and Infrastructure Engineering Dr. Celso Ferreira Prepared by Lora Baumgartner December 2015 Revised by Brian Ross July 2016 Exercise Topic: GIS
In this exercise we will:
 Intro to GIS Exercise #3 TOC Data frame visual hierarchy / Select by Attribute / Select by Location / Geoprocessing IUP Dept. of Geography and Regional Planning Dr. Richard Hoch Please prepare answers
Answer the following general questions: 1. What happens when you right click on an icon on your desktop? When you left double click on an icon?
 Name: Date: June 27th, 2011 GIS Boot Camps For Educators Practical: Explore ArcGIS 10 Desktop Tools and functionality Day_1 Lecture 1 Sources: o ArcGIS Desktop help o ESRI website o Getting to Know ArcGIS
Lecture 7 Digitizing. Dr. Zhang Spring, 2017
 Lecture 7 Digitizing Dr. Zhang Spring, 2017 Model of the course Using and making maps Navigating GIS maps Map design Working with spatial data Geoprocessing Spatial data infrastructure Digitizing File
Instruction Manual for SilvAssist for ArcGIS
 Instruction Manual for SilvAssist for ArcGIS Version 2.0 Table of Contents Introduction..II Preparing to use SilvAssist..1-3 Plot Allocator Menu Definitions and Use.....4 General Use and Setup....5-7 Auto
Delineating Watersheds from a Digital Elevation Model (DEM)
") Delineating Watersheds from a Digital Elevation Model (DEM) (Using example from the ESRI virtual campus found at http://training.esri.com/courses/natres/index.cfm?c=153) Download locations for additional
Delineating Watersheds from a Digital Elevation Model (DEM) (Using example from the ESRI virtual campus found at http://training.esri.com/courses/natres/index.cfm?c=153) Download locations for additional
GEOG 487 Lesson 7: Step- by- Step Activity
 GEOG 487 Lesson 7: Step- by- Step Activity Part I: Review the Relevant Data Layers and Organize the Map Document In Part I, we will review the data and organize the map document for analysis. 1. Unzip
Key Terms. Attribute join Target table Join table Spatial join
 Key Terms Attribute join Target table Join table Spatial join Lect 10A Building Geodatabase Create a new file geodatabase Map x,y data Convert shape files to geodatabase feature classes Spatial Data Formats
Introduction to GIS 2011
 Introduction to GIS 2011 Digital Elevation Models CREATING A TIN SURFACE FROM CONTOUR LINES 1. Start ArcCatalog from either Desktop or Start Menu. 2. In ArcCatalog, create a new folder dem under your c:\introgis_2011
MODULE 1 BASIC LIDAR TECHNIQUES
 MODULE SCENARIO One of the first tasks a geographic information systems (GIS) department using lidar data should perform is to check the quality of the data delivered by the data provider. The department
Georeferencing Imagery in ArcGIS 10.3.x
 Georeferencing Imagery in ArcGIS 10.3.x Georeferencing is the process of aligning imagery (maps, air photos, etc.) with spatial data such as point, lines or polygons (for example, roads and water bodies).
Raster Data. James Frew ESM 263 Winter
 Raster Data 1 Vector Data Review discrete objects geometry = points by themselves connected lines closed polygons attributes linked to feature ID explicit location every point has coordinates 2 Fields
A GIS SAMPLING ASSISTANT PROGRAM FOR FOREST INVENTORY POINT/PLOT SCHEMES
 A GIS SAMPLING ASSISTANT PROGRAM FOR FOREST INVENTORY POINT/PLOT SCHEMES Donald J. Lipscomb, Research Specialist Department of Forestry and Natural Resources Clemson University, Clemson, S.C. 29634 Dr.
Feature Analyst Quick Start Guide
 Feature Analyst Quick Start Guide River Extraction River extractions are much like road extractions, in that you are trying to identify a continuous object running through other features within your image.
Select the Parks within Forest Acres
 Select the Parks within Forest Acres TASKS RESULT 1. Add the county boundary, municipalities and parks (pts.) layers to your map 2. Save your map (.mxd) to your desktop Your map should look something like
Using the Geodatabase
 Using the Geodatabase February 13, 2002 Presented by: John Stroud, ESRI GeoDatabase Geodatabase comes in two flavors Personal mdb format ArcSDE rdbms format ArcGIS is a suite of three products ArcView,
UNDERSTAND HOW TO SET UP AND RUN A HYDRAULIC MODEL IN HEC-RAS CREATE A FLOOD INUNDATION MAP IN ARCGIS.
 CE 412/512, Spring 2017 HW9: Introduction to HEC-RAS and Floodplain Mapping Due: end of class, print and hand in. HEC-RAS is a Hydrologic Modeling System that is designed to describe the physical properties
City of Richmond Interactive Map (RIM) User Guide for the Public
 User Guide for the Public") Interactive Map (RIM) User Guide for the Public Date: March 26, 2013 Version: 1.0 3479477 3479477 Table of Contents Table of Contents Table of Contents... i About this
Interactive Map (RIM) User Guide for the Public Date: March 26, 2013 Version: 1.0 3479477 3479477 Table of Contents Table of Contents Table of Contents... i About this
Making Yield Contour Maps Using John Deere Data
 Making Yield Contour Maps Using John Deere Data Exporting the Yield Data Using JDOffice 1. Data Format On Hard Drive 2. Start program JD Office. a. From the PC Card menu on the left of the screen choose
J.Welhan 5/07. Watershed Delineation Procedure
 Watershed Delineation Procedure 1. Prepare the DEM: - all grids should be in the same projection; if not, then reproject (or define and project); if in UTM, all grids must be in the same zone (if not,
GIS IN ECOLOGY: EDITING AND CREATING LAYERS
 GIS IN ECOLOGY: EDITING AND CREATING LAYERS Contents Introduction... 2 ArcMap s Editor Toolbar... 3 Data Sources... 4 Tasks... 4 Copying the Course Dataset... 4 Map document setup... 5 Adding XY data and
GIS Tools for Hydrology and Hydraulics
 1 OUTLINE GIS Tools for Hydrology and Hydraulics INTRODUCTION Good afternoon! Welcome and thanks for coming. I once heard GIS described as a high-end Swiss Army knife: lots of tools in one little package
THE HONG KONG POLYTECHNIC UNIVERSITY DEPARTMENT OF LAND SURVEYING & GEO-INFORMATICS LSGI521 PRINCIPLES OF GIS
 THE HONG KONG POLYTECHNIC UNIVERSITY DEPARTMENT OF LAND SURVEYING & GEO-INFORMATICS LSGI521 PRINCIPLES OF GIS Student name: Student ID: Table of Content Working with files, folders, various software and
ARC HYDRO TOOLS CONFIGURATION DOCUMENT #3 GLOBAL DELINEATION WITH EDNA DATA
 ARC HYDRO TOOLS CONFIGURATION DOCUMENT #3 GLOBAL DELINEATION WITH EDNA DATA Environmental Systems Research Institute, Inc. (Esri) 380 New York Street Redlands, California 92373-8100 Phone: (909) 793-2853
ArcGIS Drivers Permit. Using ESRI ArcView 10 and NH GRANIT Data
 ArcGIS Drivers Permit Using ESRI ArcView 10 and NH GRANIT Data UNH Cooperative Extension September 2011 Original Draft: September 2011 Exercise manual by: Anne Deely University of New Hampshire Cooperative
Watershed Modeling Orange County Hydrology Using GIS Data
 v. 9.1 WMS 9.1 Tutorial Watershed Modeling Orange County Hydrology Using GIS Data Learn how to delineate sub-basins and compute soil losses for Orange County (California) hydrologic modeling Objectives
Using ArcGIS 10.x Introductory Guide University of Toronto Mississauga Library Hazel McCallion Academic Learning Centre
 Using ArcGIS 10.x Introductory Guide University of Toronto Mississauga Library Hazel McCallion Academic Learning Centre FURTHER ASSISTANCE If you have questions or need assistance, please contact: Andrew
Downloading shapefiles and using essential ArcMap tools
 CHAPTER 1 KEY CONCEPTS downloading shapefiles learning essential tools exploring the ArcMap table of contents understanding shapefiles customizing shapefiles saving projects Downloading shapefiles and
Exercise 1: An Overview of ArcMap and ArcCatalog
 Exercise 1: An Overview of ArcMap and ArcCatalog Introduction: ArcGIS is an integrated collection of GIS software products for building a complete GIS. ArcGIS enables users to deploy GIS functionality
Soil and Water Conservation Laboratory Standard Operating Procedure
 Soil and Water Conservation Laboratory Standard Operating Procedure Sherman 230, Soil and Water Conservation Laboratory, UH Mānoa Collecting GPS data with the Trimble handheld through ArcGIS & related
Using GIS To Estimate Changes in Runoff and Urban Surface Cover In Part of the Waller Creek Watershed Austin, Texas
 Using GIS To Estimate Changes in Runoff and Urban Surface Cover In Part of the Waller Creek Watershed Austin, Texas Jordan Thomas 12-6-2009 Introduction The goal of this project is to understand runoff