Surface Reconstruction with MLS
|
|
|
- John Patrick
- 6 years ago
- Views:
Transcription
1 Surface Reconstruction with MLS Tobias Martin CS7960, Spring 2006, Feb 23
2 Literature An Adaptive MLS Surface for Reconstruction with Guarantees, T. K. Dey and J. Sun A Sampling Theorem for MLS Surfaces, Peer-Timo Bremer, John C. Hart
3 An Adaptive MLS Surface for Reconstruction with Guarantess Tamil K. Dey and Jian Sun

4 Implicit MLS Surfaces Zero-level-set of function I(x) defines S Normals are important, because points are projected along the normals
5 Motivation Original smooth, closed surface S. Given Conditions: Sampling Density Normal Estimates Noise Design an implicit function zero set recovers S. whose
6 Motivation So far, only uniform sampling condition. Restriction: The red arc requires 10 4 samples because of small feature.
7 Motivation Establish an adaptive sampling condition, similar to the one of Amenta and Bern. Incorporate local feature size in sampling condition. Red arc only requires 6 samples.
8 Sampling Condition Recent Surface Reconstruction algorithms are based on noise free samples. Notion of ε-sample has to be modified. P is a noisy (ε,α)-sample if Every z S to its closest point in P is < ε lfs(z). The distance for p P to z=proj(p) is < ε 2 lfs(z). Every p P has a normal which has an angle with its corresponding projected surface point < ε. The number of sample points inside B(x, ε lfs(proj(x)) is less than a small number α. Note that it is difficult to check whether a sample P is a noisy (ε,α)-sample.
9 Effect of nearby samples Points within a small neighborhood are predictably distributed within a s small slab:
10 Adaptive MLS at point x should be decided primarily by near sample points. Choose such, that sample points outside a neighborhood have less effect. Use Gaussian functions. Their width control influence of samples. Make width dependent on lfs Define width as fraction of lfs
11 Adaptive MLS Choice of weighting function: θ p (x) = Many sample points at p which contribute to point x.
12 Adaptive MLS Choice of weighting function: θ(x) p = Sample point p has a constant weight( ). Influence of p does not decrease with distance.
13 Adaptive MLS Compromise: Take fraction of as width of Gaussian. Weighting function decreases as p goes far away from x. Weighting is small for small features, i.e. small features do not require more samples.
14 Contribution of distant samples Show that the effect of distant sample points can be bounded. Rely on nearby features. How to show that?
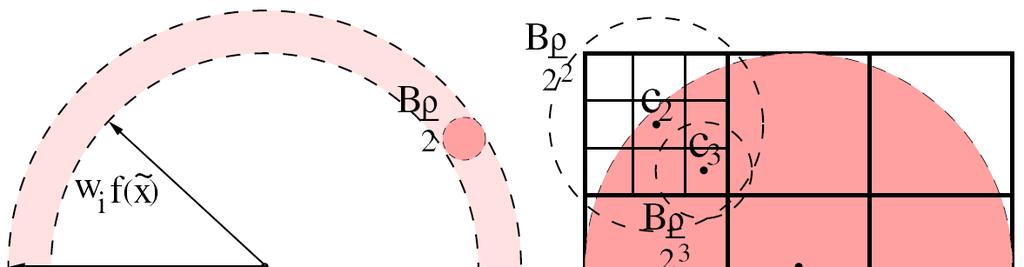
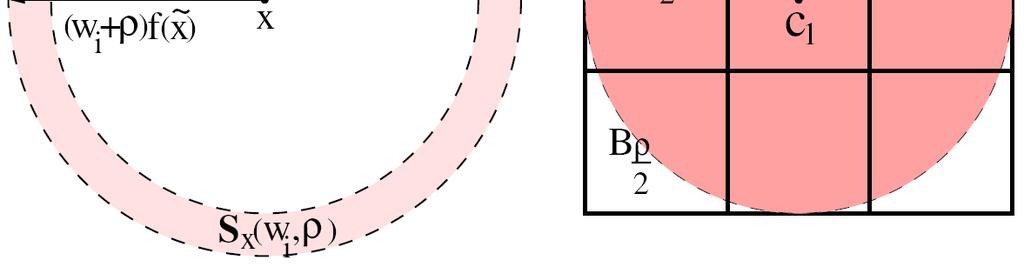
15 Contribution of distant samples r=
16 Contribution of distant samples Once there is a bound on the number of samples in B ρ/2, we lemma 3 is used which shows an upper bound on its influence, i.e.
17 Contribution of distant samples Using lemma 3 they prove the main theorem:
18 Contribution of distant samples The space outside B(x, rlfs(proj(x)) can be decomposed in an infinite number of shells, i.e. The influence of all points outside is equal to the influence of all the points in the shells which was bounded by lemma 3. Therefore, the contributions of points outside B(x,rlfs(proj(x)) can be bounded.
19 Algorithm
20 Normal Estimation Delaunay based, i.e. calculate DT of input points. Big Delaunay ball: radius greater than certain times the nearest neighbor. The vectors of incident points to center of B(c,r) approximate normals.
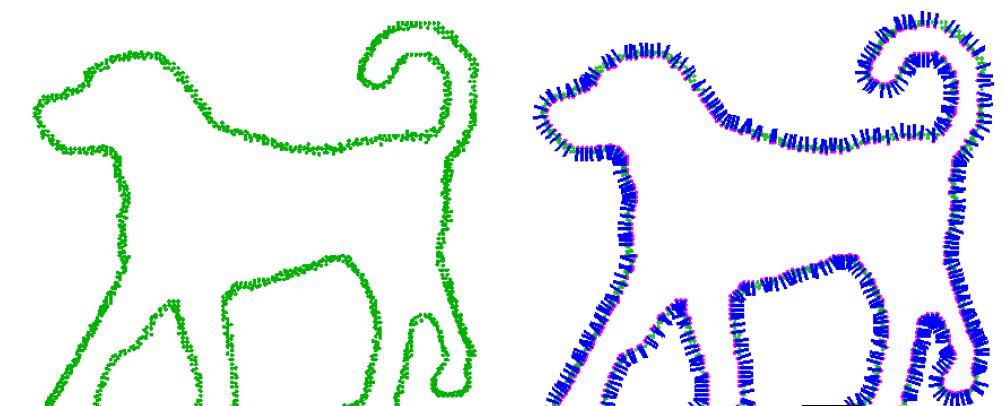
21 Normal Estimation
22 Feature Detection In noiseless case: Take poles in Voronoi cells, shortest distance approximates lfs(p). This does not work in the case of noise. Every medial axis point is covered with a big Delaunay Ball (observation by Dey and Goswami) Take biggest Delaunay Ball in both (normal) directions of sample point p. Centers act as poles (L). lfs(proj(x)) is d(p, L) where p is closest point to x in P.
23 Projection Newton Iteration: move p to p, i.e.: Iterate until d(p,p ) becomes smaller than a certain treshold. To calculate and only use the points in Ball with radius 5x the width of the Gaussian weighting function. Points outside have little effect on the function. Newton projection has big convergent domain.

24 Reconstruction Finally, use a reconstruction algorithm, e.g. Cocone to calculate a mesh.
25 AMLS vs PMLS Background on Projection MLS : Surface is the set of stationary points of a function f. An energy function e measures the quality of the fit of a plane to the point set at r. The local minima of e nearest to r is f(r).
26 AMLS vs PMLS The zero set of the energy function defines the surface. But there are other two layers of zero-level sets where the energy function reaches its local maximum.
27 AMLS vs PMLS When distance between the layers gets small, computations on the PMLS surface become difficult. Small marching step in ray tracing Small size of cubes in polygonizer
28 AMLS vs PMLS Furthermore, projection procedure in PMLS is not trivial. non-linear optimization. and finding a starting value is difficult if the two maximum layers are close. If there is noise, maxima layers could interfere. Holes and disconnectness.
29 AMLS vs PMLS
30 A Sampling Theorem for MLS Surfaces Peer-Timo Bremer and John C. Hart
31 Motivation We saw a lot of work about PSS. But not much knowledge about resulting mathematical properties. It is assumed that surface construction is well defined within a neighborhood.
32 Motivation MLS filters samples, and projects them onto a a local tangent plane. MLS is robust but difficult to analyze. Current algorithms may actually miss the surface. MLS is defined as the stationary points of a (dynamic) projection. This projection is dynamic and can be undefined. Robustness of MLS is determined by projection. Need a sample condition which guarantees that projection is defined everywhere.
33 Motivation What is necessary to have a faithful projection? Correct normals. We need a condition which shows that given a surface and a sampling, normals are well defined.


34 Sampling Condition - Outline Given a sample, show Normal vector needed by MLS does not vanish Given conditions of the surface and sampling, the normal is well defined
35 PCA - Review We have given a set of points in R 3 which lie or don t lie on a surface. We know the 3x3 covariance matrix at point q is The cov(q) can be factored into U T LU where
36 PCA - Review v max, v mid, v min define local coordinate frame:
37 MLS Surface e.g. Gaussian Weighted average 3x3 covariance matrix
38 MLS surface From we know: The eigenvector of the unique smallest eigenvalue defines the normal. Using that, the zero set of defines the MLS surface. has to be well defined!
39 New Sampling Condition Previous Sampling condition: S is well sampled by P if normal directions are defined inside a neighborhood of. (Adamson and Alexa) This is not good because S. S could be well sampled but undefined normal direction can result New Sampling condition: S is well sampled by P if normal directions are defined inside a neighborhood of S.
40 Uniqueness of smallest Eigenvalue You can prove a sampling to be well defined by ensuring that has a unique smallest eigenvalue over a neighborhood of S. It is proved in terms of the weighted variance of the samples P. Directional Variance: Variance in a specific direction
41 Uniqueness of smallest Eigenvalue We combine that with and get and decompose it into eigenvalues and eigenvectors:
42 Uniqueness of smallest Eigenvalue Using that it can be shown that if λ min is not unique var n (q) isn t unique either.(lemma 2) This leads to:
43 Sampling Theorem To prove the sampling condition, show that for every point q, there is a normal direction whose weighted variance is less than that of any perpendicular direction. Derive upper bound of weighted variance in normal direction n. Derive lower bound in an arbitrary tangent direction x. Determine sampling conditions: max(var n (q)) < min(var x (q))
44 Sampling Theorem To show, partition datapoints into ones that increase var n more versus ones that increase var x more. Construct two planes through q which seperates the points such that
")

45 Sampling Theorem Points below those planes increase var n (q) more than var x (q). The region below the planes define an hourglass shape.
46 Sampling Theorem Furthermore, q is at most w=τlfs(proj(q) above surface.
.")

47 Sampling Theorem Project hourglass onto lower medial ball (B-). Find limit of max possible effect of these risky samples. Use the risky area (red) to overestimate the number of samples and their contribution to var n.
48 Sampling Theorem Define upper bound on samples in risky area and use it to compute upper bound of var n. Define lower bound on samples outside risky area to compute lower bound of var x. This leads to the Main Theorem:
Geometric Modeling in Graphics
 Geometric Modeling in Graphics Part 10: Surface reconstruction Martin Samuelčík www.sccg.sk/~samuelcik samuelcik@sccg.sk Curve, surface reconstruction Finding compact connected orientable 2-manifold surface
Provably Good Moving Least Squares
 Provably Good Moving Least Squares Ravikrishna Kolluri Computer Science Division University of California at Berkeley 1 Problem Definition Given a set of samples on a closed surface build a representation
Outline. Reconstruction of 3D Meshes from Point Clouds. Motivation. Problem Statement. Applications. Challenges
 Reconstruction of 3D Meshes from Point Clouds Ming Zhang Patrick Min cs598b, Geometric Modeling for Computer Graphics Feb. 17, 2000 Outline - problem statement - motivation - applications - challenges
Correctness. The Powercrust Algorithm for Surface Reconstruction. Correctness. Correctness. Delaunay Triangulation. Tools - Voronoi Diagram
 Correctness The Powercrust Algorithm for Surface Reconstruction Nina Amenta Sunghee Choi Ravi Kolluri University of Texas at Austin Boundary of a solid Close to original surface Homeomorphic to original
Surface Reconstruction. Gianpaolo Palma
 Surface Reconstruction Gianpaolo Palma Surface reconstruction Input Point cloud With or without normals Examples: multi-view stereo, union of range scan vertices Range scans Each scan is a triangular mesh
Estimating Geometry and Topology from Voronoi Diagrams
 Estimating Geometry and Topology from Voronoi Diagrams Tamal K. Dey The Ohio State University Tamal Dey OSU Chicago 07 p.1/44 Voronoi diagrams Tamal Dey OSU Chicago 07 p.2/44 Voronoi diagrams Tamal Dey
Spectral Surface Reconstruction from Noisy Point Clouds
 Spectral Surface Reconstruction from Noisy Point Clouds 1. Briefly summarize the paper s contributions. Does it address a new problem? Does it present a new approach? Does it show new types of results?
04 - Normal Estimation, Curves
 04 - Normal Estimation, Curves Acknowledgements: Olga Sorkine-Hornung Normal Estimation Implicit Surface Reconstruction Implicit function from point clouds Need consistently oriented normals < 0 0 > 0
Overview. Efficient Simplification of Point-sampled Surfaces. Introduction. Introduction. Neighborhood. Local Surface Analysis
 Overview Efficient Simplification of Pointsampled Surfaces Introduction Local surface analysis Simplification methods Error measurement Comparison PointBased Computer Graphics Mark Pauly PointBased Computer
Digital Geometry Processing
 Digital Geometry Processing Spring 2011 physical model acquired point cloud reconstructed model 2 Digital Michelangelo Project Range Scanning Systems Passive: Stereo Matching Find and match features in
Outline of the presentation
 Surface Reconstruction Petra Surynková Charles University in Prague Faculty of Mathematics and Physics petra.surynkova@mff.cuni.cz Outline of the presentation My work up to now Surfaces of Building Practice
A Fast and Simple Surface Reconstruction Algorithm
 A Fast and Simple Surface Reconstruction Algorithm Siu-Wing Cheng Jiongxin Jin Man-Kit Lau Abstract We present an algorithm for surface reconstruction from a point cloud. It runs in O(n log n) time, where
Gaussian and Mean Curvature Planar points: Zero Gaussian curvature and zero mean curvature Tangent plane intersects surface at infinity points Gauss C
 Outline Shape Analysis Basics COS 526, Fall 21 Curvature PCA Distance Features Some slides from Rusinkiewicz Curvature Curvature Curvature κof a curve is reciprocal of radius of circle that best approximates
Surface Reconstruction
 Eurographics Symposium on Geometry Processing (2006) Surface Reconstruction 2009.12.29 Some methods for surface reconstruction Classification 1. Based on Delaunay triangulation(or Voronoi diagram) Alpha
Surface Reconstruction from Unorganized Points
 Survey of Methods in Computer Graphics: Surface Reconstruction from Unorganized Points H. Hoppe, T. DeRose, T. Duchamp, J. McDonald, W. Stuetzle SIGGRAPH 1992. Article and Additional Material at: http://research.microsoft.com/en-us/um/people/hoppe/proj/recon/
Kurt Mehlhorn, MPI für Informatik. Curve and Surface Reconstruction p.1/25
 Curve and Surface Reconstruction Kurt Mehlhorn MPI für Informatik Curve and Surface Reconstruction p.1/25 Curve Reconstruction: An Example probably, you see more than a set of points Curve and Surface
Spatial Interpolation & Geostatistics
 (Z i Z j ) 2 / 2 Spatial Interpolation & Geostatistics Lag Lag Mean Distance between pairs of points 1 Tobler s Law All places are related, but nearby places are related more than distant places Corollary:
Multi-level Partition of Unity Implicits
 Multi-level Partition of Unity Implicits Diego Salume October 23 rd, 2013 Author: Ohtake, et.al. Overview Goal: Use multi-level partition of unity (MPU) implicit surface to construct surface models. 3
Computational Geometry
 Computational Geometry 600.658 Convexity A set S is convex if for any two points p, q S the line segment pq S. S p S q Not convex Convex? Convexity A set S is convex if it is the intersection of (possibly
Other Voronoi/Delaunay Structures
 Other Voronoi/Delaunay Structures Overview Alpha hulls (a subset of Delaunay graph) Extension of Voronoi Diagrams Convex Hull What is it good for? The bounding region of a point set Not so good for describing
Spatial Interpolation - Geostatistics 4/3/2018
 Spatial Interpolation - Geostatistics 4/3/201 (Z i Z j ) 2 / 2 Spatial Interpolation & Geostatistics Lag Distance between pairs of points Lag Mean Tobler s Law All places are related, but nearby places
Dijkstra's Algorithm
 Shortest Path Algorithm Dijkstra's Algorithm To find the shortest path from the origin node to the destination node No matrix calculation Floyd s Algorithm To find all the shortest paths from the nodes
Medial Scaffolds for 3D data modelling: status and challenges. Frederic Fol Leymarie
 Medial Scaffolds for 3D data modelling: status and challenges Frederic Fol Leymarie Outline Background Method and some algorithmic details Applications Shape representation: From the Medial Axis to the
SYDE Winter 2011 Introduction to Pattern Recognition. Clustering
 SYDE 372 - Winter 2011 Introduction to Pattern Recognition Clustering Alexander Wong Department of Systems Design Engineering University of Waterloo Outline 1 2 3 4 5 All the approaches we have learned
Direct Rendering. Direct Rendering Goals
 May 2, 2005 Goals General Goals Small memory footprint Fast rendering High-quality results identical to those of Saffron V1 using distance-based anti-aliasing and alignment zones Goals Specific Goals Avoid
COMPUTER AND ROBOT VISION
 VOLUME COMPUTER AND ROBOT VISION Robert M. Haralick University of Washington Linda G. Shapiro University of Washington A^ ADDISON-WESLEY PUBLISHING COMPANY Reading, Massachusetts Menlo Park, California
#$ % $ $& "$%% " $ '$ " '
 ! " This section of the course covers techniques for pairwise (i.e., scanto-scan) and global (i.e., involving more than 2 scans) alignment, given that the algorithms are constrained to obtain a rigid-body
Möbius Transformations in Scientific Computing. David Eppstein
 Möbius Transformations in Scientific Computing David Eppstein Univ. of California, Irvine School of Information and Computer Science (including joint work with Marshall Bern from WADS 01 and SODA 03) Outline
A THINNING ALGORITHM FOR TOPOLOGICALLY CORRECT 3D SURFACE RECONSTRUCTION
 A THINNING ALGORITHM FOR TOPOLOGICALLY CORRECT 3D SURFACE RECONSTRUCTION Leonid Tcherniavski Department of Informatics University of Hamburg tcherniavski@informatik.uni-hamburg.de ABSTRACT The existing
Voronoi Diagram. Xiao-Ming Fu
 Voronoi Diagram Xiao-Ming Fu Outlines Introduction Post Office Problem Voronoi Diagram Duality: Delaunay triangulation Centroidal Voronoi tessellations (CVT) Definition Applications Algorithms Outlines
03 - Reconstruction. Acknowledgements: Olga Sorkine-Hornung. CSCI-GA Geometric Modeling - Spring 17 - Daniele Panozzo
 3 - Reconstruction Acknowledgements: Olga Sorkine-Hornung Geometry Acquisition Pipeline Scanning: results in range images Registration: bring all range images to one coordinate system Stitching/ reconstruction:
Mesh Generation. Jean-Daniel Boissonnat DataShape, INRIA
 Mesh Generation Jean-Daniel Boissonnat DataShape, INRIA http://www-sop.inria.fr/datashape Algorithmic Geometry Mesh generation J-D. Boissonnat 1 / 27 Meshing surfaces and 3D domains visualization and graphics
Computational Geometry
 More on Voronoi diagrams 1 Can we move a disc from one location to another amidst obstacles? 2 Since the Voronoi diagram of point sites is locally furthest away from those sites, we can move the disc if
Feature Detectors and Descriptors: Corners, Lines, etc.
 Feature Detectors and Descriptors: Corners, Lines, etc. Edges vs. Corners Edges = maxima in intensity gradient Edges vs. Corners Corners = lots of variation in direction of gradient in a small neighborhood
Smooth Surface Reconstruction from Noisy Clouds
 Smooth Surface Reconstruction from Noisy Clouds Boris Mederos, Luiz Velho and Luiz Henrique de Figueiredo IMPA Instituto de Matemática Pura e Aplicada, Estrada Dona Castorina 110, 22461-320 Rio de Janeiro,
Machine Learning and Pervasive Computing
 Stephan Sigg Georg-August-University Goettingen, Computer Networks 17.12.2014 Overview and Structure 22.10.2014 Organisation 22.10.3014 Introduction (Def.: Machine learning, Supervised/Unsupervised, Examples)
Learning Task: Exploring Reflections and Rotations
 Learning Task: Exploring Reflections and Rotations Name Date Mathematical Goals Develop and demonstrate an understanding of reflections and rotations of figures in general and on a coordinate plane. Essential
Non-Parametric Modeling
 Non-Parametric Modeling CE-725: Statistical Pattern Recognition Sharif University of Technology Spring 2013 Soleymani Outline Introduction Non-Parametric Density Estimation Parzen Windows Kn-Nearest Neighbor
CS133 Computational Geometry
 CS133 Computational Geometry Voronoi Diagram Delaunay Triangulation 5/17/2018 1 Nearest Neighbor Problem Given a set of points P and a query point q, find the closest point p P to q p, r P, dist p, q dist(r,
GEOMETRIC TOOLS FOR COMPUTER GRAPHICS
 GEOMETRIC TOOLS FOR COMPUTER GRAPHICS PHILIP J. SCHNEIDER DAVID H. EBERLY MORGAN KAUFMANN PUBLISHERS A N I M P R I N T O F E L S E V I E R S C I E N C E A M S T E R D A M B O S T O N L O N D O N N E W
Chapter 4 Foundations And Representations ' 4
 Chapter 4 Foundations And Representations w
The Capacity of Wireless Networks
 The Capacity of Wireless Networks Piyush Gupta & P.R. Kumar Rahul Tandra --- EE228 Presentation Introduction We consider wireless networks without any centralized control. Try to analyze the capacity of
Lecture 6 Introduction to Numerical Geometry. Lin ZHANG, PhD School of Software Engineering Tongji University Spring 2018
 Lecture 6 Introduction to Numerical Geometry Lin ZHANG, PhD School of Software Engineering Tongji University Spring 2018 Outline Introduction Basic concepts in geometry Discrete geometry Metric for discrete
Data Mining 4. Cluster Analysis
 Data Mining 4. Cluster Analysis 4.5 Spring 2010 Instructor: Dr. Masoud Yaghini Introduction DBSCAN Algorithm OPTICS Algorithm DENCLUE Algorithm References Outline Introduction Introduction Density-based
DiFi: Distance Fields - Fast Computation Using Graphics Hardware
 DiFi: Distance Fields - Fast Computation Using Graphics Hardware Avneesh Sud Dinesh Manocha UNC-Chapel Hill http://gamma.cs.unc.edu/difi Distance Fields Distance Function For a site a scalar function f:r
Correspondence. CS 468 Geometry Processing Algorithms. Maks Ovsjanikov
 Shape Matching & Correspondence CS 468 Geometry Processing Algorithms Maks Ovsjanikov Wednesday, October 27 th 2010 Overall Goal Given two shapes, find correspondences between them. Overall Goal Given
VoroCrust: Simultaneous Surface Reconstruction and Volume Meshing with Voronoi cells
 VoroCrust: Simultaneous Surface Reconstruction and Volume Meshing with Voronoi cells Scott A. Mitchell (speaker), joint work with Ahmed H. Mahmoud, Ahmad A. Rushdi, Scott A. Mitchell, Ahmad Abdelkader
Point Cloud Processing
 Point Cloud Processing Has anyone seen the toothpaste? Given a point cloud: how do you detect and localize objects? how do you map terrain? What is a point cloud? Point cloud: a set of points in 3-D space
Geometric Representations. Stelian Coros
 Geometric Representations Stelian Coros Geometric Representations Languages for describing shape Boundary representations Polygonal meshes Subdivision surfaces Implicit surfaces Volumetric models Parametric
Spectral Clustering. Presented by Eldad Rubinstein Based on a Tutorial by Ulrike von Luxburg TAU Big Data Processing Seminar December 14, 2014
 Spectral Clustering Presented by Eldad Rubinstein Based on a Tutorial by Ulrike von Luxburg TAU Big Data Processing Seminar December 14, 2014 What are we going to talk about? Introduction Clustering and
Instance-based Learning CE-717: Machine Learning Sharif University of Technology. M. Soleymani Fall 2015
 Instance-based Learning CE-717: Machine Learning Sharif University of Technology M. Soleymani Fall 2015 Outline Non-parametric approach Unsupervised: Non-parametric density estimation Parzen Windows K-Nearest
Lifting Transform, Voronoi, Delaunay, Convex Hulls
 Lifting Transform, Voronoi, Delaunay, Convex Hulls Subhash Suri Department of Computer Science University of California Santa Barbara, CA 93106 1 Lifting Transform (A combination of Pless notes and my
Geodesics in heat: A new approach to computing distance
 Geodesics in heat: A new approach to computing distance based on heat flow Diana Papyan Faculty of Informatics - Technische Universität München Abstract In this report we are going to introduce new method
Chapter 11 Arc Extraction and Segmentation
 Chapter 11 Arc Extraction and Segmentation 11.1 Introduction edge detection: labels each pixel as edge or no edge additional properties of edge: direction, gradient magnitude, contrast edge grouping: edge
Surface segmentation for improved isotropic remeshing
 J. Edwards (Univ. of Texas) IMR 2012 1 / 20 Surface segmentation for improved isotropic remeshing John Edwards, Wenping Wang, Chandrajit Bajaj Department of Computer Science The University of Texas at
Algorithm research of 3D point cloud registration based on iterative closest point 1
 Acta Technica 62, No. 3B/2017, 189 196 c 2017 Institute of Thermomechanics CAS, v.v.i. Algorithm research of 3D point cloud registration based on iterative closest point 1 Qian Gao 2, Yujian Wang 2,3,
Approximate Nearest Neighbor Problem: Improving Query Time CS468, 10/9/2006
 Approximate Nearest Neighbor Problem: Improving Query Time CS468, 10/9/2006 Outline Reducing the constant from O ( ɛ d) to O ( ɛ (d 1)/2) in uery time Need to know ɛ ahead of time Preprocessing time and
MultiDimensional Signal Processing Master Degree in Ingegneria delle Telecomunicazioni A.A
 MultiDimensional Signal Processing Master Degree in Ingegneria delle Telecomunicazioni A.A. 205-206 Pietro Guccione, PhD DEI - DIPARTIMENTO DI INGEGNERIA ELETTRICA E DELL INFORMAZIONE POLITECNICO DI BARI
Homework 4: Clustering, Recommenders, Dim. Reduction, ML and Graph Mining (due November 19 th, 2014, 2:30pm, in class hard-copy please)
") Virginia Tech. Computer Science CS 5614 (Big) Data Management Systems Fall 2014, Prakash Homework 4: Clustering, Recommenders, Dim. Reduction, ML and Graph Mining (due November 19 th, 2014, 2:30pm, in
Virginia Tech. Computer Science CS 5614 (Big) Data Management Systems Fall 2014, Prakash Homework 4: Clustering, Recommenders, Dim. Reduction, ML and Graph Mining (due November 19 th, 2014, 2:30pm, in
CS443: Digital Imaging and Multimedia Perceptual Grouping Detecting Lines and Simple Curves
 CS443: Digital Imaging and Multimedia Perceptual Grouping Detecting Lines and Simple Curves Spring 2008 Ahmed Elgammal Dept. of Computer Science Rutgers University Outlines Perceptual Grouping and Segmentation
Shape Modeling with Point-Sampled Geometry
 Shape Modeling with Point-Sampled Geometry Mark Pauly Richard Keiser Leif Kobbelt Markus Gross ETH Zürich ETH Zürich RWTH Aachen ETH Zürich Motivation Surface representations Explicit surfaces (B-reps)
Collision Detection. Jane Li Assistant Professor Mechanical Engineering & Robotics Engineering
 RBE 550 MOTION PLANNING BASED ON DR. DMITRY BERENSON S RBE 550 Collision Detection Jane Li Assistant Professor Mechanical Engineering & Robotics Engineering http://users.wpi.edu/~zli11 Euler Angle RBE
Mesh Generation for Aircraft Engines based on the Medial Axis
 Mesh Generation for Aircraft Engines based on the Medial Axis J. Barner, F. Buchegger,, D. Großmann, B. Jüttler Institute of Applied Geometry Johannes Kepler University, Linz, Austria MTU Aero Engines
Machine Learning and Data Mining. Clustering (1): Basics. Kalev Kask
: Basics. Kalev Kask") Machine Learning and Data Mining Clustering (1): Basics Kalev Kask Unsupervised learning Supervised learning Predict target value ( y ) given features ( x ) Unsupervised learning Understand patterns of
Machine Learning and Data Mining Clustering (1): Basics Kalev Kask Unsupervised learning Supervised learning Predict target value ( y ) given features ( x ) Unsupervised learning Understand patterns of
Simulations of the quadrilateral-based localization
 Simulations of the quadrilateral-based localization Cluster success rate v.s. node degree. Each plot represents a simulation run. 9/15/05 Jie Gao CSE590-fall05 1 Random deployment Poisson distribution
Announcements. Edges. Last Lecture. Gradients: Numerical Derivatives f(x) Edge Detection, Lines. Intro Computer Vision. CSE 152 Lecture 10
 Edge Detection, Lines. Intro Computer Vision. CSE 152 Lecture 10") Announcements Assignment 2 due Tuesday, May 4. Edge Detection, Lines Midterm: Thursday, May 6. Introduction to Computer Vision CSE 152 Lecture 10 Edges Last Lecture 1. Object boundaries 2. Surface normal
Announcements Assignment 2 due Tuesday, May 4. Edge Detection, Lines Midterm: Thursday, May 6. Introduction to Computer Vision CSE 152 Lecture 10 Edges Last Lecture 1. Object boundaries 2. Surface normal
Surfaces, meshes, and topology
 Surfaces from Point Samples Surfaces, meshes, and topology A surface is a 2-manifold embedded in 3- dimensional Euclidean space Such surfaces are often approximated by triangle meshes 2 1 Triangle mesh
CSL 859: Advanced Computer Graphics. Dept of Computer Sc. & Engg. IIT Delhi
 CSL 859: Advanced Computer Graphics Dept of Computer Sc. & Engg. IIT Delhi Point Based Representation Point sampling of Surface Mesh construction, or Mesh-less Often come from laser scanning Or even natural
Integral Geometry and the Polynomial Hirsch Conjecture
 Integral Geometry and the Polynomial Hirsch Conjecture Jonathan Kelner, MIT Partially based on joint work with Daniel Spielman Introduction n A lot of recent work on Polynomial Hirsch Conjecture has focused
Surface Reconstruction from Points
 Surface Reconstruction from Points William Y. Chang Department of Computer Science and Engineering University of California, San Diego Abstract This report surveys recent techniques for reconstructing
Voronoi Diagrams and Delaunay Triangulations. O Rourke, Chapter 5
 Voronoi Diagrams and Delaunay Triangulations O Rourke, Chapter 5 Outline Preliminaries Properties and Applications Computing the Delaunay Triangulation Preliminaries Given a function f: R 2 R, the tangent
A Course in Machine Learning
 A Course in Machine Learning Hal Daumé III 13 UNSUPERVISED LEARNING If you have access to labeled training data, you know what to do. This is the supervised setting, in which you have a teacher telling
Moving Least Squares Multiresolution Surface Approximation
 Moving Least Squares Multiresolution Surface Approximation BORIS MEDEROS LUIZ VELHO LUIZ HENRIQUE DE FIGUEIREDO IMPA Instituto de Matemática Pura e Aplicada Estrada Dona Castorina 110, 22461-320 Rio de
Lecture 15: Segmentation (Edge Based, Hough Transform)
") Lecture 15: Segmentation (Edge Based, Hough Transform) c Bryan S. Morse, Brigham Young University, 1998 000 Last modified on February 3, 000 at :00 PM Contents 15.1 Introduction..............................................
Lecture 15: Segmentation (Edge Based, Hough Transform) c Bryan S. Morse, Brigham Young University, 1998 000 Last modified on February 3, 000 at :00 PM Contents 15.1 Introduction..............................................
3D Surface Modeling from Range Curves
 3D Surface Modeling from Range Curves Dragan Tubić, Patrick Hébert and Denis Laurendeau Computer Vision and Systems Laboratory University Laval, Québec, Canada [tdragan,hebert,laurendeau]@gel.ulaval.ca
Geometry Processing & Geometric Queries. Computer Graphics CMU /15-662
 Geometry Processing & Geometric Queries Computer Graphics CMU 15-462/15-662 Last time: Meshes & Manifolds Mathematical description of geometry - simplifying assumption: manifold - for polygon meshes: fans,
Spatial Interpolation & Geostatistics
 (Z i Z j ) 2 / 2 Spatial Interpolation & Geostatistics Lag Lag Mean Distance between pairs of points 11/3/2016 GEO327G/386G, UT Austin 1 Tobler s Law All places are related, but nearby places are related
Collision detection for Point Clouds
 Collision detection for Point Clouds Gabriel Zachmann Bonn University zach@cs.uni-bonn.de Motivation Modern acquisition techniques (laser scanners) lead to modern object representation Efficient rendering
Shape Modeling. Differential Geometry Primer Smooth Definitions Discrete Theory in a Nutshell. CS 523: Computer Graphics, Spring 2011
 CS 523: Computer Graphics, Spring 2011 Shape Modeling Differential Geometry Primer Smooth Definitions Discrete Theory in a Nutshell 2/15/2011 1 Motivation Geometry processing: understand geometric characteristics,
The Curse of Dimensionality
 The Curse of Dimensionality ACAS 2002 p1/66 Curse of Dimensionality The basic idea of the curse of dimensionality is that high dimensional data is difficult to work with for several reasons: Adding more
The Medial Axis of the Union of Inner Voronoi Balls in the Plane
 The Medial Axis of the Union of Inner Voronoi Balls in the Plane Joachim Giesen a, Balint Miklos b,, Mark Pauly b a Max-Planck Institut für Informatik, Saarbrücken, Germany b Applied Geometry Group, ETH
Lecture 8 Object Descriptors
 Lecture 8 Object Descriptors Azadeh Fakhrzadeh Centre for Image Analysis Swedish University of Agricultural Sciences Uppsala University 2 Reading instructions Chapter 11.1 11.4 in G-W Azadeh Fakhrzadeh
Computer Graphics Ray Casting. Matthias Teschner
 Computer Graphics Ray Casting Matthias Teschner Outline Context Implicit surfaces Parametric surfaces Combined objects Triangles Axis-aligned boxes Iso-surfaces in grids Summary University of Freiburg
3. Voronoi Diagrams. 3.1 Definitions & Basic Properties. Examples :
 3. Voronoi Diagrams Examples : 1. Fire Observation Towers Imagine a vast forest containing a number of fire observation towers. Each ranger is responsible for extinguishing any fire closer to her tower
What is Computer Vision?
 Perceptual Grouping in Computer Vision Gérard Medioni University of Southern California What is Computer Vision? Computer Vision Attempt to emulate Human Visual System Perceive visual stimuli with cameras
Lecture 14 Shape. ch. 9, sec. 1-8, of Machine Vision by Wesley E. Snyder & Hairong Qi. Spring (CMU RI) : BioE 2630 (Pitt)
 : BioE 2630 (Pitt)") Lecture 14 Shape ch. 9, sec. 1-8, 12-14 of Machine Vision by Wesley E. Snyder & Hairong Qi Spring 2018 16-725 (CMU RI) : BioE 2630 (Pitt) Dr. John Galeotti The content of these slides by John Galeotti,
Lecture 14 Shape ch. 9, sec. 1-8, 12-14 of Machine Vision by Wesley E. Snyder & Hairong Qi Spring 2018 16-725 (CMU RI) : BioE 2630 (Pitt) Dr. John Galeotti The content of these slides by John Galeotti,
COMP 175 COMPUTER GRAPHICS. Ray Casting. COMP 175: Computer Graphics April 26, Erik Anderson 09 Ray Casting
 Ray Casting COMP 175: Computer Graphics April 26, 2018 1/41 Admin } Assignment 4 posted } Picking new partners today for rest of the assignments } Demo in the works } Mac demo may require a new dylib I
A Constrained Delaunay Triangle Mesh Method for Three-Dimensional Unstructured Boundary Point Cloud
 International Journal of Computer Systems (ISSN: 2394-1065), Volume 03 Issue 02, February, 2016 Available at http://www.ijcsonline.com/ A Constrained Delaunay Triangle Mesh Method for Three-Dimensional
Instance-Based Learning: Nearest neighbor and kernel regression and classificiation
 Instance-Based Learning: Nearest neighbor and kernel regression and classificiation Emily Fox University of Washington February 3, 2017 Simplest approach: Nearest neighbor regression 1 Fit locally to each
Sensor Tasking and Control
 Sensor Tasking and Control Outline Task-Driven Sensing Roles of Sensor Nodes and Utilities Information-Based Sensor Tasking Joint Routing and Information Aggregation Summary Introduction To efficiently
Probabilistic PPM. Claude Knaus Matthias Zwicker University of Bern. State of the Art in Photon Density Estimation
 Probabilistic PPM Claude Knaus Matthias Zwicker University of Bern State of the Art in Photon Density Estimation Modified slides and presentation by Toshiya Hachisuka Probabilistic PPM Alternative derivation
Computational Topology in Reconstruction, Mesh Generation, and Data Analysis
 Computational Topology in Reconstruction, Mesh Generation, and Data Analysis Tamal K. Dey Department of Computer Science and Engineering The Ohio State University Dey (2014) Computational Topology CCCG
K Nearest Neighbor Wrap Up K- Means Clustering. Slides adapted from Prof. Carpuat
 K Nearest Neighbor Wrap Up K- Means Clustering Slides adapted from Prof. Carpuat K Nearest Neighbor classification Classification is based on Test instance with Training Data K: number of neighbors that
Chapter 4. Clustering Core Atoms by Location
 Chapter 4. Clustering Core Atoms by Location In this chapter, a process for sampling core atoms in space is developed, so that the analytic techniques in section 3C can be applied to local collections
Geometry Spring 2017 Item Release
 Geometry Spring 2017 Item Release 1 Geometry Reporting Category: Congruence and Proof Question 2 16743 20512 Content Cluster: Use coordinates to prove simple geometric theorems algebraically and to verify
Learning Task: Exploring Reflections and Rotations
 Learning Task: Exploring Reflections and Rotations Name Date Mathematical Goals Develop and demonstrate an understanding of reflections and rotations of figures in general and on a coordinate plane. Essential
Network Traffic Measurements and Analysis
 DEIB - Politecnico di Milano Fall, 2017 Introduction Often, we have only a set of features x = x 1, x 2,, x n, but no associated response y. Therefore we are not interested in prediction nor classification,
Lecture 2 The k-means clustering problem
 CSE 29: Unsupervised learning Spring 2008 Lecture 2 The -means clustering problem 2. The -means cost function Last time we saw the -center problem, in which the input is a set S of data points and the
Lecture 16: Computer Vision
 CS4442/9542b: Artificial Intelligence II Prof. Olga Veksler Lecture 16: Computer Vision Motion Slides are from Steve Seitz (UW), David Jacobs (UMD) Outline Motion Estimation Motion Field Optical Flow Field
Biometrics Technology: Image Processing & Pattern Recognition (by Dr. Dickson Tong)
") Biometrics Technology: Image Processing & Pattern Recognition (by Dr. Dickson Tong) References: [1] http://homepages.inf.ed.ac.uk/rbf/hipr2/index.htm [2] http://www.cs.wisc.edu/~dyer/cs540/notes/vision.html
Biometrics Technology: Image Processing & Pattern Recognition (by Dr. Dickson Tong) References: [1] http://homepages.inf.ed.ac.uk/rbf/hipr2/index.htm [2] http://www.cs.wisc.edu/~dyer/cs540/notes/vision.html