Large Scale Data Visualization. CSC 7443: Scientific Information Visualization
|
|
|
- Emory Allen
- 6 years ago
- Views:
Transcription
1 Large Scale Data Visualization
2 Large Datasets Large datasets: D >> 10 M D D: Hundreds of gigabytes to terabytes and even petabytes M D : 1 to 4 GB of RAM Examples: Single large data set Time-varying data set Multiple data sets Interactivity is important Hz >> animation playback Min 10 Hz >> update rate of hand-eye interaction The slowest is processing user request 10 sec is the target for the interactive system >> with large datasets it can reach up to minutes
3 Techniques for Large Scale Datasets Data streaming Processing subset of the larger dataset Task parallelism Independent modules execute in parallel, user needs to identify the number of independent tasks Pipeline parallelism Modules execute in parallel but on independent subsets of data Data parallelism Code within each module of the application execute in parallel Hybrid methods: Combination of the above techniques can be used
4 Data Streaming Sometimes this is the only approach when data exceeds the available computational resources
5 Task Parallelism
6 Pipeline Parallelism Task A, D and E are all operating on different portions of data This approach is best suited for situations where there are multiple, heterogeneous tasks The advantage of this approach is that it allows parallel use of the overall computing resources
7 Solution Techniques
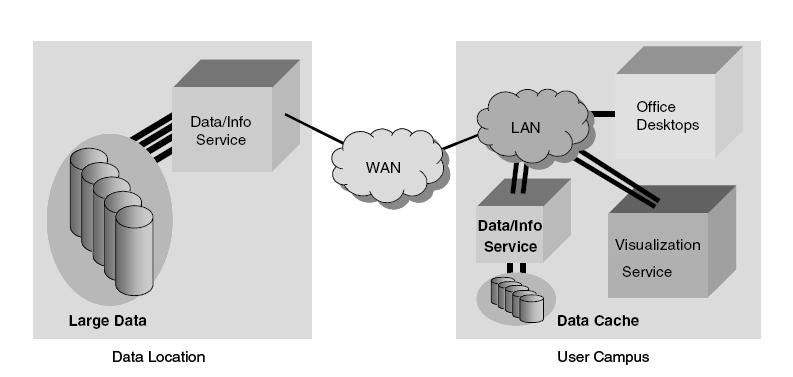
8 Desktop Delivery System How to enable the visualization of large scale datasets on the desktop? Desktop delivery is one solution (bringing information to the user) Issues Size of the data Desktop capabilities Level of interaction desired Network issues Computing power needed

9 Effect of Data Size on DDS
10 Visualization for DDS
11 Remote Visualization A schematic view of visualization pipeline Data/ Image Filtering Transform Mapping Rendering Display Server Client Fixed type of data exchange mechanism Fat client or fat server model Dynamic client-server paradigm: Choose the data types (e.g, geometric primitives, framebuffer or final images) to be sent to the client.
12 Adaptive Network Mapping Optimal visualization pipeline decomposition and adaptive network mapping G 1 G 2 G q-1 G q M 1 M u-1 M u M v-1 M w M w-1 M x M n+1 S Server N 2 N q-1 C Nodes Client Network conditions: Bandwidth and node characteristics Mapping: Organize pipeline modules into groups and dynamically assign them to network nodes

13 Amira Web-Based Services

14 HTML Interface
15 Time Varying Data Examples: CFD, MD, Neuron excitement, Evolution of a thunderstorm, Seismic reflection from geological strata Generally, multiple values are stored at each data point A single dataset can require hundreds of gigabytes to terabytes of storage space Rendering of time-varying data: Reading of large files continuously or periodically throughout the course of the visualization process Improvements Encoding the data, Hardware decoding of data, Modern GPU, Parallelization of process, Image compression
 64 sets of scalar volume data with size of 256 3 and")
16 Multiple Datasets Visualization (MDV) MDV represents simultaneous visualization and analysis of multiple sets of data Scalable adaptive isosurface extraction (AIM and OPIM) 64 sets of scalar volume data with size of and 512 3

17 MDV Example Twenty five sets of the scalar volume data of size in a planer clipped mode using 3D surface texture mapping The data represent the electron density distributions in liquid MgO calculated as a function of the simulation time Multi-scale color map: Blue: density from 0 to 0.05 Blue and green: density from 0.05 to 0.5 Red: density above 0.5

18 MDV: Component-Based Isosurface Extraction Components are disjoint geometric parts of isosurfaces Process a subset of isosurface components selected based on interdataset coherency User-defined thresholds Only dissimilar components from different datasets processed completely Two advantages Crack-free isosurfaces Effective in identifying interesting structural differences and suppressing the noises Isosurface comprised of many spatially disjoint components; Different components correspond to electron distributions around different atomic sites.
19 Data Coherency Approach Data coherency is a measure of similarity between datasets Exploit data coherency at the level of individual voxels and components Divide datasets into two categories: Reference dataset (RDS) and Nonreference dataset (NRDS) Considering two datasets: one RDS and NRDS RDS isosurface extraction is performed and the polygons are used subsequently to also represent parts of the NRDS isosurfaces For NRDS, isosurface extraction is performed only for those voxels which significantly differ from the corresponding RDS voxels; the polygons in other voxels are simply retrieved from RDS
 at some octree level")

20 Inter-Dataset Coherency Method Data 1 Data 2 Compare each data volume with reference volume(s) at some octree level Only dissimilar octree nodes are processed for polygon generation Polygon data are stored on per node basis. Data 2
21 Processing RDS Completely process RDS for isosurface extraction Polygons are subsequently used to also represent parts of NRDS isosurfaces Find the components and extract the corresponding polygons Construct a map representing the relationship between voxels and the components: RDS.map[v i ]
22 Processing NRDS Compute voxel difference: vox.diff Pick up unprocessed significant voxel and find its component: vox.diff > threshold1 Extract polygons of the component if it contains sufficiently many significant voxels (nsv): nsv > threshold2 nv where nv is the number of voxels in a given component Retrieve the polygons of the component from RDS if no new polygons are extracted in corresponding regions of NRDS Overlap between RDS and NRDS is large (as determined by threshold3) Repeat until all significant voxels have been visited

23 RDS and NRDS Isosurfaces NRDS isosurfaces approximated using our approach Electron density isosurfaces Exact RDS Isovalue Approx NRDS Exact NRDS Blue components belong to RDS Red components are directly extracted from NRDS and white ones common to both are extracted from RDS Some disjoint (blue) components merge to new (red) component in NRDS 0.023
24 Performance Results As threshold1 with threshold2 and threshold3 fixed at 0.25 decreases, more voxels in NRDS turn into significant voxels If we increase threshold2, some components are discarded so less overhead in polygon extraction Threshold3 involves only retrieval of polygon data for rendering Electron density isosurfaces vary with isovalue

25 On the Fly Isosurface Extraction Do not assume data coherency Use simple shapes (bounding boxes) to represent components from both datasets Polygons are extracted once users select regions of interest Isosurfaces extracted in large yellow box in the bottom left of the top right window
DiFi: Distance Fields - Fast Computation Using Graphics Hardware
 DiFi: Distance Fields - Fast Computation Using Graphics Hardware Avneesh Sud Dinesh Manocha UNC-Chapel Hill http://gamma.cs.unc.edu/difi Distance Fields Distance Function For a site a scalar function f:r
Isosurface Rendering. CSC 7443: Scientific Information Visualization
 Isosurface Rendering What is Isosurfacing? An isosurface is the 3D surface representing the locations of a constant scalar value within a volume A surface with the same scalar field value Isosurfaces form
Clipping. CSC 7443: Scientific Information Visualization
 Clipping Clipping to See Inside Obscuring critical information contained in a volume data Contour displays show only exterior visible surfaces Isosurfaces can hide other isosurfaces Other displays can
EXPLOITING DATA COHERENCY IN MULTIPLE DATASET VISUALIZATION
 EXPLOITING DATA COHERENCY IN MULTIPLE DATASET VISUALIZATION Gaurav Khanduja and Bijaya B. Karki Department of Computer Science, Louisiana State University Baton Rouge, LA USA gkhand1@lsu.edu and karki@csc.lsu.edu
Parallel Rendering. Johns Hopkins Department of Computer Science Course : Rendering Techniques, Professor: Jonathan Cohen
 Parallel Rendering Molnar, Cox, Ellsworth, and Fuchs. A Sorting Classification of Parallel Rendering. IEEE Computer Graphics and Applications. July, 1994. Why Parallelism Applications need: High frame
Iso-surface cell search. Iso-surface Cells. Efficient Searching. Efficient search methods. Efficient iso-surface cell search. Problem statement:
 Iso-Contouring Advanced Issues Iso-surface cell search 1. Efficiently determining which cells to examine. 2. Using iso-contouring as a slicing mechanism 3. Iso-contouring in higher dimensions 4. Texturing
SCIENTIFIC VISUALIZATION ON GPU CLUSTERS PETER MESSMER, NVIDIA
 SCIENTIFIC VISUALIZATION ON GPU CLUSTERS PETER MESSMER, NVIDIA Visualization Rendering Visualization Isosurfaces, Isovolumes Field Operators (Gradient, Curl,.. ) Coordinate transformations Feature extraction
Volume visualization. Volume visualization. Volume visualization methods. Sources of volume visualization. Sources of volume visualization
 Volume visualization Volume visualization Volumes are special cases of scalar data: regular 3D grids of scalars, typically interpreted as density values. Each data value is assumed to describe a cubic
Patent Image Retrieval
 Patent Image Retrieval Stefanos Vrochidis IRF Symposium 2008 Vienna, November 6, 2008 Aristotle University of Thessaloniki Overview 1. Introduction 2. Related Work in Patent Image Retrieval 3. Patent Image
CS GPU and GPGPU Programming Lecture 2: Introduction; GPU Architecture 1. Markus Hadwiger, KAUST
 CS 380 - GPU and GPGPU Programming Lecture 2: Introduction; GPU Architecture 1 Markus Hadwiger, KAUST Reading Assignment #2 (until Feb. 17) Read (required): GLSL book, chapter 4 (The OpenGL Programmable
Rasterization Overview
 Rendering Overview The process of generating an image given a virtual camera objects light sources Various techniques rasterization (topic of this course) raytracing (topic of the course Advanced Computer
Massive Dataset Visualization
 Massive Dataset Visualization Aiichiro Nakano Collaboratory for Advanced Computing & Simulations Dept. of Computer Science, Dept. of Physics & Astronomy, Dept. of Chemical Engineering & Materials Science,
Indirect Volume Rendering
 Indirect Volume Rendering Visualization Torsten Möller Weiskopf/Machiraju/Möller Overview Contour tracing Marching cubes Marching tetrahedra Optimization octree-based range query Weiskopf/Machiraju/Möller
An Efficient Approach for Emphasizing Regions of Interest in Ray-Casting based Volume Rendering
 An Efficient Approach for Emphasizing Regions of Interest in Ray-Casting based Volume Rendering T. Ropinski, F. Steinicke, K. Hinrichs Institut für Informatik, Westfälische Wilhelms-Universität Münster
Interactive Isosurface Ray Tracing of Large Octree Volumes
 Interactive Isosurface Ray Tracing of Large Octree Volumes Aaron Knoll, Ingo Wald, Steven Parker, and Charles Hansen Scientific Computing and Imaging Institute University of Utah 2006 IEEE Symposium on
Scientific Visualization. CSC 7443: Scientific Information Visualization
 Scientific Visualization Scientific Datasets Gaining insight into scientific data by representing the data by computer graphics Scientific data sources Computation Real material simulation/modeling (e.g.,
Visualization of Very Large Oceanography Time-Varying Volume Datasets
 Visualization of Very Large Oceanography Time-Varying Volume Datasets Sanghun Park 1, Chandrajit Bajaj 2, and Insung Ihm 3 1 School of Comp. & Info. Comm. Engineering, Catholic University of Daegu Gyungbuk
3D Polygon Rendering. Many applications use rendering of 3D polygons with direct illumination
 Rendering Pipeline 3D Polygon Rendering Many applications use rendering of 3D polygons with direct illumination 3D Polygon Rendering What steps are necessary to utilize spatial coherence while drawing
Scalar Algorithms: Contouring
 Scalar Algorithms: Contouring Computer Animation and Visualisation Lecture tkomura@inf.ed.ac.uk Institute for Perception, Action & Behaviour School of Informatics Contouring Scaler Data Last Lecture...
The Rendering Pipeline
 The Rendering Pipeline Framebuffers Framebuffer is the interface between the device and the computer s notion of an image A memory array in which the computer stores an image On most computers, separate
CS 563 Advanced Topics in Computer Graphics QSplat. by Matt Maziarz
 CS 563 Advanced Topics in Computer Graphics QSplat by Matt Maziarz Outline Previous work in area Background Overview In-depth look File structure Performance Future Point Rendering To save on setup and
28 out of 28 images calibrated (100%), all images enabled. 0.02% relative difference between initial and optimized internal camera parameters
, all images enabled. 0.02% relative difference between initial and optimized internal camera parameters") Dronedata Render Server Generated Quality Report Phase 1 Time 00h:01m:56s Phase 2 Time 00h:04m:35s Phase 3 Time 00h:13m:45s Total Time All Phases 00h:20m:16s Generated with Pix4Dmapper Pro - TRIAL version
Dronedata Render Server Generated Quality Report Phase 1 Time 00h:01m:56s Phase 2 Time 00h:04m:35s Phase 3 Time 00h:13m:45s Total Time All Phases 00h:20m:16s Generated with Pix4Dmapper Pro - TRIAL version
Simple Silhouettes for Complex Surfaces
 Eurographics Symposium on Geometry Processing(2003) L. Kobbelt, P. Schröder, H. Hoppe (Editors) Simple Silhouettes for Complex Surfaces D. Kirsanov, P. V. Sander, and S. J. Gortler Harvard University Abstract
high performance medical reconstruction using stream programming paradigms
 high performance medical reconstruction using stream programming paradigms This Paper describes the implementation and results of CT reconstruction using Filtered Back Projection on various stream programming
Chapter 2: From Graphics to Visualization
 Exercises for Chapter 2: From Graphics to Visualization 1 EXERCISE 1 Consider the simple visualization example of plotting a graph of a two-variable scalar function z = f (x, y), which is discussed in
Visualization. Images are used to aid in understanding of data. Height Fields and Contours Scalar Fields Volume Rendering Vector Fields [chapter 26]
![Visualization. Images are used to aid in understanding of data. Height Fields and Contours Scalar Fields Volume Rendering Vector Fields [chapter 26]](/thumbs/74/70771954.jpg "Visualization. Images are used to aid in understanding of data. Height Fields and Contours Scalar Fields Volume Rendering Vector Fields [chapter 26]") Visualization Images are used to aid in understanding of data Height Fields and Contours Scalar Fields Volume Rendering Vector Fields [chapter 26] Tumor SCI, Utah Scientific Visualization Visualize large
Visualization Images are used to aid in understanding of data Height Fields and Contours Scalar Fields Volume Rendering Vector Fields [chapter 26] Tumor SCI, Utah Scientific Visualization Visualize large
CIS 4930/ SCIENTIFICVISUALIZATION
 CIS 4930/6930-902 SCIENTIFICVISUALIZATION ISOSURFACING Paul Rosen Assistant Professor University of South Florida slides credits Tricoche and Meyer ADMINISTRATIVE Read (or watch video): Kieffer et al,
E.Order of Operations
 Appendix E E.Order of Operations This book describes all the performed between initial specification of vertices and final writing of fragments into the framebuffer. The chapters of this book are arranged
Laptop Generated Quality Report Phase 1 Time 00h:26m:45s Phase 2 Time 02h:30m:06s Phase 3 Time 01h:20m:19s Total Time All phases 04h:17m:10s
 Laptop Generated Quality Report Phase 1 Time 00h:26m:45s Phase 2 Time 02h:30m:06s Phase 3 Time 01h:20m:19s Total Time All phases 04h:17m:10s Generated with Pix4Dmapper Pro - TRIAL version 2.0.104 Important:
Egemen Tanin, Tahsin M. Kurc, Cevdet Aykanat, Bulent Ozguc. Abstract. Direct Volume Rendering (DVR) is a powerful technique for
 is a powerful technique for") Comparison of Two Image-Space Subdivision Algorithms for Direct Volume Rendering on Distributed-Memory Multicomputers Egemen Tanin, Tahsin M. Kurc, Cevdet Aykanat, Bulent Ozguc Dept. of Computer Eng. and
Comparison of Two Image-Space Subdivision Algorithms for Direct Volume Rendering on Distributed-Memory Multicomputers Egemen Tanin, Tahsin M. Kurc, Cevdet Aykanat, Bulent Ozguc Dept. of Computer Eng. and
Paris-Le Bourget Airport. 557 out of 557 images calibrated (100%), all images enabled
, all images enabled") DroneData Render Server Generated Quality Report Phase 1 Time 00h:27m:34s Phase 2 Time 01h:40m:23s Phase 3 Time 01h:41m:18s Total Time All Phases 03h:48m:59s Generated with Pix4Dmapper Pro - TRIAL version
DroneData Render Server Generated Quality Report Phase 1 Time 00h:27m:34s Phase 2 Time 01h:40m:23s Phase 3 Time 01h:41m:18s Total Time All Phases 03h:48m:59s Generated with Pix4Dmapper Pro - TRIAL version
Visualization Computer Graphics I Lecture 20
 15-462 Computer Graphics I Lecture 20 Visualization Height Fields and Contours Scalar Fields Volume Rendering Vector Fields [Angel Ch. 12] November 20, 2003 Doug James Carnegie Mellon University http://www.cs.cmu.edu/~djames/15-462/fall03
Real-Time Rendering (Echtzeitgraphik) Michael Wimmer
 Michael Wimmer") Real-Time Rendering (Echtzeitgraphik) Michael Wimmer wimmer@cg.tuwien.ac.at Walking down the graphics pipeline Application Geometry Rasterizer What for? Understanding the rendering pipeline is the key
Real-Time Rendering (Echtzeitgraphik) Michael Wimmer wimmer@cg.tuwien.ac.at Walking down the graphics pipeline Application Geometry Rasterizer What for? Understanding the rendering pipeline is the key
Visualization and VR for the Grid
 Visualization and VR for the Grid Chris Johnson Scientific Computing and Imaging Institute University of Utah Computational Science Pipeline Construct a model of the physical domain (Mesh Generation, CAD)
Challenges and Opportunities in using Software-Defined Visualization in MegaMol
 Challenges and Opportunities in using Software-Defined Visualization in MegaMol Tobias Rau, Patrick Gralka, Michael Krone, Guido Reina, Thomas Ertl IXPUG Bologna 2018-03-06 The MegaMol Visualization Framework
Near-Infrared Dataset. 101 out of 101 images calibrated (100%), all images enabled
, all images enabled") Dronedata Back Office Server Generated Quality Report Phase 1 Time 01h:22m:16s Phase 2 Time 00h:11m:39s Phase 3 Time 00h:01m:40s Total Time All Phases 01:35m:35s Generated with Pix4Dmapper Pro - TRIAL
Dronedata Back Office Server Generated Quality Report Phase 1 Time 01h:22m:16s Phase 2 Time 00h:11m:39s Phase 3 Time 00h:01m:40s Total Time All Phases 01:35m:35s Generated with Pix4Dmapper Pro - TRIAL
Scalar Visualization
 Scalar Visualization Visualizing scalar data Popular scalar visualization techniques Color mapping Contouring Height plots outline Recap of Chap 4: Visualization Pipeline 1. Data Importing 2. Data Filtering
CS130 : Computer Graphics Lecture 2: Graphics Pipeline. Tamar Shinar Computer Science & Engineering UC Riverside
 CS130 : Computer Graphics Lecture 2: Graphics Pipeline Tamar Shinar Computer Science & Engineering UC Riverside Raster Devices and Images Raster Devices - raster displays show images as a rectangular array
Overview and Introduction to Scientific Visualization. Texas Advanced Computing Center The University of Texas at Austin
 Overview and Introduction to Scientific Visualization Texas Advanced Computing Center The University of Texas at Austin Scientific Visualization The purpose of computing is insight not numbers. -- R. W.
Ray Tracing. Computer Graphics CMU /15-662, Fall 2016
 Ray Tracing Computer Graphics CMU 15-462/15-662, Fall 2016 Primitive-partitioning vs. space-partitioning acceleration structures Primitive partitioning (bounding volume hierarchy): partitions node s primitives
Progressive Visualization of Large Data Sets. Aim: Introduction: ViSUS: Volume Renderer: 1 Abhishek Tripathi (U )
") 1 Abhishek Tripathi (U0562967) Progressive Visualization of Large Data Sets Aim: The project aims at effectively visualizing very large data sets, typically, above the Gigabyte range.such data sets are
1 Abhishek Tripathi (U0562967) Progressive Visualization of Large Data Sets Aim: The project aims at effectively visualizing very large data sets, typically, above the Gigabyte range.such data sets are
Height Fields and Contours Scalar Fields Volume Rendering Vector Fields [Angel Ch. 12] April 23, 2002 Frank Pfenning Carnegie Mellon University
![Height Fields and Contours Scalar Fields Volume Rendering Vector Fields [Angel Ch. 12] April 23, 2002 Frank Pfenning Carnegie Mellon University](/thumbs/90/102611276.jpg "Height Fields and Contours Scalar Fields Volume Rendering Vector Fields [Angel Ch. 12] April 23, 2002 Frank Pfenning Carnegie Mellon University") 15-462 Computer Graphics I Lecture 21 Visualization Height Fields and Contours Scalar Fields Volume Rendering Vector Fields [Angel Ch. 12] April 23, 2002 Frank Pfenning Carnegie Mellon University http://www.cs.cmu.edu/~fp/courses/graphics/
15-462 Computer Graphics I Lecture 21 Visualization Height Fields and Contours Scalar Fields Volume Rendering Vector Fields [Angel Ch. 12] April 23, 2002 Frank Pfenning Carnegie Mellon University http://www.cs.cmu.edu/~fp/courses/graphics/
Viewport 2.0 API Porting Guide for Locators
 Viewport 2.0 API Porting Guide for Locators Introduction This document analyzes the choices for porting plug-in locators (MPxLocatorNode) to Viewport 2.0 mostly based on the following factors. Portability:
11/1/13. Visualization. Scientific Visualization. Types of Data. Height Field. Contour Curves. Meshes
 CSCI 420 Computer Graphics Lecture 26 Visualization Height Fields and Contours Scalar Fields Volume Rendering Vector Fields [Angel Ch. 2.11] Jernej Barbic University of Southern California Scientific Visualization
Visualization. CSCI 420 Computer Graphics Lecture 26
 CSCI 420 Computer Graphics Lecture 26 Visualization Height Fields and Contours Scalar Fields Volume Rendering Vector Fields [Angel Ch. 11] Jernej Barbic University of Southern California 1 Scientific Visualization
Chapter 7 Multimedia Operating Systems
 MODERN OPERATING SYSTEMS Third Edition ANDREW S. TANENBAUM Chapter 7 Multimedia Operating Systems Introduction To Multimedia (1) Figure 7-1. Video on demand using different local distribution technologies.
Your logo here. October, 2017
 October, 2017 Introduction Thomas Burnett CTO, founder, and primary investigator for FoVI3D. ~15 years experience developing rendering solutions and architectures for static and dynamic lightfield display
Graphics Hardware. Instructor Stephen J. Guy
 Instructor Stephen J. Guy Overview What is a GPU Evolution of GPU GPU Design Modern Features Programmability! Programming Examples Overview What is a GPU Evolution of GPU GPU Design Modern Features Programmability!
Wed, October 12, 2011
 Practical Occlusion Culling in Killzone 3 Michal Valient Lead Tech, Guerrilla B.V. Talk takeaway Occlusion culling system used in Killzone 3 The reasons why to use software rasterization (Some) technical
Scalable Video Coding
 Introduction to Multimedia Computing Scalable Video Coding 1 Topics Video On Demand Requirements Video Transcoding Scalable Video Coding Spatial Scalability Temporal Scalability Signal to Noise Scalability
ImageVis3D User's Manual
 ImageVis3D User's Manual 1 1. The current state of ImageVis3D Remember : 1. If ImageVis3D causes any kind of trouble, please report this to us! 2. We are still in the process of adding features to the
9/8/2016. Characteristics of multimedia Various media types
 Chapter 1 Introduction to Multimedia Networking CLO1: Define fundamentals of multimedia networking Upon completion of this chapter students should be able to define: 1- Multimedia 2- Multimedia types and
Visualization with ParaView
 Visualization with Before we begin Make sure you have 3.10.1 installed so you can follow along in the lab section http://paraview.org/paraview/resources/software.html http://www.paraview.org/ Background
Quality Report Generated with Pix4Dmapper Pro version
 Quality Report Generated with Pix4Dmapper Pro version 3.1.23 Important: Click on the different icons for: Help to analyze the results in the Quality Report Additional information about the sections Click
CS130 : Computer Graphics. Tamar Shinar Computer Science & Engineering UC Riverside
 CS130 : Computer Graphics Tamar Shinar Computer Science & Engineering UC Riverside Raster Devices and Images Raster Devices Hearn, Baker, Carithers Raster Display Transmissive vs. Emissive Display anode
Visualization on BioHPC
 Visualization on BioHPC [web] [email] portal.biohpc.swmed.edu biohpc-help@utsouthwestern.edu 1 Updated for 2015-09-16 Outline What is Visualization - Scientific Visualization - Work flow for Visualization
Spring 2010 Prof. Hyesoon Kim. AMD presentations from Richard Huddy and Michael Doggett
 Spring 2010 Prof. Hyesoon Kim AMD presentations from Richard Huddy and Michael Doggett Radeon 2900 2600 2400 Stream Processors 320 120 40 SIMDs 4 3 2 Pipelines 16 8 4 Texture Units 16 8 4 Render Backens
Working with Metal Overview
 Graphics and Games #WWDC14 Working with Metal Overview Session 603 Jeremy Sandmel GPU Software 2014 Apple Inc. All rights reserved. Redistribution or public display not permitted without written permission
Coding for the Network: Scalable and Multiple description coding Marco Cagnazzo
 Coding for the Network: Scalable and Multiple description coding Marco Cagnazzo Overview Examples and motivations Scalable coding for network transmission Techniques for multiple description coding 2 27/05/2013
PROBABILISTIC SCHEDULING MICHAEL ROITZSCH
 Faculty of Computer Science Institute of Systems Architecture, Operating Systems Group PROBABILISTIC SCHEDULING MICHAEL ROITZSCH DESKTOP REAL-TIME 2 PROBLEM worst case execution time (WCET) largely exceeds
What is visualization? Why is it important?
 What is visualization? Why is it important? What does visualization do? What is the difference between scientific data and information data Visualization Pipeline Visualization Pipeline Overview Data acquisition
Overview of Project's Achievements
 PalDMC Parallelised Data Mining Components Final Presentation ESRIN, 12/01/2012 Overview of Project's Achievements page 1 Project Outline Project's objectives design and implement performance optimised,
Computer graphics 2: Graduate seminar in computational aesthetics
 Computer graphics 2: Graduate seminar in computational aesthetics Angus Forbes evl.uic.edu/creativecoding/cs526 Homework 2 RJ ongoing... - Follow the suggestions in the Research Journal handout and find
Visualization Computer Graphics I Lecture 20
 15-462 Computer Graphics I Lecture 20 Visualization Height Fields and Contours Scalar Fields Volume Rendering Vector Fields [Angel Ch. 12] April 15, 2003 Frank Pfenning Carnegie Mellon University http://www.cs.cmu.edu/~fp/courses/graphics/
The Traditional Graphics Pipeline
 Last Time? The Traditional Graphics Pipeline Participating Media Measuring BRDFs 3D Digitizing & Scattering BSSRDFs Monte Carlo Simulation Dipole Approximation Today Ray Casting / Tracing Advantages? Ray
Modeling 3D Objects: Part 2
 Modeling 3D Objects: Part 2 Patches, NURBS, Solids Modeling, Spatial Subdivisioning, and Implicit Functions 3D Computer Graphics by Alan Watt Third Edition, Pearson Education Limited, 2000 General Modeling
ARM Multimedia IP: working together to drive down system power and bandwidth
 ARM Multimedia IP: working together to drive down system power and bandwidth Speaker: Robert Kong ARM China FAE Author: Sean Ellis ARM Architect 1 Agenda System power overview Bandwidth, bandwidth, bandwidth!
Scalability Testing with Login VSI v16.2. White Paper Parallels Remote Application Server 2018
 Scalability Testing with Login VSI v16.2 White Paper Parallels Remote Application Server 2018 Table of Contents Scalability... 3 Testing the Scalability of Parallels RAS... 3 Configurations for Scalability
Georgios Tziritas Computer Science Department
 New Video Coding standards MPEG-4, HEVC Georgios Tziritas Computer Science Department http://www.csd.uoc.gr/~tziritas 1 MPEG-4 : introduction Motion Picture Expert Group Publication 1998 (Intern. Standardization
ImageVis3D "Hands On"-Session
 ImageVis3D "Hands On"-Session Center for Integrative Biomedical Computing 2009 Workshop, Northeastern University 1 1. The current state of ImageVis3D Remember : 1. If you find any problems in ImageVis3D,
Spatial Data Structures
 Spatial Data Structures Hierarchical Bounding Volumes Regular Grids Octrees BSP Trees Constructive Solid Geometry (CSG) [Angel 9.10] Outline Ray tracing review what rays matter? Ray tracing speedup faster
Production. Visual Effects. Fluids, RBD, Cloth. 2. Dynamics Simulation. 4. Compositing
 Visual Effects Pr roduction on the Cell/BE Andrew Clinton, Side Effects Software Visual Effects Production 1. Animation Character, Keyframing 2. Dynamics Simulation Fluids, RBD, Cloth 3. Rendering Raytrac
Do not turn this page over until instructed to do so by the Senior Invigilator.
 CARDIFF CARDIFF UNIVERSITY EXAMINATION PAPER SOLUTIONS Academic Year: 2000-2001 Examination Period: Lent 2001 Examination Paper Number: CMP632 Examination Paper Title: Multimedia Systems Duration: 2 hours
Google Workloads for Consumer Devices: Mitigating Data Movement Bottlenecks Amirali Boroumand
 Google Workloads for Consumer Devices: Mitigating Data Movement Bottlenecks Amirali Boroumand Saugata Ghose, Youngsok Kim, Rachata Ausavarungnirun, Eric Shiu, Rahul Thakur, Daehyun Kim, Aki Kuusela, Allan
Scalar Data. CMPT 467/767 Visualization Torsten Möller. Weiskopf/Machiraju/Möller
 Scalar Data CMPT 467/767 Visualization Torsten Möller Weiskopf/Machiraju/Möller Overview Basic strategies Function plots and height fields Isolines Color coding Volume visualization (overview) Classification
Ray Casting of Trimmed NURBS Surfaces on the GPU
 Ray Casting of Trimmed NURBS Surfaces on the GPU Hans-Friedrich Pabst Jan P. Springer André Schollmeyer Robert Lenhardt Christian Lessig Bernd Fröhlich Bauhaus University Weimar Faculty of Media Virtual
Page 1. Area-Subdivision Algorithms z-buffer Algorithm List Priority Algorithms BSP (Binary Space Partitioning Tree) Scan-line Algorithms
 Scan-line Algorithms") Visible Surface Determination Visibility Culling Area-Subdivision Algorithms z-buffer Algorithm List Priority Algorithms BSP (Binary Space Partitioning Tree) Scan-line Algorithms Divide-and-conquer strategy:
Visible Surface Determination Visibility Culling Area-Subdivision Algorithms z-buffer Algorithm List Priority Algorithms BSP (Binary Space Partitioning Tree) Scan-line Algorithms Divide-and-conquer strategy:
Universiteit Leiden Computer Science
 Universiteit Leiden Computer Science Optimizing octree updates for visibility determination on dynamic scenes Name: Hans Wortel Student-no: 0607940 Date: 28/07/2011 1st supervisor: Dr. Michael Lew 2nd
University of Florida CISE department Gator Engineering. Clustering Part 4
 Clustering Part 4 Dr. Sanjay Ranka Professor Computer and Information Science and Engineering University of Florida, Gainesville DBSCAN DBSCAN is a density based clustering algorithm Density = number of
Scalar Data. Visualization Torsten Möller. Weiskopf/Machiraju/Möller
 Scalar Data Visualization Torsten Möller Weiskopf/Machiraju/Möller Overview Basic strategies Function plots and height fields Isolines Color coding Volume visualization (overview) Classification Segmentation
Scalar Visualization
 Scalar Visualization 5-1 Motivation Visualizing scalar data is frequently encountered in science, engineering, and medicine, but also in daily life. Recalling from earlier, scalar datasets, or scalar fields,
Interactive Implicit Modeling with Hierarchical Spatial Caching
 Interactive Implicit Modeling with Hierarchical Spatial Caching Ryan Schmidt 1, Brian Wyvill 1, Eric Galin 2 1 University of Calgary, Canada 2 LIRIS-CNRS, Université Claude Bernard Lyon 1, France Outline
To 3D or not to 3D? Why GPUs Are Critical for 3D Mass Spectrometry Imaging Eri Rubin SagivTech Ltd.
 To 3D or not to 3D? Why GPUs Are Critical for 3D Mass Spectrometry Imaging Eri Rubin SagivTech Ltd. Established in 2009 and headquartered in Israel Core domain expertise: GPU Computing and Computer Vision
Project Periodic Report Summary
 Project Periodic Report Summary Month 12 Date: 24.7.2014 Grant Agreement number: EU 323567 Project acronym: HARVEST4D Project title: Harvesting Dynamic 3D Worlds from Commodity Sensor Clouds TABLE OF CONTENTS
A Broad Overview of Scientific Visualization with a Focus on Geophysical Turbulence Simulation Data (SciVis
 A Broad Overview of Scientific Visualization with a Focus on Geophysical Turbulence Simulation Data (SciVis 101 for Turbulence Researchers) John Clyne clyne@ucar.edu Examples: Medicine Examples: Biology
3DNSITE: A networked interactive 3D visualization system to simplify location awareness in crisis management
 www.crs4.it/vic/ 3DNSITE: A networked interactive 3D visualization system to simplify location awareness in crisis management Giovanni Pintore 1, Enrico Gobbetti 1, Fabio Ganovelli 2 and Paolo Brivio 2
Clustering Part 4 DBSCAN
 Clustering Part 4 Dr. Sanjay Ranka Professor Computer and Information Science and Engineering University of Florida, Gainesville DBSCAN DBSCAN is a density based clustering algorithm Density = number of
Quality Report Generated with Pro version
 Quality Report Generated with Pro version 2.1.61 Important: Click on the different icons for: Help to analyze the results in the Quality Report Additional information about the sections Click here for
Multi-level Partition of Unity Implicits
 Multi-level Partition of Unity Implicits Diego Salume October 23 rd, 2013 Author: Ohtake, et.al. Overview Goal: Use multi-level partition of unity (MPU) implicit surface to construct surface models. 3
Introduction to Shaders for Visualization. The Basic Computer Graphics Pipeline
 Introduction to Shaders for Visualization Mike Bailey The Basic Computer Graphics Pipeline Model Transform View Transform Per-vertex Lighting Projection Transform Homogeneous Division Viewport Transform
2.11 Particle Systems
 2.11 Particle Systems 320491: Advanced Graphics - Chapter 2 152 Particle Systems Lagrangian method not mesh-based set of particles to model time-dependent phenomena such as snow fire smoke 320491: Advanced
Introduction to scientific visualization with ParaView
 Introduction to scientific visualization with ParaView Paul Melis SURFsara Visualization group paul.melis@surfsara.nl (some slides courtesy of Robert Belleman, UvA) Outline Introduction, pipeline and data
Lecture overview. Visualisatie BMT. Fundamental algorithms. Visualization pipeline. Structural classification - 1. Structural classification - 2
 Visualisatie BMT Fundamental algorithms Arjan Kok a.j.f.kok@tue.nl Lecture overview Classification of algorithms Scalar algorithms Vector algorithms Tensor algorithms Modeling algorithms 1 2 Visualization
Subdivision Of Triangular Terrain Mesh Breckon, Chenney, Hobbs, Hoppe, Watts
 Subdivision Of Triangular Terrain Mesh Breckon, Chenney, Hobbs, Hoppe, Watts MSc Computer Games and Entertainment Maths & Graphics II 2013 Lecturer(s): FFL (with Gareth Edwards) Fractal Terrain Based on
OVER the last several decades, there have. Advances in massive model visualization in the CYBERSAR project
 FINAL WORKSHOP OF GRID PROJECTS, PON RICERCA 2000-2006, AVVISO 1575 1 Advances in massive model visualization in the CYBERSAR project M. Agus 1, F. Bettio 1, F. Marton 1, G. Pintore 1, and A. Zorcolo 1
MASSIVE TIME-LAPSE POINT CLOUD RENDERING with VR
 April 4-7, 2016 Silicon Valley MASSIVE TIME-LAPSE POINT CLOUD RENDERING with VR Innfarn Yoo, OpenGL Chips and Core Markus Schuetz, Professional Visualization Introduction Previous Work AGENDA Methods Progressive
The Bifrost GPU architecture and the ARM Mali-G71 GPU
 The Bifrost GPU architecture and the ARM Mali-G71 GPU Jem Davies ARM Fellow and VP of Technology Hot Chips 28 Aug 2016 Introduction to ARM Soft IP ARM licenses Soft IP cores (amongst other things) to our
Topic 5 Image Compression
 Topic 5 Image Compression Introduction Data Compression: The process of reducing the amount of data required to represent a given quantity of information. Purpose of Image Compression: the reduction of
Using Virtual Texturing to Handle Massive Texture Data
 Using Virtual Texturing to Handle Massive Texture Data San Jose Convention Center - Room A1 Tuesday, September, 21st, 14:00-14:50 J.M.P. Van Waveren id Software Evan Hart NVIDIA How we describe our environment?
Computer Graphics. Rendering. by Brian Wyvill University of Calgary. cpsc/enel P 1
 Computer Graphics Rendering by Brian Wyvill University of Calgary cpsc/enel P Rendering Techniques Wire Frame Z Buffer Ray Tracing A Buffer cpsc/enel P 2 Rendering Visible Surface Determination Many Algorithms,