Digital Elevation Models (DEMs)
|
|
|
- Leslie Hubbard
- 6 years ago
- Views:
Transcription

 They are the modern")
1 Digital Elevation Models (DEM) - Terrain Models (DTM) How has relief depiction on maps and online changed with digital mapping/ GIS?.. Perhaps more than the other map elements / layers Digital Elevation Models (DEMs) A DEM is a continuous grid of elevation values - one height per pixel (grid cell) They are the modern equivalent of terrain previously stored in contours or points 1

 Air Photo - DEM - Shaded relief DEM")

![abstracted from the terrain] stereo photos -> contour](/docs-images/76/73336670/images/2-3.jpg "lines -> digitised lines -> convert to raster GRID")
2 Traditional method : stereo photos > contours -> shaded relief Digital method: digital photos > DEM > contours/shaded relief and also DEM <-> Contours ( topo-raster ) Air Photo - DEM - Shaded relief DEM creation methods A. by digitising contours (e.g. NTS maps -> NTDB layer). [This is 'second hand' digital, as contours are abstracted from the terrain] stereo photos -> contour lines -> digitised lines -> convert to raster GRID (topo to raster) 2

3 DEM creation methods B. Digital stereo-photogrammetry: (e.g. BC TRIM) captured directly from aerial photographs stereo photos -> mass points -> convert to raster GRID (topo to raster) DEM creation methods: C. Direct image grid DEM (> 2000) Stereo digital satellite raster imagery Ikonos 5m 3
 A.")
4 DEM data DEMs have been created at a variety of scales by different agencies. Some can be downloaded free all except the top one in this list AGENCY SCALE TYPICAL RESOLUTION (metres) B. Municipal 1: 5,000 1 B. Provincial 1: 20, A. Federal 1: 50, A. Federal 1: 250, e.g City of PG BC TRIM -> Canadian Digital Elevation Data (CDED) A. Global 1: 1,000, C. Global-SRTM 1: 100, Four DEMs (North Vancouver): 1km (GTOPO30), SRTM (90m); CDED 1:250,000 (100m); CDED 1:50,000 (25m) 4
 Contours Hypsometric Tints Shaded relief (hillshading) Tanaka illuminated contours Slope zones 3D perspectives / Fly")
5 How have DEMs impacted relief depiction? Sugar-loafs and hachures added graphically (not a software option) Contours Hypsometric Tints Shaded relief (hillshading) Tanaka illuminated contours Slope zones 3D perspectives / Fly throughs True 3D Sugar loaf technique: still used to show rough location of mountains (or for old look effect ) added graphically in GIS / graphics software 5
 Contours a routine layer, digitised from")

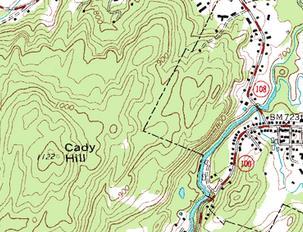
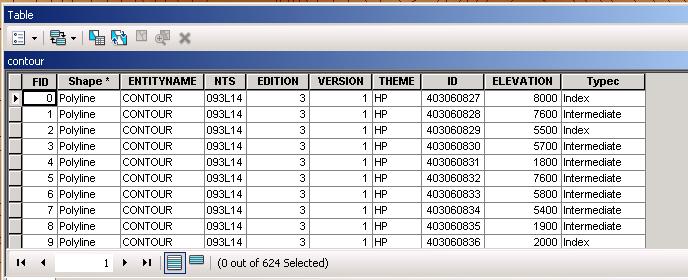
6 Hachures - also added graphically or advanced research (not a routine software option) Contours a routine layer, digitised from maps The National Topographic DataBase (NTDB) is the digital equivalent of the printed maps - download from 6


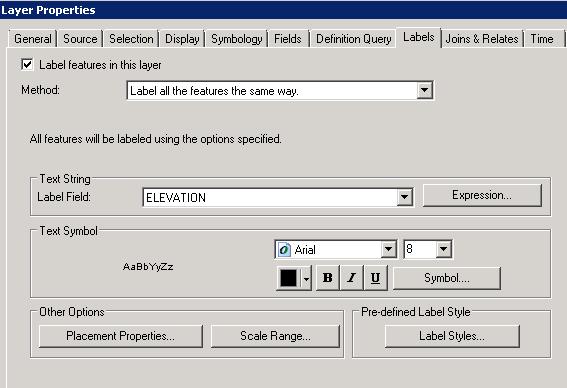
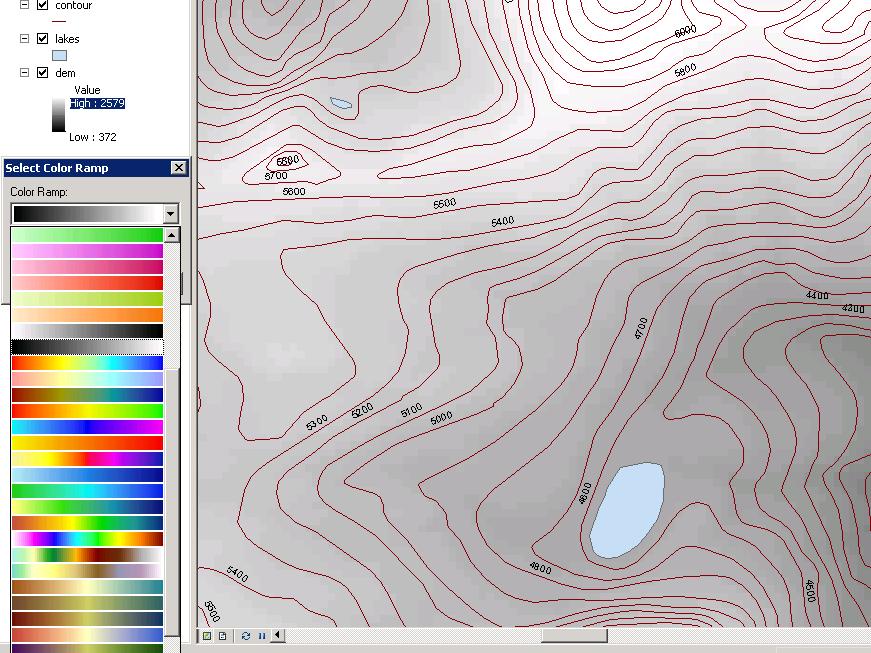
7 Contour lines can be interpolated from DEM heights or pre-exist from digitised maps, and are a standard layer in digital databases and online web mapping for display. Default contour display: ArcMap How can we make contours look more as they should on a map? Change colour to brown Darker/thicker for index contours Label online instead of above line Label only index contours Label each contour only once 7
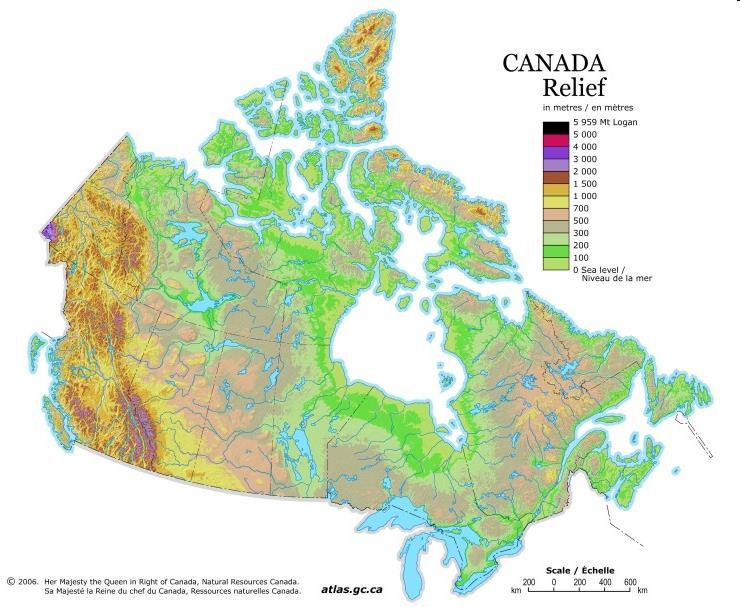
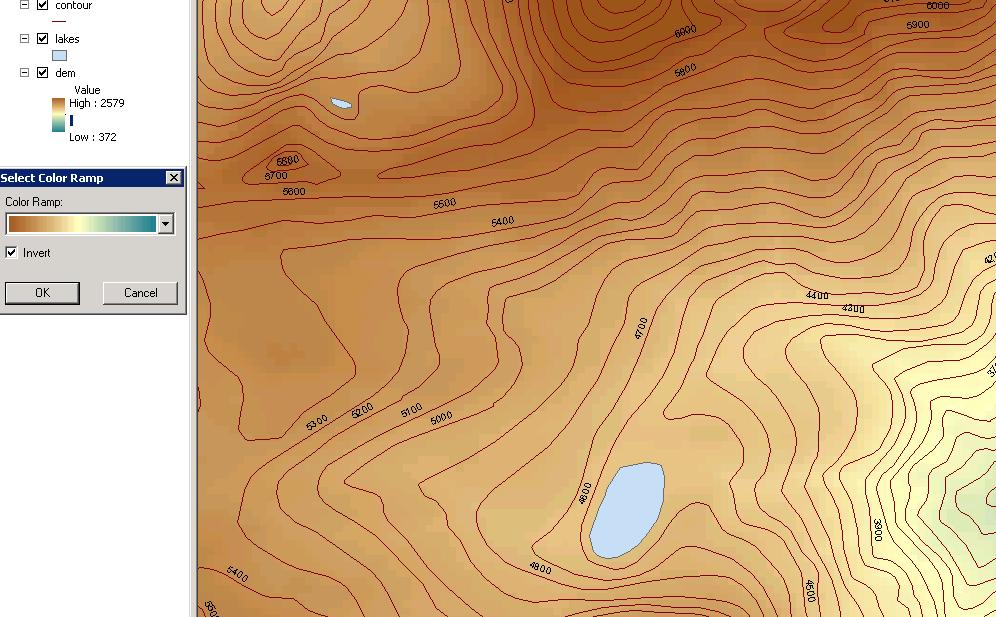
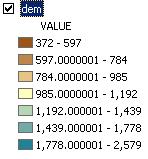
8 Hypsometric Tints Selection of hues, chromas from colour sequences <- legend labels 8
9 9


10 Shaded relief (hillshading) Addition of shading from an imaginary Northwest Light source: No longer does the practitioner require artistic ability. Shaded relief (hillshading) : The user selects azimuth and zenith, 315 and 45 standard to match the NW light source. It is easily generated from the DEM (elevation) but may not be as good as from a skilled artist 10


11 Using the transparency option to combine shading and tints JLC Geomatique addition of shaded relief to topographic maps For BC TRIM maps, see: 11


12 Tanaka relief contours not a common software option Tanaka Contours Forests for the World (applying hillshading to contours) oops! 12
 Slope:Gradient (increasing")
 Google Earth 3D")

13 Slope and aspect layers (mostly for GIS analysis) Slope:Gradient (increasing saturation) Aspect: direction slopes are facing (range of hues) Google Earth 3D perspectives (and flythroughs) Easily generated from DEM / overlay layers in this case, satellite images 13


14 ArcScene The user selects: Viewer location viewing angle vertical exaggeration and overlay e.g. aerial photograph, scanned map or map layers. Animations: This may not work in class try this one instead: 14
 :")
 25 x 25 m")


15 Physical Models (traditional) : Challenger map ( ) 25 x 25 m ~1:50,000 True 3D physical models (40 x 74 feet 1:99,000) Digitally created by laser 15


16 3D perspectives: Rocky Mountain trench Castle Creek Glacier The UNBC Geowall In lab this week True 3D Summary: How have DEMs impacted relief depiction? Sugar-loafs and hachures Contours Hypsometric Tints Shaded relief (hillshading) Tanaka illuminated contours Slope zones 3D perspectives /fly throughs True 3D x y y yyy x y (GIS) yyy y 16
Digital Elevation Models (DEM)
") Digital Elevation Models (DEM) Digital representation of the terrain surface also referred to as Digital Terrain Models (DTM) Digital Elevation Models (DEM) How has relief depiction changed with digital
Digital Elevation Models (DEM) Digital representation of the terrain surface also referred to as Digital Terrain Models (DTM) Digital Elevation Models (DEM) How has relief depiction changed with digital
GEOGRAPHIC INFORMATION SYSTEMS Lecture 25: 3D Analyst
 GEOGRAPHIC INFORMATION SYSTEMS Lecture 25: 3D Analyst 3D Analyst - 3D Analyst is an ArcGIS extension designed to work with TIN data (triangulated irregular network) - many of the tools in 3D Analyst also
Lecture 4: Digital Elevation Models
 Lecture 4: Digital Elevation Models GEOG413/613 Dr. Anthony Jjumba 1 Digital Terrain Modeling Terms: DEM, DTM, DTEM, DSM, DHM not synonyms. The concepts they illustrate are different Digital Terrain Modeling
Hillshade Example. Custom product generation with elevation data
 Hillshade Example Custom product generation with elevation data Version 1.0 Mark Lucas 22 May 2005 Overview Performing Artificial Shading based on Elevation OSSIM and ImageLinker provide many capabilities
Digital Elevation Models
 Digital Elevation Models National Elevation Dataset 1 Data Sets US DEM series 7.5, 30, 1 o for conterminous US 7.5, 15 for Alaska US National Elevation Data (NED) GTOPO30 Global Land One-kilometer Base
Lecture 21 - Chapter 8 (Raster Analysis, part2)
") GEOL 452/552 - GIS for Geoscientists I Lecture 21 - Chapter 8 (Raster Analysis, part2) Today: Digital Elevation Models (DEMs), Topographic functions (surface analysis): slope, aspect hillshade, viewshed,
GEOL 452/552 - GIS for Geoscientists I Lecture 21 - Chapter 8 (Raster Analysis, part2) Today: Digital Elevation Models (DEMs), Topographic functions (surface analysis): slope, aspect hillshade, viewshed,
START>PROGRAMS>ARCGIS>
 Department of Urban Studies and Planning Spring 2006 Department of Architecture Site and Urban Systems Planning 11.304J / 4.255J GIS EXERCISE 2 Objectives: To generate the following maps using ArcGIS Software:
RASTER ANALYSIS GIS Analysis Fall 2013
 RASTER ANALYSIS GIS Analysis Fall 2013 Raster Data The Basics Raster Data Format Matrix of cells (pixels) organized into rows and columns (grid); each cell contains a value representing information. What
GIS data input. In the early days of GIS 1980s and early 1990s. We used canned datasets for teaching (from USA)
") GIS data input GIS is the automated : acquisition - input management analysis display of spatial data In the early days of GIS 1980s and early 1990s There were no or little GIS data We used canned datasets
GIS data input GIS is the automated : acquisition - input management analysis display of spatial data In the early days of GIS 1980s and early 1990s There were no or little GIS data We used canned datasets
Applied Cartography and Introduction to GIS GEOG 2017 EL. Lecture-7 Chapters 13 and 14
 Applied Cartography and Introduction to GIS GEOG 2017 EL Lecture-7 Chapters 13 and 14 Data for Terrain Mapping and Analysis DEM (digital elevation model) and TIN (triangulated irregular network) are two
Raster GIS applications
 Raster GIS applications Columns Rows Image: cell value = amount of reflection from surface DEM: cell value = elevation (also slope/aspect/hillshade/curvature) Thematic layer: cell value = category or measured
Digital Elevation Model & Surface Analysis
 Topics: Digital Elevation Model & Surface Analysis 1. Introduction 2. Create raster DEM 3. Examine Lidar DEM 4. Deriving secondary surface products 5. Mapping contours 6. Viewshed Analysis 7. Extract elevation
I CALCULATIONS WITHIN AN ATTRIBUTE TABLE
 Geology & Geophysics REU GPS/GIS 1-day workshop handout #4: Working with data in ArcGIS You will create a raster DEM by interpolating contour data, create a shaded relief image, and pull data out of the
Copyright The McGraw-Hill Companies, Inc. Permission required for reproduction or display.
 Chapter 13. TERRAIN MAPPING AND ANALYSIS 13.1 Data for Terrain Mapping and Analysis 13.1.1 DEM 13.1.2 TIN Box 13.1 Terrain Data Format 13.2 Terrain Mapping 13.2.1 Contouring 13.2.2 Vertical Profiling 13.2.3
Lab 7: Bedrock rivers and the relief structure of mountain ranges
 Lab 7: Bedrock rivers and the relief structure of mountain ranges Objectives In this lab, you will analyze the relief structure of the San Gabriel Mountains in southern California and how it relates to
GY461 GIS 1: Environmental Campus Topography Project with ArcGIS 9.x
 I. Introduction GY461 GIS 1: Environmental In this project you will use data from a topographic survey of the USA campus to generate 2 separate maps: 1. A color-coded 2-dimensional topographic contour
LiDAR-Maps. and More for. Engineers. TechTime New Mapping Tools for Transportation Engineering. Airborne LiDAR. Digital Cameras
 LiDAR-Maps Airborne LiDAR and More for Digital Cameras Engineers and Their Applications Presenter: Azadeh Koohzare, Ph.D., P.Eng. Project Manager, Geodesy and Geomatics AKoohzare@mcelhanney.com 604-683-8521
Raster GIS. Raster GIS 11/1/2015. The early years of GIS involved much debate on raster versus vector - advantages and disadvantages
 Raster GIS Google Earth image (raster) with roads overlain (vector) Raster GIS The early years of GIS involved much debate on raster versus vector - advantages and disadvantages 1 Feb 21, 2010 MODIS satellite
RASTER ANALYSIS GIS Analysis Winter 2016
 RASTER ANALYSIS GIS Analysis Winter 2016 Raster Data The Basics Raster Data Format Matrix of cells (pixels) organized into rows and columns (grid); each cell contains a value representing information.
Tutorial 1: Downloading elevation data
 Tutorial 1: Downloading elevation data Objectives In this exercise you will learn how to acquire elevation data from the website OpenTopography.org, project the dataset into a UTM coordinate system, and
v Working with Rasters SMS 12.1 Tutorial Requirements Raster Module Map Module Mesh Module Time minutes Prerequisites Overview Tutorial
 v. 12.1 SMS 12.1 Tutorial Objectives This tutorial teaches how to import a Raster, view elevations at individual points, change display options for multiple views of the data, show the 2D profile plots,
Creating Contours using ArcMap
 Creating Contours with ArcMap and ArcScene Digital elevation models (DEMs) are geospatial datasets that contain elevation values sampled according to a regularly spaced rectangular grid. They can be used
What s New in Imagery in ArcGIS. Presented by: Christopher Patterson Date: October 18, 2017
 What s New in Imagery in ArcGIS Presented by: Christopher Patterson Date: October 18, 2017 Imagery in ArcGIS Advancing 2010 Stretch, Extract Bands Clip, Mask Reproject, Orthorectify, Pan Sharpen Vegetation
Exercise 1: Introduction to ILWIS with the Riskcity dataset
 Exercise 1: Introduction to ILWIS with the Riskcity dataset Expected time: 2.5 hour Data: data from subdirectory: CENN_DVD\ILWIS_ExerciseData\IntroRiskCity Objectives: After this exercise you will be able
An Introduction to Lidar & Forestry May 2013
 An Introduction to Lidar & Forestry May 2013 Introduction to Lidar & Forestry Lidar technology Derivatives from point clouds Applied to forestry Publish & Share Futures Lidar Light Detection And Ranging
Final project: Lecture 21 - Chapter 8 (Raster Analysis, part2) GEOL 452/552 - GIS for Geoscientists I
 GEOL 452/552 - GIS for Geoscientists I") GEOL 452/552 - GIS for Geoscientists I Lecture 21 - Chapter 8 (Raster Analysis, part2) Talk about class project (copy follow_along_data\ch8a_class_ex into U:\ArcGIS\ if needed) Catch up with lecture 20
GEOL 452/552 - GIS for Geoscientists I Lecture 21 - Chapter 8 (Raster Analysis, part2) Talk about class project (copy follow_along_data\ch8a_class_ex into U:\ArcGIS\ if needed) Catch up with lecture 20
N.J.P.L.S. An Introduction to LiDAR Concepts and Applications
 N.J.P.L.S. An Introduction to LiDAR Concepts and Applications Presentation Outline LIDAR Data Capture Advantages of Lidar Technology Basics Intensity and Multiple Returns Lidar Accuracy Airborne Laser
GeoEarthScope NoCAL San Andreas System LiDAR pre computed DEM tutorial
 GeoEarthScope NoCAL San Andreas System LiDAR pre computed DEM tutorial J Ramón Arrowsmith Chris Crosby School of Earth and Space Exploration Arizona State University ramon.arrowsmith@asu.edu http://lidar.asu.edu
Terrain Analysis. Using QGIS and SAGA
 Terrain Analysis Using QGIS and SAGA Tutorial ID: IGET_RS_010 This tutorial has been developed by BVIEER as part of the IGET web portal intended to provide easy access to geospatial education. This tutorial
A METHODOLOGY FOR CREATING ANALYTICAL HILL-SHADING BY COMBINING DIFFERENT LIGHTING DIRECTIONS
 A METHODOLOGY FOR CREATING ANALYTICAL HILL-SHADING BY COMBINING DIFFERENT LIGHTING DIRECTIONS Dimitrios Loisios *, Nikolaos Tzelepis **, Byron Nakos ** jbm@mail.ntua.gr - niktzel@survey.ntua.gr - bnakos@central.ntua.gr
2. AREAL PHOTOGRAPHS, SATELLITE IMAGES, & TOPOGRAPHIC MAPS
 LAST NAME (ALL IN CAPS): FIRST NAME: 2. AREAL PHOTOGRAPHS, SATELLITE IMAGES, & TOPOGRAPHIC MAPS Instructions: Refer to Exercise 3 in your Lab Manual on pages 47-64 to answer the questions in this work
Tutorial 18: 3D and Spatial Analyst - Creating a TIN and Visual Analysis
 Tutorial 18: 3D and Spatial Analyst - Creating a TIN and Visual Analysis Module content 18.1. Creating a TIN 18.2. Spatial Analyst Viewsheds, Slopes, Hillshades and Density. 18.1 Creating a TIN Sometimes
3D Data Modelling at Esri. Paul Hardy Business Development Consultant Esri Europe
 3D Data Modelling at Esri Paul Hardy phardy@esri.com Business Development Consultant Esri Europe Users of 3D GIS Local government Facilities management Civil engineering 3D GIS Defense / Public Safety
COPYRIGHTED MATERIAL. Introduction to 3D Data: Modeling with ArcGIS 3D Analyst and Google Earth CHAPTER 1
 CHAPTER 1 Introduction to 3D Data: Modeling with ArcGIS 3D Analyst and Google Earth Introduction to 3D Data is a self - study tutorial workbook that teaches you how to create data and maps with ESRI s
Files Used in this Tutorial
 Generate Point Clouds and DSM Tutorial This tutorial shows how to generate point clouds and a digital surface model (DSM) from IKONOS satellite stereo imagery. You will view the resulting point clouds
Creating advanced shadedrelief maps and layer blending with Global Mapper software
 Creating advanced shadedrelief maps and layer blending with Global Mapper software J. Buck Ehler GIS Analyst/Cartographer Utah Geological Survey buckehler@utah.gov (801) 537-3343 SLUG Meeting August 11,
Pat Kennelly LIU Post Brookville, NY USA
 Pat Kennelly LIU Post Brookville, NY USA Outline Definition Horizontal hachures vs. custom relief contours Methodology Results Summary Definition From Cartographic Relief Presentation (Imhof, 1982) Horizontal
Evaluation of Desktop Relief Shading Software
 Evaluation of Desktop Relief Shading Software ABSTRACT Shaded relief depiction on two-dimensional maps is increasing due to, in large part, the growth of inexpensive, easy-to-use relief shading software.
Elevation Model Viewing service
 1(9) Date: Document version: Service's interface version : 2016-12-01 1.1 1.0.1 Product description: Elevation Model Viewing service LANTMÄTERIET 2016-12-01 2 (9) List of contents 1 General description...
Course Outline (1) #6 Data Acquisition for Built Environment. Fumio YAMAZAKI
 #6 Data Acquisition for Built Environment. Fumio YAMAZAKI") AT09.98 Applied GIS and Remote Sensing for Disaster Mitigation #6 Data Acquisition for Built Environment 9 October, 2002 Fumio YAMAZAKI yamazaki@ait.ac.th http://www.star.ait.ac.th/~yamazaki/ Course Outline
AT09.98 Applied GIS and Remote Sensing for Disaster Mitigation #6 Data Acquisition for Built Environment 9 October, 2002 Fumio YAMAZAKI yamazaki@ait.ac.th http://www.star.ait.ac.th/~yamazaki/ Course Outline
GEO 465/565 - Lab 7 Working with GTOPO30 Data in ArcGIS 9
 GEO 465/565 - Lab 7 Working with GTOPO30 Data in ArcGIS 9 This lab explains how work with a Global 30-Arc-Second (GTOPO30) digital elevation model (DEM) from the U.S. Geological Survey. This dataset can
Lab 1: Introduction to ArcGIS
 Lab 1: Introduction to ArcGIS Objectives In this lab you will: 1) Learn the basics of the software package we will be using for the remainder of the semester, and 2) Discover the role that climate and
GIS Visualization, 3D Visualization and Animation. Tomislav Sapic GIS Technologist Faculty of Natural Resources Management Lakehead University
 GIS Visualization, 3D Visualization and Animation Tomislav Sapic GIS Technologist Faculty of Natural Resources Management Lakehead University Definitions 3D Visualization: Presenting or observing spatial,
Terrain Modeling and Mapping for Telecom Network Installation Using Scanning Technology. Maziana Muhamad
 Terrain Modeling and Mapping for Telecom Network Installation Using Scanning Technology Maziana Muhamad Summarising LiDAR (Airborne Laser Scanning) LiDAR is a reliable survey technique, capable of: acquiring
Light Detection and Ranging (LiDAR)
") Light Detection and Ranging (LiDAR) http://code.google.com/creative/radiohead/ Types of aerial sensors passive active 1 Active sensors for mapping terrain Radar transmits microwaves in pulses determines
Light Detection and Ranging (LiDAR) http://code.google.com/creative/radiohead/ Types of aerial sensors passive active 1 Active sensors for mapping terrain Radar transmits microwaves in pulses determines
Surpac Google Earth Tools
 Surpac Google Earth Tools Google Earth is a free software program that lets you fly anywhere on Earth to view satellite imagery, maps, terrain and 3D buildings. When used in conjunction with SURPAC, it
The 3D Analyst extension extends ArcGIS to support surface modeling and 3- dimensional visualization. 3D Shape Files
 NRM 435 Spring 2016 ArcGIS 3D Analyst Page#1 of 9 0B3D Analyst Extension The 3D Analyst extension extends ArcGIS to support surface modeling and 3- dimensional visualization. 3D Shape Files Analogous to
Module: Rasters. 8.1 Lesson: Working with Raster Data Follow along: Loading Raster Data CHAPTER 8
 CHAPTER 8 Module: Rasters We ve used rasters for digitizing before, but raster data can also be used directly. In this module, you ll see how it s done in QGIS. 8.1 Lesson: Working with Raster Data Raster
control sta... is set by the base. order both information
 automated mapping and resting upon data. use of aerial in compilation planning-carmanagement of informaone of m comes topographic boundaries, hydrography, road network, reup topo-basis of future forest
v SMS Tutorials Working with Rasters Prerequisites Requirements Time Objectives
 v. 12.2 SMS 12.2 Tutorial Objectives Learn how to import a Raster, view elevations at individual points, change display options for multiple views of the data, show the 2D profile plots, and interpolate
Steps for Modeling a Proposed New Reservoir in GIS
 Steps for Modeling a Proposed New Reservoir in GIS Requirements: ArcGIS ArcMap, ArcScene, Spatial Analyst, and 3D Analyst There s a new reservoir proposed for Right Hand Fork in Logan Canyon. I wanted
Feature Extraction from Imagery & Lidar. Kurt Schwoppe, Esri Mark Romero, Esri Gregory Bacon, Fairfax County
 Feature Extraction from & Lidar Kurt Schwoppe, Esri Mark Romero, Esri Gregory Bacon, Fairfax County Today s Speakers Image Processing Experts and Good Colleagues Kurt Schwoppe Industry Lead Esri Mark Romero
v Online Data Dynamic Images SMS Tutorials Prerequisites Requirements Time Objectives
 v. 13.0 SMS 13.0 Tutorial Dynamic Images Objectives This tutorial instructs on the basic skills concerning how to use the dynamic image option offered by SMS. This option connects SMS through an internet
POSITIONING A PIXEL IN A COORDINATE SYSTEM
 GEOREFERENCING AND GEOCODING EARTH OBSERVATION IMAGES GABRIEL PARODI STUDY MATERIAL: PRINCIPLES OF REMOTE SENSING AN INTRODUCTORY TEXTBOOK CHAPTER 6 POSITIONING A PIXEL IN A COORDINATE SYSTEM The essential
Lab 11: Terrain Analyses
 Lab 11: Terrain Analyses What You ll Learn: Basic terrain analysis functions, including watershed, viewshed, and profile processing. There is a mix of old and new functions used in this lab. We ll explain
Contents of Lecture. Surface (Terrain) Data Models. Terrain Surface Representation. Sampling in Surface Model DEM
 Data Models. Terrain Surface Representation. Sampling in Surface Model DEM") Lecture 13: Advanced Data Models: Terrain mapping and Analysis Contents of Lecture Surface Data Models DEM GRID Model TIN Model Visibility Analysis Geography 373 Spring, 2006 Changjoo Kim 11/29/2006 1
Lecture 13: Advanced Data Models: Terrain mapping and Analysis Contents of Lecture Surface Data Models DEM GRID Model TIN Model Visibility Analysis Geography 373 Spring, 2006 Changjoo Kim 11/29/2006 1
National Science Foundation Engineering Research Center. Bingcai Zhang BAE Systems San Diego, CA
 Bingcai Zhang BAE Systems San Diego, CA 92127 Bingcai.zhang@BAESystems.com Introduction It is a trivial task for a five-year-old child to recognize and name an object such as a car, house or building.
DIGITAL SURFACE MODELS OF CITY AREAS BY VERY HIGH RESOLUTION SPACE IMAGERY
 DIGITAL SURFACE MODELS OF CITY AREAS BY VERY HIGH RESOLUTION SPACE IMAGERY Jacobsen, K. University of Hannover, Institute of Photogrammetry and Geoinformation, Nienburger Str.1, D30167 Hannover phone +49
Automatic DEM Extraction
 Technical Specifications Automatic DEM Extraction The Automatic DEM Extraction module allows you to create Digital Elevation Models (DEMs) from stereo airphotos, stereo images and RADAR data. Image correlation
Welcome to NR402 GIS Applications in Natural Resources. This course consists of 9 lessons, including Power point presentations, demonstrations,
 Welcome to NR402 GIS Applications in Natural Resources. This course consists of 9 lessons, including Power point presentations, demonstrations, readings, and hands on GIS lab exercises. Following the last
Digital Raster Acquisition Project Eastern Ontario (DRAPE) 2014 Digital Surface Model and Digital Terrain Model
 2014 Digital Surface Model and Digital Terrain Model") Digital Raster Acquisition Project Eastern Ontario (DRAPE) 2014 Digital Surface Model and Digital Terrain Model User Guide Provincial Mapping Unit Mapping and Information Resources Branch Corporate Management
Digital Raster Acquisition Project Eastern Ontario (DRAPE) 2014 Digital Surface Model and Digital Terrain Model User Guide Provincial Mapping Unit Mapping and Information Resources Branch Corporate Management
DSM generation with the Leica/Helava DPW 770 and VirtuoZo digital photogrammetric systems
 Research Collection Other Conference Item DSM generation with the Leica/Helava DPW 770 and VirtuoZo digital photogrammetric systems Author(s): Baltsavias, Emmanuel P. Publication Date: 1996 Permanent Link:
Automatic DEM Extraction
 Automatic DEM Extraction The Automatic DEM Extraction module allows you to create Digital Elevation Models (DEMs) from stereo airphotos, stereo images and RADAR data. Image correlation is used to extract
Field-Scale Watershed Analysis
 Conservation Applications of LiDAR Field-Scale Watershed Analysis A Supplemental Exercise for the Hydrologic Applications Module Andy Jenks, University of Minnesota Department of Forest Resources 2013
v SMS 12.3 Tutorial Import From Web Requirements Internet connection Time minutes Prerequisites None Objectives
 SMS 12.3 Tutorial Import from Web v. 12.3 Objectives This tutorial gives an overview of the Importing from Web option offered by SMS. This option connects SMS to a web based program that adds additional
HEC-RAS 5.0 Training New Zealand Workshop Guide
 HEC-RAS 5.0 Training New Zealand Workshop Guide Prepared by: Krey Price Surface Water Solutions 57 Bromfield Drive Kelmscott WA 6111 Australia Tel. +61 400 367 542 e-mail: info@surfacewater.biz website:
v SMS 12.2 Tutorial Online Data Dynamic Images Prerequisites None Requirements Internet Connection Time minutes
 v. 12.2 SMS 12.2 Tutorial Dynamic Images Objectives This lesson is designed to help users become familiar with the Dynamic Image option offered by SMS. This option connects SMS to a web based program that
SPOT-1 stereo images taken from different orbits with one month difference
 DSM Generation Almost all HR sensors are stereo capable. Some can produce even triplettes within the same strip (facilitating multi-image matching). Mostly SPOT (1-5) used for stereo and Ikonos (in spite
Review of Cartographic Data Types and Data Models
 Review of Cartographic Data Types and Data Models GIS Data Models Raster Versus Vector in GIS Analysis Fundamental element used to represent spatial features: Raster: pixel or grid cell. Vector: x,y coordinate
In this lab, you will create two maps. One map will show two different projections of the same data.
 Projection Exercise Part 2 of 1.963 Lab for 9/27/04 Introduction In this exercise, you will work with projections, by re-projecting a grid dataset from one projection into another. You will create a map
What is a Topographic Map?
 Topographic Maps Topography From Greek topos, place and grapho, write the study of surface shape and features of the Earth and other planetary bodies. Depiction in maps. Person whom makes maps is called
Representing Geography
 Data models and axioms Chapters 3 and 7 Representing Geography Road map Representing the real world Conceptual models: objects vs fields Implementation models: vector vs raster Vector topological model
Geometric Accuracy Evaluation, DEM Generation and Validation for SPOT-5 Level 1B Stereo Scene
 Geometric Accuracy Evaluation, DEM Generation and Validation for SPOT-5 Level 1B Stereo Scene Buyuksalih, G.*, Oruc, M.*, Topan, H.*,.*, Jacobsen, K.** * Karaelmas University Zonguldak, Turkey **University
GEOGRAPHIC INFORMATION SYSTEMS Lecture 24: Spatial Analyst Continued
 GEOGRAPHIC INFORMATION SYSTEMS Lecture 24: Spatial Analyst Continued Spatial Analyst - Spatial Analyst is an ArcGIS extension designed to work with raster data - in lecture I went through a series of demonstrations
Lab 10: Raster Analyses
 Lab 10: Raster Analyses What You ll Learn: Spatial analysis and modeling with raster data. You will estimate the access costs for all points on a landscape, based on slope and distance to roads. You ll
L7 Raster Algorithms
 L7 Raster Algorithms NGEN6(TEK23) Algorithms in Geographical Information Systems by: Abdulghani Hasan, updated Nov 216 by Per-Ola Olsson Background Store and analyze the geographic information: Raster
Using Hierarchical Warp Stereo for Topography. Introduction
 Using Hierarchical Warp Stereo for Topography Dr. Daniel Filiberti ECE/OPTI 531 Image Processing Lab for Remote Sensing Introduction Topography from Stereo Given a set of stereoscopic imagery, two perspective
Lab 11: Terrain Analysis
 Lab 11: Terrain Analysis What You ll Learn: Basic terrain analysis functions, including watershed, viewshed, and profile processing. You should read chapter 11 in the GIS Fundamentals textbook before performing
Producing Ortho Imagery In ArcGIS. Hong Xu, Mingzhen Chen, Ringu Nalankal
 Producing Ortho Imagery In ArcGIS Hong Xu, Mingzhen Chen, Ringu Nalankal Agenda Ortho imagery in GIS ArcGIS ortho mapping solution Workflows - Satellite imagery - Digital aerial imagery - Scanned imagery
High Resolution Digital Elevation Model (HRDEM) CanElevation Series Product Specifications. Edition
 CanElevation Series Product Specifications. Edition") High Resolution Digital Elevation Model (HRDEM) CanElevation Series Product Specifications Edition 1.1 2017-08-17 Government of Canada Natural Resources Canada Telephone: +01-819-564-4857 / 1-800-661-2638
High Resolution Digital Elevation Model (HRDEM) CanElevation Series Product Specifications Edition 1.1 2017-08-17 Government of Canada Natural Resources Canada Telephone: +01-819-564-4857 / 1-800-661-2638
3D Analyst Visualization with ArcGlobe. Brady Hoak, ESRI DC
 3D Analyst Visualization with ArcGlobe Brady Hoak, ESRI DC 3D GIS Viewing geospatial data in 3D leads to new insights 2D 3D Sometimes you need to edit your data in 3D 2D 3D Some problems can only be solved
v Importing Rasters SMS 11.2 Tutorial Requirements Raster Module Map Module Mesh Module Time minutes Prerequisites Overview Tutorial
 v. 11.2 SMS 11.2 Tutorial Objectives This tutorial teaches how to import a Raster, view elevations at individual points, change display options for multiple views of the data, show the 2D profile plots,
Lecture 4. Image Georeferencing, Accuracy and Precision, File Geodatabase
 Lecture 4 Image Georeferencing, Accuracy and Precision, File Geodatabase Tomislav Sapic GIS Technologist Faculty of Natural Resources Management Lakehead University Why Georeference? Images of the surface
Bonemapping: A LiDAR Processing and Visualization Approach and Its Applications
 Bonemapping: A LiDAR Processing and Visualization Approach and Its Applications Thomas J. Pingel Northern Illinois University National Geography Awareness Week Lecture Department of Geology and Geography
University of West Hungary, Faculty of Geoinformatics. Béla Márkus. Spatial Analysis 5. module SAN5. 3D analysis
 University of West Hungary, Faculty of Geoinformatics Béla Márkus Spatial Analysis 5. module SAN5 3D analysis SZÉKESFEHÉRVÁR 2010 The right to this intellectual property is protected by the 1999/LXXVI
Alaska Department of Transportation Roads to Resources Project LiDAR & Imagery Quality Assurance Report Juneau Access South Corridor
 Alaska Department of Transportation Roads to Resources Project LiDAR & Imagery Quality Assurance Report Juneau Access South Corridor Written by Rick Guritz Alaska Satellite Facility Nov. 24, 2015 Contents
MODULE 1 BASIC LIDAR TECHNIQUES
 MODULE SCENARIO One of the first tasks a geographic information systems (GIS) department using lidar data should perform is to check the quality of the data delivered by the data provider. The department
DIGITAL ORTHOPHOTO GENERATION
 DIGITAL ORTHOPHOTO GENERATION Manuel JAUREGUI, José VÍLCHE, Leira CHACÓN. Universit of Los Andes, Venezuela Engineering Facult, Photogramdemr Institute, Email leirac@ing.ula.ven Working Group IV/2 KEY
I. An Intro to ArcMap Version 9.3 and 10. 1) Arc Map is basically a build your own Google map
 Arc Map is basically a build your own Google map") I. An Intro to ArcMap Version 9.3 and 10 What is Arc Map? 1) Arc Map is basically a build your own Google map a. Display and manage geo-spatial data (maps, images, points that have a geographic location)
I. An Intro to ArcMap Version 9.3 and 10 What is Arc Map? 1) Arc Map is basically a build your own Google map a. Display and manage geo-spatial data (maps, images, points that have a geographic location)
Alberta-wide ALOS DSM "ALOS_DSM15.tif", "ALOS_DSM15_c6.tif"
 Alberta-wide ALOS DSM "ALOS_DSM15.tif", "ALOS_DSM15_c6.tif" Alberta Biodiversity Monitoring Institute Geospatial Centre May 2017 Contents 1. Overview... 2 1.1. Summary... 2 1.2 Description... 2 1.3 Credits...
Lab 12: Sampling and Interpolation
 Lab 12: Sampling and Interpolation What You ll Learn: -Systematic and random sampling -Majority filtering -Stratified sampling -A few basic interpolation methods Data for the exercise are in the L12 subdirectory.
LAB #7 Creating TIN and 3D scenes (ArcScene) GISC, UNIVERSITY OF CALIFORNIA BERKELEY
 GISC, UNIVERSITY OF CALIFORNIA BERKELEY") LAB #7 Creating TIN and 3D scenes (ArcScene) GISC, UNIVERSITY OF CALIFORNIA BERKELEY The purpose of this laboratory is to introduce and explore surface data analysis using a vector data model: TIN. We
LAB #7 Creating TIN and 3D scenes (ArcScene) GISC, UNIVERSITY OF CALIFORNIA BERKELEY The purpose of this laboratory is to introduce and explore surface data analysis using a vector data model: TIN. We
Improved Applications with SAMB Derived 3 meter DTMs
 Improved Applications with SAMB Derived 3 meter DTMs Evan J Fedorko West Virginia GIS Technical Center 20 April 2005 This report sums up the processes used to create several products from the Lorado 7
Stellenbosch University Digital Elevation Model (SUDEM) 2016 Edition (v16.01)
 2016 Edition (v16.01)") Stellenbosch University Digital Elevation Model (SUDEM) 2016 Edition (v16.01) ii Stellenbosch University Digital Elevation Model (SUDEM) 2016 Edition (v16.01) Adriaan van Niekerk Centre for Geographical
Stellenbosch University Digital Elevation Model (SUDEM) 2016 Edition (v16.01) ii Stellenbosch University Digital Elevation Model (SUDEM) 2016 Edition (v16.01) Adriaan van Niekerk Centre for Geographical
Class #2. Data Models: maps as models of reality, geographical and attribute measurement & vector and raster (and other) data structures
 data structures") Class #2 Data Models: maps as models of reality, geographical and attribute measurement & vector and raster (and other) data structures Role of a Data Model Levels of Data Model Abstraction GIS as Digital
Class #2 Data Models: maps as models of reality, geographical and attribute measurement & vector and raster (and other) data structures Role of a Data Model Levels of Data Model Abstraction GIS as Digital
Understanding Topographic Maps
 Understanding Topographic Maps 1. Every point on a contour line represents the exact same elevation (remember the glass inserted into the mountain). As a result of this every contour line must eventually
Visualizing 2D Data in a 3D World
 Visualizing 2D Data in a 3D World Karl Kliparchuk, M.Sc., GISP, and Brendan Walashek, B.Sc. McElhanney Consulting Services Ltd. Email: kkliparchuk@mcelhanney.com and bwalashek@mcelhanney.com Agenda A Quick
Server Usage & Third-Party Viewers
 Server Usage & Third-Party Viewers October 2016 HiPER LOOK Version 1.4.16.0 Copyright 2015 PIXIA Corp. All Rights Reserved. Table of Contents HiPER LOOK Server Introduction... 2 Google Earth... 2 Installation...2
Training i Course Remote Sensing Basic Theory & Image Processing Methods September 2011
 Training i Course Remote Sensing Basic Theory & Image Processing Methods 19 23 September 2011 Geometric Operations Michiel Damen (September 2011) damen@itc.nl ITC FACULTY OF GEO-INFORMATION SCIENCE AND
Map Algebra Exercise (Beginner) ArcView 9
 ArcView 9") Map Algebra Exercise (Beginner) ArcView 9 1.0 INTRODUCTION The location of the data set is eastern Africa, more specifically in Nakuru District in Kenya (see Figure 1a). The Great Rift Valley runs through
Map Algebra Exercise (Beginner) ArcView 9 1.0 INTRODUCTION The location of the data set is eastern Africa, more specifically in Nakuru District in Kenya (see Figure 1a). The Great Rift Valley runs through