Synthesis Imaging. Claire Chandler, Sanjay Bhatnagar NRAO/Socorro
|
|
|
- Brittany Stevens
- 6 years ago
- Views:
Transcription

1 Synthesis Imaging Claire Chandler, Sanjay Bhatnagar NRAO/Socorro Michelson Summer Workshop Caltech, July 24-28, 2006
2 Synthesis Imaging 2 Based on the van Cittert-Zernike theorem: The complex visibility of a source, V(u,v), is the Fourier Transform of its intensity distribution on the sky, I(l,m) V ( u, v) I( l, m) = = I( l, m) e V ( u, v) e 2πi( ul+ vm) 2πi( ul+ vm) dldm dudv u,v are spatial frequencies in the E-W and N-S directions, and are the projected baseline lengths measured in units of wavelength, B/λ l,m are direction cosines relative to a reference position in the E-W and N-S directions

3 Some 2D FT pairs 3 Image Visibility amp

4 Some 2D FT pairs 4 Image Visibility amp

5 Some 2D FT pairs 5 Image Visibility amp
6 Sampling in the uv plane 6 Observed sky distribution, I(l,m) obs, is the convolution of the true sky distribution, I(l,m) true, and the point spread function. This is equivalent to sampling the true visibility function, V(u,v), with some sampling function, S(u,v), in the uv plane: I obs ( l, m) = I true ( l, m) PSF = S( u, v) V ( u, v) e 2πi( ul+ vm) dudv For a single telescope, S(u,v) is continuous, and in the absence of seeing is the autocorrelation function of the aperture
 S( u, v) V ( u, v) meas = true")
7 Sampling in the uv plane 7 For an interferometer, S(u,v) is discrete S ( u, v) = δ ( u, v ) k k k The measured visibility is the true visibility multiplied by the sampling function V ( u, v) S( u, v) V ( u, v) meas = true =


8 Sampling in the uv plane 8 Aperture synthesis: Ideally want to make sampling as complete as possible, to synthesize an aperture of diameter B max Telescope locations instantaneous uv coverage PSF


9 The resulting PSF 9 How nice the resulting PSF looks depends on how well the uv plane is sampled: VLA snapshots 3 antennas on each arm 8 antennas on each arm

10 Earth rotation synthesis 10 Earth rotation synthesis: We can help to fill in the uv plane by making use of the rotation of the Earth. A fixed baseline between telescope 1 and telescope 2, B 12, tracking a source from rise to set, will have a changing projected baseline, B proj, in the direction of the source, and will trace out two arcs in the uv plane: one for baseline 1-2, and one for 2-1 There are two arcs because the visibility is Hermitian: V ( u, v) = V * ( u, v)
11 Convolution with the PSF; terminology 11 The image obtained from the FT of the sampled visibility is the dirty image I ( l, m) FT[ S( u, v) V ( u, v)] dirty = The dirty image, I dirty, is the convolution of the true image, I true, and the dirty beam (PSF), B = FT(S) I = B dirty I true [In practice, I dirty = B*(I true +I N ), where I N = FT(Vis. Noise)] To recover I true, we must deconvolve B from I dirty Note: we can do this because S, and therefore B, is well-defined true


12 The dirty image 12 B FT S * I true I dirty
13 The missing information 13 Not all parts of the uv plane are sampled Central hole for u < u min and v < v min : Total integrated flux is not measured V ( u = 0, v = 0) = I ( l, m) dldm = 0 Upper limit on the largest scale in the image plane No measurements for u>u max and v>v max : Size of the main lobe of the PSF (the resolution) is finite Holes in the uv plane: dirty Contribute to the sidelobes of the PSF
14 The missing information 14 Although the total flux is not measured, the flux for scales corresponding to the Fourier components between u min and u max can be measured In the presence of extended emission, the observations must be designed keeping in mind: Required resolution maximum baseline Largest scale to be reliably reconstructed minimum baseline
15 Recovering the missing information 15 To recover information beyond the maximum baseline requires extrapolation (unconstrained) Recovering information corresponding to the central hole is possible, but need extra information (e.g., measure total flux using a large single telescope) Information corresponding to the uv holes requires interpolation Deconvolution of the PSF in the image plane = interpolation in the visibility plane Non-linear methods required
16 Recovering the missing information 16 Note: there is an infinite number of sky distributions consistent with the measurements, need to provide some constraints to the interpolation We can assume: The sky brightness is positive (but there are exceptions) The sky is a collection of point sources (weak assertion) The sky could be smooth The sky is mostly blank Non-linear deconvolution algorithms search for a model image, I model, such that the residual visibilities V resid = V model V meas are minimized subject to the constraints given by the assumptions
17 Practical aspects: overview 17 The rest of this lecture addresses some practical aspects of synthesis imaging: choices you will probably be asked to make by any piece of synthesis imaging software FFTs and the need to grid the uv data Forming the dirty beam: weighting An example of a deconvolution algorithm: Clean Finite support: the role of boxes Choosing the image and pixel sizes
18 Making the dirty image 18 The Fast Fourier Transform (FFT) is used for efficient Fourier transformations. However, it requires a regularly-spaced grid of data Measured visibilities are irregularly sampled (along tracks in the uv plane) Visibilities must be interpolated onto a regular grid using a suitable function
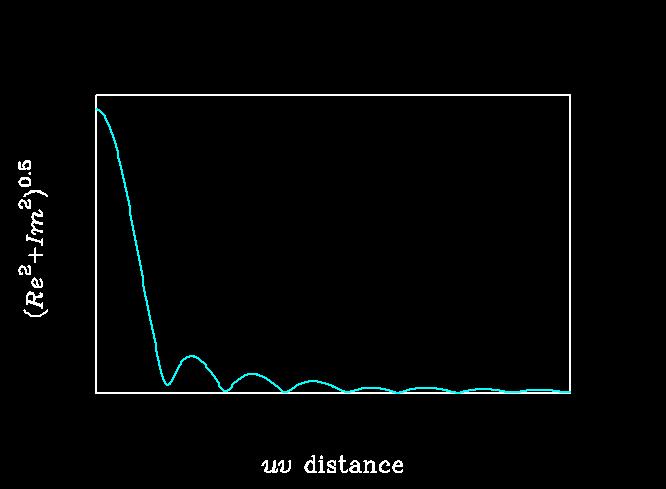
19 Dirty beam: properties 19 The PSF is a weighted sum of cosines corresponding to the measured Fourier components: B( l, m) = w + k k cos( ukl w k k v k m) The visibility weights, w, are also gridded onto a regular grid, FFTed, and used to compute the dirty beam The peak of the dirty beam is normalized to unity The main lobe has a size of order dx ~ 1/u max by dy ~ 1/v max this is the resolution of the instrument, or clean beam

20 Dirty beam: properties 20 Sidelobes extend indefinitely Close-in sidelobes are controlled by the envelope of the uv coverage: e.g., if the envelope is a circle, the sidelobes near the main lobe must be similar to the FT of a circular disk
21 Forming the dirty beam: weighting 21 The weighting function, w k, can be chosen to modify the sidelobe structure of the beam B( l, m) = w + k k cos( ukl w k k v k m) Natural weighting : w k = 1/σ k2 where σ k2 is the rms noise of the k th gridded visibility Gives the best rms noise across the image Smaller baselines (large spatial scales) have higher weights The effective resolution is worse than the inverse of the longest baseline
22 Forming the dirty beam: weighting 22 Uniform weighting: w k = 1/ρ(u k,v k ) where ρ(u k,v k ) is the density of uv points in the k th cell Short baselines (large scale features in the image) are weighted down Relatively better resolution Increased rms noise
23 Forming the dirty beam: weighting 23 Robust or Briggs weighting: w k = 1/[S 2 ρ(u k,v k ) + σ k2 ] S 2 = (5 10 R ) 2 /ρ(u k,v k ) is a parameterized filter that allows continuous variation between optimal resolution (uniform weighting) and optimal noise properties (natural weighting) by varying the robust parameter, R
 Natural Robust")


24 Examples of weighting: VLA 24 (uv coverage) Natural Robust Uniform Clean beam: Rms noise: tune resolution and sensitivity to suit your science
 Natural")


25 Examples of weighting: sparse uv coverage 25 (uv coverage) Natural Robust Uniform Clean beam: Rms noise: natural and uniform weighting similar for sparse uv coverage
26 Forming the dirty beam: tapering 26 The PSF can also be further controlled by applying a tapering function to the weights (e.g., such that the weights smoothly go to zero toward longer baselines) w k = T ( uk, vk ) wk ( uk, vk ) Bottom line on weighting/tapering: They help a bit, but imaging quality is limited by finite sampling of the uv plane
27 The Clean deconvolution algorithm (Högbom 1974) 27 Various deconvolution algorithms are available; Clean is an example of a scale-less algorithm Assume the sky is composed of point sources, and is mostly blank; then: 1. Search for the peak in the dirty image 2. Subtract a fraction g (the loop gain) of the PSF from the position of the peak (typically g ~ ) 3. Add g times the peak to a single pixel in the model image 4. If residuals are not noise-like, go to 1 5. Smooth the model image by an estimate of the main lobe of the PSF (the clean beam) and add the residuals to make the restored image
28 The Clean deconvolution algorithm 28 Stopping criteria: either specify a maximum number of iterations or the maximum in the residual image (some multiple of the expected noise is typical) Search space can be constrained by user-defined windows Ignores the coupling between pixels (extended emission)
29 Clean example: model image 29 Model source as the sum of many point sources
 from dirty image to give residual")
30 Clean example: residual image 30 Subtract (point sources PSF) from dirty image to give residual image
31 Clean example: restored image 31 Smooth the model image by the clean beam and add the residuals to form the restored image
32 Comparison with I true 32 Convolve I true with clean beam for comparison: I restored I true * (clean beam) F peak = F int =


33 V model V meas V true V model Clean can do a good job Clean example: visibilities 33 V true V meas V model of reproducing V true between u min and u max, but generally underestimates the total flux if there is unsampled extended emission
 Stop when Cleaning within the boxes has no global effect With boxes: No")
34 Finite support: the role of boxes 34 Limit the search for components to only parts of an image A way to regularize the deconvolution process Useful for small numbers of visibilities (VLBI / optical / snapshots using large-n arrays) Stop when Cleaning within the boxes has no global effect With boxes: No boxes:
35 Image and cell sizes 35 The size of the cells in the image needs to be chosen so that the main lobe of the dirty beam is at least Nyquist sampled: Δl 1/2u max, Δm 1/2v max The extent of the dirty image, l m, is related to the size of the grid cells in the uv plane, through the FT relationship l = 1/Δu, m = 1/Δv; if you make the image smaller than 1/Δu 1/Δv there may be aliasing The size of the image should be big enough to include the largest spatial scale on which there is measured flux (shortest uv spacing) If the image is not big enough, sidelobes from sources outside the image may be included and will not be deconvolved properly But also: if you have N independent visibilities you can only sensibly image of order ~N independent beam areas
36 Final remarks 36 Everything I have told you about synthesis imaging assumes that you have visibilities with calibrated amplitudes and phases What if you don t? Self-calibration See Chris Haniff s lecture There are many other subtleties not covered here; for further reading please see Synthesis Imaging in Radio Astronomy II, ASP Vol. 180 (1998) Interferometry and synthesis imaging requires you to think in FT space! This takes practice
Imaging and Deconvolution
 Imaging and Deconvolution Urvashi Rau National Radio Astronomy Observatory, Socorro, NM, USA The van-cittert Zernike theorem Ei E V ij u, v = I l, m e sky j 2 i ul vm dldm 2D Fourier transform : Image
Imaging and non-imaging analysis
 1 Imaging and non-imaging analysis Greg Taylor University of New Mexico Spring 2017 Plan for the lecture-i 2 How do we go from the measurement of the coherence function (the Visibilities) to the images
Imaging and Deconvolution
 Imaging and Deconvolution 24-28 Sept 202 Narrabri, NSW, Australia Outline : - Synthesis Imaging Concepts - Imaging in Practice Urvashi Rau - Image-Reconstruction Algorithms National Radio Astronomy Observatory
Lecture 17 Reprise: dirty beam, dirty image. Sensitivity Wide-band imaging Weighting
 Lecture 17 Reprise: dirty beam, dirty image. Sensitivity Wide-band imaging Weighting Uniform vs Natural Tapering De Villiers weighting Briggs-like schemes Reprise: dirty beam, dirty image. Fourier inversion
Radio Interferometry Bill Cotton, NRAO. Basic radio interferometry Emphasis on VLBI Imaging application
 Radio Interferometry Bill Cotton, NRAO Basic radio interferometry Emphasis on VLBI Imaging application 2 Simplest Radio Interferometer Monochromatic, point source 3 Interferometer response Adding quarter
Imaging and Deconvolution
 Imaging and Deconvolution David J. Wilner (Harvard-Smithsonian Center for Astrophysics) Fifteenth Synthesis Imaging Workshop 1-8 June 2016 Overview gain some intuition about interferometric imaging understand
ERROR RECOGNITION and IMAGE ANALYSIS
 PREAMBLE TO ERROR RECOGNITION and IMAGE ANALYSIS 2 Why are these two topics in the same lecture? ERROR RECOGNITION and IMAGE ANALYSIS Ed Fomalont Error recognition is used to determine defects in the data
Imaging and Deconvolution
 Imaging and Deconvolution Rick Perley, NRAO/Socorro ATNF Radio School Narrabri, NSW 29 Sept 03 Oct 2014 #G Topics Imaging Formal Solution Discrete Data The Direct Transform The Fast Fourier Transform Weighting,
Basic Imaging and Self- Calibration (T4 + T7)
") Basic Imaging and Self- Calibration (T4 + T7) John McKean Visibilities Fourier Transform Deconvolution AIM: 1. To make an image by taking the fast Fourier transform of the visibility data. 2. Carry out
Basic Imaging and Self- Calibration (T4 + T7) John McKean Visibilities Fourier Transform Deconvolution AIM: 1. To make an image by taking the fast Fourier transform of the visibility data. 2. Carry out
ALMA Memo 386 ALMA+ACA Simulation Tool J. Pety, F. Gueth, S. Guilloteau IRAM, Institut de Radio Astronomie Millimétrique 300 rue de la Piscine, F-3840
 ALMA Memo 386 ALMA+ACA Simulation Tool J. Pety, F. Gueth, S. Guilloteau IRAM, Institut de Radio Astronomie Millimétrique 300 rue de la Piscine, F-38406 Saint Martin d'h eres August 13, 2001 Abstract This
Sky-domain algorithms to reconstruct spatial, spectral and time-variable structure of the sky-brightness distribution
 Sky-domain algorithms to reconstruct spatial, spectral and time-variable structure of the sky-brightness distribution Urvashi Rau National Radio Astronomy Observatory Socorro, NM, USA Outline : - Overview
The Techniques of Radio Interferometry III: Imaging
 Master Astronomy and Astrophysics - 5214RAAS6Y Radio Astronomy Lecture 8 The Techniques of Radio Interferometry III: Imaging Lecturer: Michael Wise (wise@astron.nl) April 25th, 2013 Westerbork/LOFAR Field
ADVANCED RADIO INTERFEROMETRIC IMAGING
 ADVANCED RADIO INTERFEROMETRIC IMAGING Hayden Rampadarath Based upon J. Radcliffe's DARA presentation Image courtesy of NRAO/AUI INTR ODU CT ION In the first imaging lecture, we discussed the overall and
Deconvolution and Imaging ASTR 240: In-class activity, April 1, 2013
 Deconvolution and Imaging ASTR 240: In-class activity, April 1, 2013 In this activity, we will use calibrated visibilities from the Submillimeter Array to create an image of a disk around a nearby young
How accurately do our imaging algorithms reconstruct intensities and spectral indices of weak sources?
 How accurately do our imaging algorithms reconstruct intensities and spectral indices of weak sources? Urvashi Rau, Sanjay Bhatnagar, Frazer Owen ( NRAO ) 29th Annual New Mexico Symposium, NRAO, Socorro,
OSKAR: Simulating data from the SKA
 OSKAR: Simulating data from the SKA Oxford e-research Centre, 4 June 2014 Fred Dulwich, Ben Mort, Stef Salvini 1 Overview Simulating interferometer data for SKA: Radio interferometry basics. Measurement
Synthesis imaging using CASA
 Synthesis imaging using CASA Kuo-Song Wang ( 國松) and ARC-Taiwan team (ASIAA) UCAT Summer Student Program 2016 2016/06/30 Recap Radio interferometric observations The products from the array are Visibilities
A Modified Algorithm for CLEANing Wide-Field Maps with Extended Structures
 J. Astrophys. Astr. (1990) 11, 311 322 A Modified Algorithm for CLEANing Wide-Field Maps with Extended Structures Κ. S. Dwarakanath, A. A. Deshpande & Ν. Udaya Shankar Raman Research institute, Bangalore
Antenna Configurations for the MMA
 MMA Project Book, Chapter 15: Array Configuration Antenna Configurations for the MMA Tamara T. Helfer & M.A. Holdaway Last changed 11/11/98 Revision History: 11/11/98: Added summary and milestone tables.
High Dynamic Range Imaging
 High Dynamic Range Imaging Josh Marvil CASS Radio Astronomy School 3 October 2014 CSIRO ASTRONOMY & SPACE SCIENCE High Dynamic Range Imaging Introduction Review of Clean Self- Calibration Direction Dependence
Wide-Field Imaging I: Non-Coplanar Visibilities
 Wide-Field Imaging I: Non-Coplanar Visibilities Rick Perley Eleventh Synthesis Imaging Workshop Socorro, June 10-17, 2008 Review: Measurement Equation From the first lecture, we have a general relation
Fast Holographic Deconvolution
 Precision image-domain deconvolution for radio astronomy Ian Sullivan University of Washington 4/19/2013 Precision imaging Modern imaging algorithms grid visibility data using sophisticated beam models
Note 158: The AIPS++ GridTool Class How to use the GridTool class - definitions and tutorial
 Note 158: The AIPS++ GridTool Class How to use the GridTool class - definitions and tutorial Anthony G. Willis Copyright 1993 AIPS++ Chapter 2: Convolution in the Fourier Domain 1 Introduction The AIPS++
Radio interferometric imaging of spatial structure that varies with time and frequency
 Radio interferometric imaging of spatial structure that varies with time and frequency Urvashi Rau National Radio Astronomy Observatory, 1003 Lopezville Road, Socorro, NM-87801, USA ABSTRACT The spatial-frequency
COMMENTS ON ARRAY CONFIGURATIONS. M.C.H. Wright. Radio Astronomy laboratory, University of California, Berkeley, CA, ABSTRACT
 Bima memo 66 - May 1998 COMMENTS ON ARRAY CONFIGURATIONS M.C.H. Wright Radio Astronomy laboratory, University of California, Berkeley, CA, 94720 ABSTRACT This memo briey compares radial, circular and irregular
Image Pixelization and Dynamic Range
 EVLA Memo 114 Image Pixelization and Dynamic Range W. D. Cotton, Juan M. Uson NRAO 1 Abstract This study investigates some of the effects of representing the sky by a rectangular grid of pixels on the
Data Analysis. I have got some data, so what now? Naomi McClure-Griffiths CSIRO Australia Telescope National Facility 2 Oct 2008
 Data Analysis I have got some data, so what now? Naomi McClure-Griffiths CSIRO Australia Telescope National Facility 2 Oct 2008 1 Outline Non-imaging analysis Parameter estimation Point source fluxes,
Correlator Field-of-View Shaping
 Correlator Field-of-View Shaping Colin Lonsdale Shep Doeleman Vincent Fish Divya Oberoi Lynn Matthews Roger Cappallo Dillon Foight MIT Haystack Observatory Context SKA specifications extremely challenging
RADIO ASTRONOMICAL IMAGE FORMATION USING SPARSE RECONSTRUCTION TECHNIQUES
 RADIO ASTRONOMICAL IMAGE FORMATION USING SPARSE RECONSTRUCTION TECHNIQUES Runny Levanda 1 1 School of Engineering Bar-Ilan University, Ramat-Gan, 5900, Israel Amir Leshem 1, Faculty of EEMCS Delft University
van Cittert-Zernike Theorem
 van Cittert-Zernike Theorem Fundamentals of Radio Interferometry, Section 4.5 Griffin Foster SKA SA/Rhodes University NASSP 2016 What is the Fourier transform of the sky? NASSP 2016 2:21 Important Points:
Wideband Mosaic Imaging for VLASS
 Wideband Mosaic Imaging for VLASS Preliminary ARDG Test Report U.Rau & S.Bhatnagar 29 Aug 2018 (1) Code Validation and Usage (2) Noise, Weights, Continuum sensitivity (3) Imaging parameters (4) Understanding
arxiv: v1 [astro-ph.im] 23 Jul 2014
![arxiv: v1 [astro-ph.im] 23 Jul 2014](/thumbs/93/113120021.jpg "arxiv: v1 [astro-ph.im] 23 Jul 2014") Mon. Not. R. Astron. Soc. 000, 1 7 (2014) Printed 26 February 2018 (MN LATEX style file v2.2) Weighting in Radio Interferometric Imaging S. Yatawatta ASTRON, Postbus 2, 7990 AA Dwingeloo, the Netherlands
Mon. Not. R. Astron. Soc. 000, 1 7 (2014) Printed 26 February 2018 (MN LATEX style file v2.2) Weighting in Radio Interferometric Imaging S. Yatawatta ASTRON, Postbus 2, 7990 AA Dwingeloo, the Netherlands
Imaging Supermassive Black Holes with the Event Horizon Telescope
 Counter Jet Model Forward Jet Kazunori Akiyama, NEROC Symposium: Radio Science and Related Topics, MIT Haystack Observatory, 11/04/2016 Imaging Supermassive Black Holes with the Event Horizon Telescope
High dynamic range imaging, computing & I/O load
 High dynamic range imaging, computing & I/O load RMS ~15µJy/beam RMS ~1µJy/beam S. Bhatnagar NRAO, Socorro Parameterized Measurement Equation Generalized Measurement Equation Obs [ S M V ij = J ij, t W
Thomas Abraham, PhD
 Thomas Abraham, PhD (tabraham1@hmc.psu.edu) What is Deconvolution? Deconvolution, also termed as Restoration or Deblurring is an image processing technique used in a wide variety of fields from 1D spectroscopy
Continuum error recognition and error analysis
 Continuum error recognition and error analysis Robert Laing (ESO) 1 Outline Error recognition: how do you recognise and diagnose residual errors by looking at images? Image analysis: how do you extract
Empirical Parameterization of the Antenna Aperture Illumination Pattern
 Empirical Parameterization of the Antenna Aperture Illumination Pattern Preshanth Jagannathan UCT/NRAO Collaborators : Sanjay Bhatnagar, Walter Brisken Measurement Equation The measurement equation in
IRAM Memo MAPPING for NOEMA: Concepts and Usage
 Original version at http://iram-institute.org/medias/uploads/mapping-noema.pdf IRAM Memo 2016-1 MAPPING for NOEMA: Concepts and Usage S. Guilloteau 1 1. LAB (Bordeaux) 14-Jul-2016 version 1.0 09-Sep-2016
ALMA Memo No An Imaging Study for ACA. Min S. Yun. University of Massachusetts. April 1, Abstract
 ALMA Memo No. 368 An Imaging Study for ACA Min S. Yun University of Massachusetts April 1, 2001 Abstract 1 Introduction The ALMA Complementary Array (ACA) is one of the several new capabilities for ALMA
( ) = First Bessel function, x = π Dθ
 = First Bessel function, x = π Dθ") Observational Astronomy Image formation Complex Pupil Function (CPF): (3.3.1) CPF = P( r,ϕ )e ( ) ikw r,ϕ P( r,ϕ ) = Transmittance of the aperture (unobscured P = 1, obscured P = 0 ) k = π λ = Wave number
Observational Astronomy Image formation Complex Pupil Function (CPF): (3.3.1) CPF = P( r,ϕ )e ( ) ikw r,ϕ P( r,ϕ ) = Transmittance of the aperture (unobscured P = 1, obscured P = 0 ) k = π λ = Wave number
EVLA Memo #132 Report on the findings of the CASA Terabyte Initiative: Single-node tests
 EVLA Memo #132 Report on the findings of the CASA Terabyte Initiative: Single-node tests S. Bhatnagar NRAO, Socorro May 18, 2009 Abstract This note reports on the findings of the Terabyte-Initiative of
Mosaicing and Single-Dish Combination
 Mosaicing and Single-Dish Combination CASS Radio Astronomy School 2012 Lister Staveley-Smith (ICRAR / CAASTRO / UWA) Outline Mosaicing with interferometers! Nyquist sampling! Image formation Combining
Multi-Scale CLEAN deconvolution of radio synthesis images
 MULTI-SCALE CLEAN 1 Multi-Scale CLEAN deconvolution of radio synthesis images T.J. Cornwell arxiv:0806.2228v1 [astro-ph] 13 Jun 2008 Abstract Radio synthesis imaging is dependent upon deconvolution algorithms
Lessons learnt from implementing mosaicing and faceting in ASKAPsoft. Max Voronkov & Tim Cornwell ASKAP team 2nd April 2009
 Lessons learnt from implementing mosaicing and faceting in ASKAPsoft Max Voronkov & Tim Cornwell ASKAP team 2nd April 2009 Outline - Imaging software ASKAPsoft re-uses LOFAR design Imaging is treated as
Contrast Optimization A new way to optimize performance Kenneth Moore, Technical Fellow
 Contrast Optimization A new way to optimize performance Kenneth Moore, Technical Fellow What is Contrast Optimization? Contrast Optimization (CO) is a new technique for improving performance of imaging
OSKAR-2: Simulating data from the SKA
 OSKAR-2: Simulating data from the SKA AACal 2012, Amsterdam, 13 th July 2012 Fred Dulwich, Ben Mort, Stef Salvini 1 Overview OSKAR-2: Interferometer and beamforming simulator package. Intended for simulations
SSW, Radio, X-ray, and data analysis
 SSW, Radio, X-ray, and data analysis Eduard Kontar School of Physics and Astronomy University of Glasgow, UK CESRA Summer School, Glasgow, August 2015 SSW Pre-school installation guide for IDL, SSW and
4 Image Reconstruction Studies
 APreS-MIDI SCIENCE CASE STUDY 43 4 Image Reconstruction Studies [F. PRZYGODDA, S. WOLF, K.-H. HOFMANN, S. KRAUS, L. MOSONI, TH. RATZKA] The main goal of APRES-MIDI is to perform imaging in the mid-infrared
EVLA memo 77. EVLA and SKA computing costs for wide field imaging. (Revised) 1. T.J. Cornwell, NRAO 2
 1. T.J. Cornwell, NRAO 2") EVLA memo 77 EVLA and SKA computing costs for wide field imaging (Revised) 1 T.J. Cornwell, NRAO 2 tcornwel@nrao.edu Abstract: I investigate the problem of high dynamic range continuum imaging in the presence
EVLA memo 77 EVLA and SKA computing costs for wide field imaging (Revised) 1 T.J. Cornwell, NRAO 2 tcornwel@nrao.edu Abstract: I investigate the problem of high dynamic range continuum imaging in the presence
Controlling Field-of-View of Radio Arrays using Weighting Functions
 Controlling Field-of-View of Radio Arrays using Weighting Functions MIT Haystack FOV Group: Lynn D. Matthews,Colin Lonsdale, Roger Cappallo, Sheperd Doeleman, Divya Oberoi, Vincent Fish Fulfilling scientific
Computer Vision I. Announcements. Fourier Tansform. Efficient Implementation. Edge and Corner Detection. CSE252A Lecture 13.
 Announcements Edge and Corner Detection HW3 assigned CSE252A Lecture 13 Efficient Implementation Both, the Box filter and the Gaussian filter are separable: First convolve each row of input image I with
Outline. Sampling and Reconstruction. Sampling and Reconstruction. Foundations of Computer Graphics (Fall 2012)
") Foundations of Computer Graphics (Fall 2012) CS 184, Lectures 19: Sampling and Reconstruction http://inst.eecs.berkeley.edu/~cs184 Outline Basic ideas of sampling, reconstruction, aliasing Signal processing
Foundations of Computer Graphics (Fall 2012) CS 184, Lectures 19: Sampling and Reconstruction http://inst.eecs.berkeley.edu/~cs184 Outline Basic ideas of sampling, reconstruction, aliasing Signal processing
Outline. Foundations of Computer Graphics (Spring 2012)
") Foundations of Computer Graphics (Spring 2012) CS 184, Lectures 19: Sampling and Reconstruction http://inst.eecs.berkeley.edu/~cs184 Basic ideas of sampling, reconstruction, aliasing Signal processing
Foundations of Computer Graphics (Spring 2012) CS 184, Lectures 19: Sampling and Reconstruction http://inst.eecs.berkeley.edu/~cs184 Basic ideas of sampling, reconstruction, aliasing Signal processing
Adaptive selfcalibration for Allen Telescope Array imaging
 Adaptive selfcalibration for Allen Telescope Array imaging Garrett Keating, William C. Barott & Melvyn Wright Radio Astronomy laboratory, University of California, Berkeley, CA, 94720 ABSTRACT Planned
Contrast Optimization: A faster and better technique for optimizing on MTF ABSTRACT Keywords: INTRODUCTION THEORY
 Contrast Optimization: A faster and better technique for optimizing on MTF Ken Moore, Erin Elliott, Mark Nicholson, Chris Normanshire, Shawn Gay, Jade Aiona Zemax, LLC ABSTRACT Our new Contrast Optimization
Michael Moody School of Pharmacy University of London 29/39 Brunswick Square London WC1N 1AX, U.K.
 This material is provided for educational use only. The information in these slides including all data, images and related materials are the property of : Michael Moody School of Pharmacy University of
Computational issues for HI
 Computational issues for HI Tim Cornwell, Square Kilometre Array How SKA processes data Science Data Processing system is part of the telescope Only one system per telescope Data flow so large that dedicated
Sampling, Aliasing, & Mipmaps
 Sampling, Aliasing, & Mipmaps Last Time? Monte-Carlo Integration Importance Sampling Ray Tracing vs. Path Tracing source hemisphere What is a Pixel? Sampling & Reconstruction Filters in Computer Graphics
Sampling, Aliasing, & Mipmaps
 Sampling, Aliasing, & Mipmaps Last Time? Monte-Carlo Integration Importance Sampling Ray Tracing vs. Path Tracing source hemisphere Sampling sensitive to choice of samples less sensitive to choice of samples
Scaled representations
 Scaled representations Big bars (resp. spots, hands, etc.) and little bars are both interesting Stripes and hairs, say Inefficient to detect big bars with big filters And there is superfluous detail in
Theoretically Perfect Sensor
 Sampling 1/67 Sampling The ray tracer samples the geometry, only gathering information from the parts of the world that interact with a finite number of rays In contrast, a scanline renderer can push all
Scanner Parameter Estimation Using Bilevel Scans of Star Charts
 ICDAR, Seattle WA September Scanner Parameter Estimation Using Bilevel Scans of Star Charts Elisa H. Barney Smith Electrical and Computer Engineering Department Boise State University, Boise, Idaho 8375
Image restoration. Lecture 14. Milan Gavrilovic Centre for Image Analysis Uppsala University
 Image restoration Lecture 14 Milan Gavrilovic milan@cb.uu.se Centre for Image Analysis Uppsala University Computer Assisted Image Analysis 2009-05-08 M. Gavrilovic (Uppsala University) L14 Image restoration
Theoretically Perfect Sensor
 Sampling 1/60 Sampling The ray tracer samples the geometry, only gathering information from the parts of the world that interact with a finite number of rays In contrast, a scanline renderer can push all
Computer Vision. Fourier Transform. 20 January Copyright by NHL Hogeschool and Van de Loosdrecht Machine Vision BV All rights reserved
 Van de Loosdrecht Machine Vision Computer Vision Fourier Transform 20 January 2017 Copyright 2001 2017 by NHL Hogeschool and Van de Loosdrecht Machine Vision BV All rights reserved j.van.de.loosdrecht@nhl.nl,
Computational Aspects of MRI
 David Atkinson Philip Batchelor David Larkman Programme 09:30 11:00 Fourier, sampling, gridding, interpolation. Matrices and Linear Algebra 11:30 13:00 MRI Lunch (not provided) 14:00 15:30 SVD, eigenvalues.
Computer Vision and Graphics (ee2031) Digital Image Processing I
 Digital Image Processing I") Computer Vision and Graphics (ee203) Digital Image Processing I Dr John Collomosse J.Collomosse@surrey.ac.uk Centre for Vision, Speech and Signal Processing University of Surrey Learning Outcomes After
Computer Vision and Graphics (ee203) Digital Image Processing I Dr John Collomosse J.Collomosse@surrey.ac.uk Centre for Vision, Speech and Signal Processing University of Surrey Learning Outcomes After
Sampling, Aliasing, & Mipmaps
 Last Time? Sampling, Aliasing, & Mipmaps 2D Texture Mapping Perspective Correct Interpolation Common Texture Coordinate Projections Bump Mapping Displacement Mapping Environment Mapping Texture Maps for
Testbed experiment for SPIDER: A photonic integrated circuit-based interferometric imaging system
 Testbed experiment for SPIDER: A photonic integrated circuit-based interferometric imaging system Katherine Badham, Alan Duncan, Richard L. Kendrick, Danielle Wuchenich, Chad Ogden, Guy Chriqui Lockheed
PHYSICS. Chapter 33 Lecture FOR SCIENTISTS AND ENGINEERS A STRATEGIC APPROACH 4/E RANDALL D. KNIGHT
 PHYSICS FOR SCIENTISTS AND ENGINEERS A STRATEGIC APPROACH 4/E Chapter 33 Lecture RANDALL D. KNIGHT Chapter 33 Wave Optics IN THIS CHAPTER, you will learn about and apply the wave model of light. Slide
Fourier analysis and sampling theory
 Reading Required: Shirley, Ch. 9 Recommended: Fourier analysis and sampling theory Ron Bracewell, The Fourier Transform and Its Applications, McGraw-Hill. Don P. Mitchell and Arun N. Netravali, Reconstruction
Image Processing and Analysis
 Image Processing and Analysis 3 stages: Image Restoration - correcting errors and distortion. Warping and correcting systematic distortion related to viewing geometry Correcting "drop outs", striping and
From multiple images to catalogs
 Lecture 14 From multiple images to catalogs Image reconstruction Optimal co-addition Sampling-reconstruction-resampling Resolving faint galaxies Automated object detection Photometric catalogs Deep CCD
Announcements. Image Matching! Source & Destination Images. Image Transformation 2/ 3/ 16. Compare a big image to a small image
 2/3/ Announcements PA is due in week Image atching! Leave time to learn OpenCV Think of & implement something creative CS 50 Lecture #5 February 3 rd, 20 2/ 3/ 2 Compare a big image to a small image So
Computer Graphics. Sampling Theory & Anti-Aliasing. Philipp Slusallek
 Computer Graphics Sampling Theory & Anti-Aliasing Philipp Slusallek Dirac Comb (1) Constant & δ-function flash Comb/Shah function 2 Dirac Comb (2) Constant & δ-function Duality f(x) = K F(ω) = K (ω) And
Self-calibration: about the implementation in GILDAS. Vincent Piétu IRAM. IRAM millimeter interferometry summerschool
 Self-calibration: about the implementation in GILDAS Vincent Piétu IRAM 1 About an interferometer sensitivity One usually considers only the noise equation to assess the feasibility of an observation.
CASA. Algorithms R&D. S. Bhatnagar. NRAO, Socorro
 Algorithms R&D S. Bhatnagar NRAO, Socorro Outline Broad areas of work 1. Processing for wide-field wide-band imaging Full-beam, Mosaic, wide-band, full-polarization Wide-band continuum and spectral-line
Edge and local feature detection - 2. Importance of edge detection in computer vision
 Edge and local feature detection Gradient based edge detection Edge detection by function fitting Second derivative edge detectors Edge linking and the construction of the chain graph Edge and local feature
Segmentation and Grouping
 Segmentation and Grouping How and what do we see? Fundamental Problems ' Focus of attention, or grouping ' What subsets of pixels do we consider as possible objects? ' All connected subsets? ' Representation
Array Design. Introduction
 Introduction 2 Array Design Mark Wieringa (ATNF) Normally we use arrays the way they are.. Just decide on observing parameters and best configuration for particular experiment Now turn it around try to
Imaging Strategies and Postprocessing Computing Costs for Large-N SKA Designs
 Imaging Strategies and Postprocessing Computing Costs for Large-N SKA Designs Colin J. Lonsdale Sheperd S Doeleman Divya Oberoi MIT Haystack Observatory 17 July 2004 Abstract: The performance goals of
Super-resolution Polarimetric Imaging of Black Holes using the Event Horizon Telescope
 Super-resolution Polarimetric Imaging of Black Holes using the Event Horizon Telescope MIT Haystack Observatory Mollie Pleau Mentors: Kazunori Akiyama Vincent Fish The Event Horizon Telescope (EHT) Created
Visualization & the CASA Viewer
 Visualization & the Viewer Juergen Ott & the team Atacama Large Millimeter/submillimeter Array Expanded Very Large Array Robert C. Byrd Green Bank Telescope Very Long Baseline Array Visualization Goals:
A Wiener Filter Version of Blind Iterative Deconvolution
 A Wiener Filter Version of Blind Iterative Deconvolution P. Nisenson, C.Standley, and D. Gay Harvard-Smithsonian Center for Astrophysics I. Introduction Over the last decade, great progress has been made
Peripheral drift illusion
 Peripheral drift illusion Does it work on other animals? Computer Vision Motion and Optical Flow Many slides adapted from J. Hays, S. Seitz, R. Szeliski, M. Pollefeys, K. Grauman and others Video A video
How reliable is statistical wavelet estimation? Jonathan Edgar*, BG Group, and Mirko van der Baan, University of Alberta
 Jonathan Edgar*, BG Group, and Mirko van der Baan, University of Alberta Summary Well logs are often used for the estimation of seismic wavelets. The phase is obtained by forcing a well-derived synthetic
Waves & Oscillations
 Physics 42200 Waves & Oscillations Lecture 37 Interference Spring 2016 Semester Matthew Jones Multiple Beam Interference In many situations, a coherent beam can interfere with itself multiple times Consider
Optical simulations within and beyond the paraxial limit
 Optical simulations within and beyond the paraxial limit Daniel Brown, Charlotte Bond and Andreas Freise University of Birmingham 1 Simulating realistic optics We need to know how to accurately calculate
Image Processing. Filtering. Slide 1
 Image Processing Filtering Slide 1 Preliminary Image generation Original Noise Image restoration Result Slide 2 Preliminary Classic application: denoising However: Denoising is much more than a simple
MAPPING. March 29th, Version 2.0. Questions? Comments? Bug reports? Mail to:
 i MAPPING A gildas software March 29th, 2007 Version 2.0 Questions? Comments? Bug reports? Mail to: gildas@iram.fr The gildas team welcomes an acknowledgment in publications using gildas software to reduce
Basics. Sampling and Reconstruction. Sampling and Reconstruction. Outline. (Spatial) Aliasing. Advanced Computer Graphics (Fall 2010)
 Aliasing. Advanced Computer Graphics (Fall 2010)") Advanced Computer Graphics (Fall 2010) CS 283, Lecture 3: Sampling and Reconstruction Ravi Ramamoorthi http://inst.eecs.berkeley.edu/~cs283/fa10 Some slides courtesy Thomas Funkhouser and Pat Hanrahan
Advanced Computer Graphics (Fall 2010) CS 283, Lecture 3: Sampling and Reconstruction Ravi Ramamoorthi http://inst.eecs.berkeley.edu/~cs283/fa10 Some slides courtesy Thomas Funkhouser and Pat Hanrahan
Some Blind Deconvolution Techniques in Image Processing
 Some Blind Deconvolution Techniques in Image Processing Tony Chan Math Dept., UCLA Joint work with Frederick Park and Andy M. Yip IPAM Workshop on Mathematical Challenges in Astronomical Imaging July 26-30,
ERROR RECOGNITION & IMAGE ANALYSIS. Gustaaf van Moorsel (NRAO) Ed Fomalont (NRAO) Twelfth Synthesis Imaging Workshop 2010 June 8-15
 Ed Fomalont (NRAO) Twelfth Synthesis Imaging Workshop 2010 June 8-15") ERROR RECOGNITION & IMAGE ANALYSIS Gustaaf van Moorsel (NRAO) Ed Fomalont (NRAO) Twelfth Synthesis Imaging Workshop 2010 June 8-15 INTRODUCTION Why are these two topics Error Recognition and Image Analysis
ERROR RECOGNITION & IMAGE ANALYSIS Gustaaf van Moorsel (NRAO) Ed Fomalont (NRAO) Twelfth Synthesis Imaging Workshop 2010 June 8-15 INTRODUCTION Why are these two topics Error Recognition and Image Analysis
Sampling and Monte-Carlo Integration
 Sampling and Monte-Carlo Integration Sampling and Monte-Carlo Integration Last Time Pixels are samples Sampling theorem Convolution & multiplication Aliasing: spectrum replication Ideal filter And its
Frequency analysis, pyramids, texture analysis, applications (face detection, category recognition)
") Frequency analysis, pyramids, texture analysis, applications (face detection, category recognition) Outline Measuring frequencies in images: Definitions, properties Sampling issues Relation with Gaussian
Frequency analysis, pyramids, texture analysis, applications (face detection, category recognition) Outline Measuring frequencies in images: Definitions, properties Sampling issues Relation with Gaussian
Modeling Antenna Beams
 Modeling Antenna Beams Walter Brisken National Radio Astronomy Observatory 2011 Sept 22 1 / 24 What to learn from this talk EM simulations of antennas can be complicated Many people have spent careers
Image Processing: Discrete Images
 7 Image Processing: Discrete Images In the previous chapter we explored linear, shift-invariant systems in the continuous two-dimensional domain. In practice, we deal with images that are both limited
WORCESTER POLYTECHNIC INSTITUTE
 WORCESTER POLYTECHNIC INSTITUTE MECHANICAL ENGINEERING DEPARTMENT Optical Metrology and NDT ME-593L, C 2018 Introduction: Wave Optics January 2018 Wave optics: coherence Temporal coherence Review interference
Image Filtering, Warping and Sampling
 Image Filtering, Warping and Sampling Connelly Barnes CS 4810 University of Virginia Acknowledgement: slides by Jason Lawrence, Misha Kazhdan, Allison Klein, Tom Funkhouser, Adam Finkelstein and David
Today. Anti-aliasing Surface Parametrization Soft Shadows Global Illumination. Exercise 2. Path Tracing Radiosity
 Today Anti-aliasing Surface Parametrization Soft Shadows Global Illumination Path Tracing Radiosity Exercise 2 Sampling Ray Casting is a form of discrete sampling. Rendered Image: Sampling of the ground