Unit 2: Function Transformation Chapter 1. Basic Transformations Reflections Inverses
|
|
|
- Marshall Byrd
- 6 years ago
- Views:
Transcription


1 Unit 2: Function Transformation Chapter 1 Basic Transformations Reflections Inverses
2 Section 1.1: Horizontal and Vertical Transformations A transformation of a function alters the equation and any combination of the location, shape, and orientation of the graph. Mapping: the relationship between a set of points of an original graph and the transformed graph.
3 Translations A translation moves the graph right, left up or down. The shape or orientation does not change. A translated graph is congruent (same size) to the original graph.
4 Horizontal Translation Moves the graph left or right. What are the equations for each graph? y y y x x x
5 A horizontal translation of function y = f (x) by h units is written y = f (x h). Each point (x, y) on the graph of the base function is mapped to (x + h, y) on the transformed function. This is shown using a mapping rule: x, y x h, y Note that the sign of h is opposite to the sign in the equation of the function.
6 If h is positive, the graph of the function shifts to the right. Example: In y = f (x 1), h = 1. Each point (x, y) on the graph of y = f (x) is mapped to (x + 1, y). This is shown by the mapping rule If f (x) = x 2, (2, 4) maps to (3, 4). 2,4 3,4 x, y x 1, y
7 If h is negative, the graph of the function shifts to the left. Example: In y = f (x + 5), h = 5. Each point (x, y) on the graph of y = f (x) is mapped to (x 5, y). This is shown by the mapping rule If f (x) = x 2, (2, 4) maps to ( 3, 4). 2,4 3,4 x, y x 5, y
8 What translation is the graph on the right?
9 A vertical translation of function y = f (x) by k units is written y - k = f (x). Each point (x, y) on the graph of the base function is mapped to (x, y + k) on the transformed function. This is shown using a mapping rule: x, y x, y k Note that the sign of k is opposite to the sign in the equation of the function.
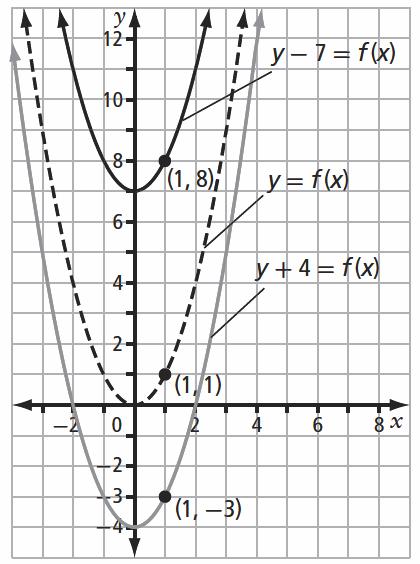
10 If k is positive, the graph of the function shifts upward. Example: In y - 7 = f (x), k = 7. Each point (x, y) on the graph of y = f (x) is mapped to (x, y + 7). This is shown by the mapping rule If f (x) = x 2, (1, 1) maps to (1, 8). 1,1 1,8 x, y x, y 7
11 If k is negative, the graph of the function shifts downward. Example: In y + 4 = f (x), k = 4. Each point (x, y) on the graph of y = f (x) is mapped to (x, y - 4). If f (x) = x 2, (1, 1) maps to (1, -3). 1,1 1, 3
12
13 Vertical and horizontal translations may be combined. The graph of y k = f (x h) maps each point (x, y) in the base function to (x + h, y + k) in the transformed function. Mapping rule: x, y x h, y k
14 Example 1: Graph Translations of the Form y k = f (x h) a) For f (x) = x, graph y + 6 = f (x 4) and give the equation of the transformed function. Solution a) For f (x) = x, the transformed function y + 6 = f (x 4) is represented by y + 6 = x 4. h = means a horizontal translation units to the k = means a vertical translation units Mapping Rule: x, y x h, y k x, y x 4, y 6

15 Sketch the graph of f(x) = x What are some key points to able to draw y = x? Perform the mapping rule to x, y x 4, y 6 obtain key points of the transformed graph. y Add these points to your graph and draw in the lines. Key points: x
16 Example 1: Graph Translations of the Form y k = f (x h) b) For f (x) as shown, graph y + 5 = f (x + 2). Solution The function y = f (x) shown in the graph above will be transformed as follows: h = means a horizontal translation units to the k = means a vertical translation units
17 What are some key points to able to draw y = f(x)? (e.g., maximum and minimum values, endpoints) Map them to new coordinates under the transformation:y + 5 = f (x + 2) Mapping Rule: y Key points: x
18 Example 2: Graph Translations of the Form y = f (x h) + k y For f (x) as shown, graph y = f (x - 3) + 4. Solution: Re-write into transformational form x The function y = f (x) shown in the graph above will be transformed as follows: h = means a horizontal translation units to the k = means a vertical translation units
19 What are some key points to able to draw y = f(x) (e.g., maximum and minimum values, endpoints) Map them to new coordinates y under the transformation:y - 4 = f (x - 3) Mapping Rule: x y Key points: x

20 Example 3. Complete the table
21 Example 4: A) What vertical translation is applied to y = x 2 if the transformed graph passes through the point (2, 10)? B) What horizontal translation is applied to y = x 2 if the transformed graph passes through the point (0, 25)?
22 pg 12 #1-4,6, 7 Exit Card
23 Exit Card Given the graph of y = f (x), to create a mapping rule and a table of values for each of the transformations below and graph the transformed functions. (i) y + 2 = f (x - 6) (ii) y = f (x + 2) + 5 (iii)y = f (x - 4) - 7 y=f(x) (i) (ii) (iii)
24 Example 5: Determine the Equation of a Translated Function Note: It is a common convention to use a prime () next to each letter representing an image point. Verify that the shapes are congruent by comparing slopes and lengths of line segments. Identify key points in the base function and where they are mapped to in the translation.
25 What are the transformations? Horizontal: h = Vertical: k = What is the equation of the translated function g(x)? y k = f (x h)

26 Example 6. What is the equation of the image graph, g(x), in terms of f(x) = x 2?

27 Your Turn 1.What is the equation of the image graph, g(x), in terms of f(x) = x?

28 Your Turn 2.What is the equation of the image graph, g(x), in terms of f(x)?
29 pg #9, 11
30 Section 1.2 Reflections and Stretches Part A: Reflections We have already seen reflections in Math 2200 with quadratics. A reflection of a graph creates a mirror image in a line called the line of reflection. Reflections, like translations, do not change the shape of the graph. Any points where the function crosses the line of reflection do not move (invariant points). However, unlike translations, reflections may change the orientation of the graph.
31 y = f (x) Vertical reflection: Mapping rule: (x, y) (x, y) line of reflection: x-axis also known as a reflection in the x-axis
32 Horizontal reflection: y = f ( x) Mapping rule: (x, y) ( x, y) line of reflection: y-axis also known as a reflection in the y-axis
33 Example 1: Graph Reflections of a Function y = f (x) Given y = f (x), graph the indicated transformation on the same set of axes. Give the mapping notation representing the transformation. Identify any invariant points.
34 y a) y = f ( x) y = f ( x) represents a reflection of the function in the _-axis. Mapping rule: x Invariant point(s):
35 y b) y = -f (x) y = -f (x) represents a reflection of the function in the _-axis. Mapping rule: x Invariant point(s):
36 y c) y = -f (-x) y = -f ( x) represents reflection of the function in the -axes. Mapping rule: x Invariant point(s):
37 Example 2: What transformation is shown by the graphs below? A) Horizontal reflection y = f(-x) B) Horizontal reflection y = -f(x) C) Vertical reflection y = f(-x) D) Vertical reflection y = -f(x) y x
38
39 Part B: Horizontal and Vertical Stretches A stretch, unlike a translation or a reflection, changes the shape of the graph. However, like translations, stretches do not change the orientation of the graph.
40 A vertical stretch makes a function shorter (compression) or taller (expansion) because the stretch multiplies or divides each y-coordinate by a constant factor while leaving the x-coordinate unchanged. x, y x, ay a is positive Note: Negative a (or b) means reflection not a negative stretch shorter: taller: 0 a 1 a 1
41 A horizontal stretch makes a function narrower (compression) or wider (expansion) because the stretch multiplies or divides each x-coordinate by a constant factor while leaving the y- coordinate unchanged. 1 x, y x, y b 0 b 1 wider: narrower: b 1 b is positive
42 Example 1:Given f(x), graph 2y= f(x). Describe the transformation Vertical stretch by a factor of ½. Mapping rule: 1 x, y x, y 2 Sketch the graph y x State any invariant points State the domain and range of the transformed function
43 How is the domain and/or range affected by the transformation 2y= f(x)? Original Range New Range 0,6 0,3 Span of 6 Span of New span (range) = Old Span (Range) X VS
44 Example 2:Given f(x), graph y= 2f(x). Describe the transformation Vertical stretch by a factor of 2. Mapping rule: x, y x,2y Sketch the graph State any invariant points State the domain and range of the transformed function Is the equation New span (range) = Old Span (Range) X VS still true? y x
45 Example 3:Given f(x), graph y= f(2x). Describe the transformation Horizontal stretch by a factor of ½ Mapping rule: 1 x, y x, y 2 Sketch the graph State any invariant points State the domain and range of the transformed function y x
46 How is the domain and/or range affected by the transformation y= f(2x)? Original Domain New Domain 4,4 2,2 Span of 8 Span of New span (Domain) = Old Span (Domain) X HS
47 Example 4:Given f(x), graph Describe the transformation Horizontal stretch by a factor of 2 Mapping rule: x, y 2 x, y Sketch the graph x y f 2 y State any invariant points State the domain and range of the transformed function Is the equation New span (Domain) = Old Span (Domain) X HS still true? x
48 Example 5: Graph Vertical and Horizontal Stretches of a Function y=f(x) A) Graph y = 5f(3x) on the same set of axes. a = represents a vertical stretch by a factor of. Will the new graph be shorter or taller than the graph of the base function? b = represents a horizontal stretch by a factor of. Will the new graph be wider or narrower than the graph of the base function? Give the mapping notation representing the transformation.
49 Example 5: Graph Vertical and Horizontal Stretches of a Function y=f(x) B) Graph 2y = f(4x) on the same set of axes. a = represents a vertical stretch by a factor of. Will the new graph be shorter or taller than the graph of the base function? b = represents a horizontal stretch by a factor of. Will the new graph be wider or narrower than the graph of the base function? Give the mapping notation representing the transformation.
50 Example 6: Write the Equation of a Transformed Function For each of the following the graph of the function y = f (x) has been transformed by a series of stretches and/or reflections. Write the equation of the transformed function g(x).
51 Has the orientation changed (reflection)? In which direction? Has the shape changed (stretch)? In which direction? By how much? Recall: New span (Domain) = Old Span (Domain) X HS New span (Domain) HS = Old Span (Domain) Equation:
 = Old Span (Range) X VS In this case we must set the range to finite values since the actual range is infinite Range of f(x) = Range of g(x)= New span (Range) VS = Old Span (Range)")
52 b) The base function f (x) is not shown. What must it be? Add it to the graph. Has the orientation changed (reflection)? In which direction? Has the shape changed (stretch)? In which direction? By how much? New span (Range) = Old Span (Range) X VS In this case we must set the range to finite values since the actual range is infinite Range of f(x) = Range of g(x)= New span (Range) VS = Old Span (Range) Equation:
53 Example 7. Determine the values of a and b from the graph.
54 Page 29 # 5, 6, 7 8

55 Section 1.3 Combining Transformations
56 Sketch the graph of the function y - k = af (b(x - h)) We have worked with translations, reflections in the x- and y-axis, and stretches. For the most part, these transformations have been addressed independently of one another. We will now extend our work to functions and graphs that have all types of transformations.
57 When graphing the function y k = af (b(x h)) given the graph of y = f(x), the graph can be drawn using two methods: 1. The graph could be created using transformations. The transformations are applied to each point to produce the transformed graph 2. The graph could be created from a table of values generated by a mapping rule: 1 x, y x h, ay k b
58 Example 1. Using the graph of the function, y = f (x), shown below, graph the transformed function y = 2 f (3(x 1))+ 4. Method 1 In this method it is important to preserve the order of operations. Since stretches and reflections are the result of multiplication and translations are the result of addition, the stretches and reflections are applied first.
59 Apply the following transformations to each point to produce the transformed graph: horizontal stretch of 1/3 y vertical stretch of 2 reflection in the x-axis horizontal translation of 1 unit right vertical translation of 4 units up x
60 Note the stretches and reflections can be applied in any order, as long as it is before the translations. Similarly, the order in which the translations are applied is not important, as long as they are applied after the stretches and reflections.
61 Method 2: Mapping rule y = 2 f (3(x 1))+ 4 y x
62 Example 2. Graph y - 6 = 3f (2x - 4) given the graph of Y = f(x) below. y Note: It is sometimes necessary to rewrite a function before it can be graphed. Before graphing y - 6 = 3f (2x - 4), for example, you should write the function as y - 6 = 3f (2(x - 2)). This will help correctly identify the value of h as 2, rather than 4.
63 y - 6 = 3f (2(x - 2)) Method 1 horizontal stretch of 1/2 y vertical stretch of 3 no reflection horizontal translation of 2 units right vertical translation of 6 units up x
64 y - 6 = 3f (2(x - 2)) Method 2 Mapping Rule: y x
65 Given the graph of the function y = f (x) shown, sketch the graph of y 2f 3x 1 2
66 Example4: Given the function f (x) = x 2, sketch the graph of the transformed graph g(x) = -3(3x + 3) + 2 y x
67
.")
68 Finding the equation of a function, given its graph which is a translation and/or stretch of the graph of the function y = f (x). Section 1.3
69 In this section we will compare the graph of a base function with the graph of a transformed function, identify all transformations, and state the equation and/or mapping rule of the transformed function. The focus is on functions that have a bounded domain and range.
70 Example 1 Find the equation of g(x) as a transformation of f(x): We will find the stretches first, then the reflections and finally the translations
71 To find the stretches we need to compare the domain and range of both functions. Horizontal Stretch What is the domain of each function? The domain of f (x) is [ 3, 4] which has a span of 7 units The domain of g(x) is [ 9, 5] which has a span of 14 units. Recall: New span (Domain) HS = Old Span (Domain) Therefore, g(x) has a horizontal stretch of.
72 Vertical Stretch What is the range of each function? The range of f (x) is which has a span of units The range of g(x) is which has a span of units. Recall: New span (Range) VS = Old Span (Range) Therefore, g(x) has a vertical stretch of.
73 Is the graph reflected? Yes, in the y-axis We have a horizontal reflection. Thus in our equation g(x) = af(b(x h)) + k a = 3 and b = -1/2
74 Applying these transformations to f(x) produces the equation y= 3f (-1/2x) which gives the graph: y x
75 Compare the key points of this graph to g(x): notice that the graph must be shifted 1 unit left and 4 units up to produce g(x), resulting in the function: 1 g( x ) 3f x 1 4 2
76 EXAMPLE 2 Using the graph shown, determine the specific equation for the image of y = f(x) in the form y= af(b(x h)) + k
77 Example 3 Page 40 #10 (Pick one)
78
79
80 Inverse of a Relation Section 1.4 Page 44
81 INVERSE RELATIONS In this section we will: explore the relationship between the graph of a relation and its inverse determine whether a relation and its inverse are functions. produce the graph of an inverse from the graph of the original relation restrict the domain of a function so that its inverse is also a function determine the equation for the inverse function f -1 given the equation for f.
82 What is an inverse? An inverse of a relation undoes whatever the original relation did. For example: The inverse of opening a door is closing the door; the inverse of wrapping a gift is unwrapping a gift. From a mathematics perspective, think of inverse relations as undoing all of the mathematical operations.
83 Examples of inverses Function Inverse f(x) = x + 2 f -1 (x) = x - 2 g(x) =5x h(x) = x 3 f(x) = sin x
84 Consider a table of values for y = x + 4 and its inverse, y = x 4, The tables shows that the x and y values are interchanged. What is the mapping for the inverse? (x, y) (y, x)
85 The reversal of the x and y values represent an undoing of a process. The input of the function is the output of the inverse, and vice versa. This leads to the relationship between the domains and ranges of a relation and its inverse. The Domain of the function is the Range of the Inverse The Range of the function is the Domain of the Inverse
86 Use (x, y) (y, x) to create a table of values for the inverse of a function, y=f(x) x y =f(x) x y Is there a reflective symmetry when the graphs of f and the inverse are sketched on the same set of axes? Yes. What is the axis of symmetry? The line y = x. Are there any invariant points? Is the inverse a function? No. It fails the vertical line test.
87 Sketch the graph of the inverse for the function sketched below using the line y = x. y When sketching an inverse using y = x, keep in mind: x the invariant points all other points are reflected perpendicularly across the line of reflection Is the inverse a function?
88 Sketch the graph of the inverse for the function sketched below using the line y = x. Is the inverse a function?
89 How can we tell if the inverse will be a function before we draw it? Consider the last 3 examples. y x What kind of line test could be used with the graph of y = f (x) to determine if its inverse would be a function? A Horizontal Line
90 Horizontal Line Test If it is possible for a horizontal line to intersect the graph of a relation more than once, then the inverse of the relation is NOT a function.
91 Example: Determine whether the inverse of each relation graphed here is a function, without actually sketching it.
92
93 (iii)
94 Do Page 52
95 Inverse Functions f 1 x The inverse of a function y = f (x) is denoted 1 y f x only if the inverse is a function. The 1 is not an exponent because f represents a function, not a variable. Note: f x 1 1 However, f x f( x) 1 f( x) You have already seen this notation with trigonometric functions. Example: q sin 1 (x), where sin(q) = x 1
96 y x Consider f(x) = 2x + 3 Does this graph have an inverse function? Yes! Why? It passes the horizontal line test. So how do we find the equation of the inverse function?
97 To determine the inverse of a function, interchange the x- and y-coordinates. Reflect in the line y = x OR x, y y, x OR y f ( x ) x f ( y ) Interchanging x and y Finding Graph of Inverse Finding Equation of Inverse
98 Finding equations of inverses: 1. Let y = f(x) 2. Interchange x and y 3. Solve for y 4. If the inverse is a function, then y = f -1 (x)
99 Going back to f(x) = 2x Let y = f(x) 2. Interchange x and y y 2x 3 x 2y 3 3. Solve for y 2y x y x If the inverse is a function, then y = f -1 (x) f ( x ) x 2 2
100 Example 1 Find f -1 (x) for A) f(x) = x + 2 B) f( x) x 5 2
101 Example 2 There is a function that converts degrees Celsius to Fahrenheit F A) What is 25 o C in o F? 9 C 32 5 B) Find the inverse function that converts Fahrenheit to Celsius? C) What is 0 o F in o C
102 Page 52 Do # 5a, d, f, 6 a, b, c
103 So what happens if the inverse of a function is not a function? We must restrict the domain of the original function so that the inverse becomes a function. You will see this frequently with quadratic functions and later with trigonometric functions
104 For Quadratics The domain must be restricted to obtain an inverse function because a parabola fails the horizontal line test.
105 y x Consider y = x 2 Does this graph have an inverse function? NO! Why? It fails the horizontal line test. We must restrict the domain so that the inverse is a function.
106 There are 3 things to keep in mind when restricting the domain: 1) The restricted function must pass the horizontal line test. 2) We want to include the complete set of y-values. (ALL of the RANGE) 3) We want to include the centre part of the graph. This is the vertex for quadratic functions It will be the y-intercept for Trig functions
107 Consider f(x) = x 2 Find the inverse relation:
108 Restriction Based on the vertex x 0 Lets take for y = x 2. y 0 This gives for the inverse. y x y f 1 ( x ) x x
109 Restriction Based on the vertex x 0 What if we took for y = x 2. y 0 This gives for the inverse. y x y 1 ( ) f x x x
110 In general, for Quadratics The domain is restricted based on the vertex. If the vertex is (h, k) then we can take x or x common h h, although this is not as

111 Page 52, #4
112 Examples: 1. Find the inverse function of f(x) = x 2-4
113 What restriction do we take? What is the vertex? 0, 4 x 0 x 0 f 1 ( x ) x 4 f 1 ( x ) x 4
114 2. Find the inverse function of f(x) = x 2 + 6x + 2
115 What restriction do we take? What is the vertex? b Recall x 2a x 3 x 3
116 3. Find the inverse function of f(x) = 2x 2 8x + 11
117
118 Homework State the restricted domain for each of the following relations so that the inverse relation is a function, and write the equation of the inverse:
119 Page 53 # 9, d) e) #10
120 Determine, algebraically or graphically, if two functions are inverses of each other. When presented with two functions, you should be able to determine whether or not they are inverses of one another. This can be done on a graph that displays both functions by sketching the line y = x and deciding if the functions are mirror images of one another. Algebraically, you could be given the equation representing each function. In this case determine the equation of the inverse of one of the given functions, and then decide if it is equivalent to the other given function.
121 1. Which of the following represent a function and its inverse function? A) B) y y x x
122 BONUS: Determine the equations of both graphs C) y x
123 Match each of the equations from the first list with its inverse in the second list:
124 Page 53
125 Page 54
Unit 2: Function Transformation Chapter 1
 Basic Transformations Reflections Inverses Unit 2: Function Transformation Chapter 1 Section 1.1: Horizontal and Vertical Transformations A of a function alters the and an combination of the of the graph.
Transformation a shifting or change in shape of a graph
 1.1 Horizontal and Vertical Translations Frieze Patterns Transformation a shifting or change in shape of a graph Mapping the relating of one set of points to another set of points (ie. points on the original
1.1 Horizontal & Vertical Translations
 PC 30 1.1 Horizontal & Vertical Translations To determine the effects of h and k in y = f(x - h) + k on the graph of y = f(x) (Note: Sometimes the above equation y = f(x - h) + k is rewritten as y - k
1.1: Basic Functions and Translations
 .: Basic Functions and Translations Here are the Basic Functions (and their coordinates!) you need to get familiar with.. Quadratic functions (a.k.a. parabolas) y x Ex. y ( x ). Radical functions (a.k.a.
CHAPTER 6 Quadratic Functions
 CHAPTER 6 Quadratic Functions Math 1201: Linear Functions is the linear term 3 is the leading coefficient 4 is the constant term Math 2201: Quadratic Functions Math 3201: Cubic, Quartic, Quintic Functions
September 18, B Math Test Chapter 1 Name: x can be expressed as: {y y 0, y R}.
 September 8, 208 62B Math Test Chapter Name: Part : Objective Questions [ mark each, total 2 marks]. State whether each of the following statements is TRUE or FALSE a) The mapping rule (x, y) (-x, y) represents
F.BF.B.3: Graphing Polynomial Functions
 F.BF.B.3: Graphing Polynomial Functions 1 Given the graph of the line represented by the equation f(x) = 2x + b, if b is increased by 4 units, the graph of the new line would be shifted 4 units 1) right
5.1 Introduction to the Graphs of Polynomials
 Math 3201 5.1 Introduction to the Graphs of Polynomials In Math 1201/2201, we examined three types of polynomial functions: Constant Function - horizontal line such as y = 2 Linear Function - sloped line,
3.1 INTRODUCTION TO THE FAMILY OF QUADRATIC FUNCTIONS
 3.1 INTRODUCTION TO THE FAMILY OF QUADRATIC FUNCTIONS Finding the Zeros of a Quadratic Function Examples 1 and and more Find the zeros of f(x) = x x 6. Solution by Factoring f(x) = x x 6 = (x 3)(x + )
UNIT 3 EXPRESSIONS AND EQUATIONS Lesson 3: Creating Quadratic Equations in Two or More Variables
 Guided Practice Example 1 Find the y-intercept and vertex of the function f(x) = 2x 2 + x + 3. Determine whether the vertex is a minimum or maximum point on the graph. 1. Determine the y-intercept. The
A function: A mathematical relationship between two variables (x and y), where every input value (usually x) has one output value (usually y)
, where every input value (usually x) has one output value (usually y)") SESSION 9: FUNCTIONS KEY CONCEPTS: Definitions & Terminology Graphs of Functions - Straight line - Parabola - Hyperbola - Exponential Sketching graphs Finding Equations Combinations of graphs TERMINOLOGY
SESSION 9: FUNCTIONS KEY CONCEPTS: Definitions & Terminology Graphs of Functions - Straight line - Parabola - Hyperbola - Exponential Sketching graphs Finding Equations Combinations of graphs TERMINOLOGY
Unit #3: Quadratic Functions Lesson #13: The Almighty Parabola. Day #1
 Algebra I Unit #3: Quadratic Functions Lesson #13: The Almighty Parabola Name Period Date Day #1 There are some important features about the graphs of quadratic functions we are going to explore over the
Warm-Up Exercises. Find the x-intercept and y-intercept 1. 3x 5y = 15 ANSWER 5; y = 2x + 7 ANSWER ; 7
 Warm-Up Exercises Find the x-intercept and y-intercept 1. 3x 5y = 15 ANSWER 5; 3 2. y = 2x + 7 7 2 ANSWER ; 7 Chapter 1.1 Graph Quadratic Functions in Standard Form A quadratic function is a function that
Graphs of Exponential
 Graphs of Exponential Functions By: OpenStaxCollege As we discussed in the previous section, exponential functions are used for many realworld applications such as finance, forensics, computer science,
Quadratic Functions. *These are all examples of polynomial functions.
 Look at: f(x) = 4x-7 f(x) = 3 f(x) = x 2 + 4 Quadratic Functions *These are all examples of polynomial functions. Definition: Let n be a nonnegative integer and let a n, a n 1,..., a 2, a 1, a 0 be real
Transformations with Quadratic Functions KEY
 Algebra Unit: 05 Lesson: 0 TRY THIS! Use a calculator to generate a table of values for the function y = ( x 3) + 4 y = ( x 3) x + y 4 Next, simplify the function by squaring, distributing, and collecting
6.4 Vertex Form of a Quadratic Function
 6.4 Vertex Form of a Quadratic Function Recall from 6.1 and 6.2: Standard Form The standard form of a quadratic is: f(x) = ax 2 + bx + c or y = ax 2 + bx + c where a, b, and c are real numbers and a 0.
9.1: GRAPHING QUADRATICS ALGEBRA 1
 9.1: GRAPHING QUADRATICS ALGEBRA 1 OBJECTIVES I will be able to graph quadratics: Given in Standard Form Given in Vertex Form Given in Intercept Form What does the graph of a quadratic look like? https://www.desmos.com/calculator
Polynomial and Rational Functions. Copyright Cengage Learning. All rights reserved.
 2 Polynomial and Rational Functions Copyright Cengage Learning. All rights reserved. 2.1 Quadratic Functions Copyright Cengage Learning. All rights reserved. What You Should Learn Analyze graphs of quadratic
Properties of Quadratic functions
 Name Today s Learning Goals: #1 How do we determine the axis of symmetry and vertex of a quadratic function? Properties of Quadratic functions Date 5-1 Properties of a Quadratic Function A quadratic equation
transformation: alters the equation and any combination of the location, shape, and orientation of the graph
 Chapter 1: Function Transformations Section 1.1: Horizontal and Vertical Translations transformation: alters the equation and any combination of the location, shape, and orientation of the graph mapping:
Summer Review for Students Entering Pre-Calculus with Trigonometry. TI-84 Plus Graphing Calculator is required for this course.
 1. Using Function Notation and Identifying Domain and Range 2. Multiplying Polynomials and Solving Quadratics 3. Solving with Trig Ratios and Pythagorean Theorem 4. Multiplying and Dividing Rational Expressions
2. The diagram shows part of the graph of y = a (x h) 2 + k. The graph has its vertex at P, and passes through the point A with coordinates (1, 0).
 2 + k. The graph has its vertex at P, and passes through the point A with coordinates (1, 0).") Quadratics Vertex Form 1. Part of the graph of the function y = d (x m) + p is given in the diagram below. The x-intercepts are (1, 0) and (5, 0). The vertex is V(m, ). (a) Write down the value of (i)
Quadratics Vertex Form 1. Part of the graph of the function y = d (x m) + p is given in the diagram below. The x-intercepts are (1, 0) and (5, 0). The vertex is V(m, ). (a) Write down the value of (i)
Final Exam Review Algebra Semester 1
 Final Exam Review Algebra 015-016 Semester 1 Name: Module 1 Find the inverse of each function. 1. f x 10 4x. g x 15x 10 Use compositions to check if the two functions are inverses. 3. s x 7 x and t(x)
1.2 Reflections and Stretches
 Chapter Part : Reflections.2 Reflections and Stretches Pages 6 3 Investigating a reflection in the x axis:. a) Complete the following table for and sketch on the axis provided. x 2 0 2 y b) Now sketch
Unit 12 Special Functions
 Algebra Notes Special Functions Unit 1 Unit 1 Special Functions PREREQUISITE SKILLS: students should be able to describe a relation and a function students should be able to identify the domain and range
This is called the vertex form of the quadratic equation. To graph the equation
 Name Period Date: Topic: 7-5 Graphing ( ) Essential Question: What is the vertex of a parabola, and what is its axis of symmetry? Standard: F-IF.7a Objective: Graph linear and quadratic functions and show
Algebra 2 Honors Lesson 10 Translating Functions
 Algebra 2 Honors Lesson 10 Translating Functions Objectives: The students will be able to translate a base function horizontally and vertically. Students will be able to describe the translation of f(x)
Exploring Quadratic Graphs
 Exploring Quadratic Graphs The general quadratic function is y=ax 2 +bx+c It has one of two basic graphs shapes, as shown below: It is a symmetrical "U"-shape or "hump"-shape, depending on the sign of
Summer Review for Students Entering Pre-Calculus with Trigonometry. TI-84 Plus Graphing Calculator is required for this course.
 Summer Review for Students Entering Pre-Calculus with Trigonometry 1. Using Function Notation and Identifying Domain and Range 2. Multiplying Polynomials and Solving Quadratics 3. Solving with Trig Ratios
Section a) f(x-3)+4 = (x 3) the (-3) in the parenthesis moves right 3, the +4 moves up 4
 f(x-3)+4 = (x 3) the (-3) in the parenthesis moves right 3, the +4 moves up 4") Section 4.3 1a) f(x-3)+4 = (x 3) 2 + 4 the (-3) in the parenthesis moves right 3, the +4 moves up 4 Answer 1a: f(x-3)+4 = (x 3) 2 + 4 The graph has the same shape as f(x) = x 2, except it is shifted right
Section 4.3 1a) f(x-3)+4 = (x 3) 2 + 4 the (-3) in the parenthesis moves right 3, the +4 moves up 4 Answer 1a: f(x-3)+4 = (x 3) 2 + 4 The graph has the same shape as f(x) = x 2, except it is shifted right
Section 4.4: Parabolas
 Objective: Graph parabolas using the vertex, x-intercepts, and y-intercept. Just as the graph of a linear equation y mx b can be drawn, the graph of a quadratic equation y ax bx c can be drawn. The graph
But a vertex has two coordinates, an x and a y coordinate. So how would you find the corresponding y-value?
 We will work with the vertex, orientation, and x- and y-intercepts of these functions. Intermediate algebra Class notes More Graphs of Quadratic Functions (section 11.6) In the previous section, we investigated
Algebra II Quadratic Functions
 1 Algebra II Quadratic Functions 2014-10-14 www.njctl.org 2 Ta b le o f C o n te n t Key Terms click on the topic to go to that section Explain Characteristics of Quadratic Functions Combining Transformations
Algebra II: Strand 3. Quadratic Functions; Topic 2. Digging Deeper; Task 3.2.1
 1 TASK 3..1: PUTTING IT TOGETHER Solutions 1. Each of the following quadratic functions is given in standard form ( y = ax + bx + c ). For each function: Transform the function to the form y = a(x h) +
9.1 Linear Inequalities in Two Variables Date: 2. Decide whether to use a solid line or dotted line:
 9.1 Linear Inequalities in Two Variables Date: Key Ideas: Example Solve the inequality by graphing 3y 2x 6. steps 1. Rearrange the inequality so it s in mx ± b form. Don t forget to flip the inequality
Algebra I. Slide 1 / 137. Slide 2 / 137. Slide 3 / 137. Quadratic & Non-Linear Functions. Table of Contents
 Slide 1 / 137 Slide 2 / 137 Algebra I Quadratic & Non-Linear Functions 2015-11-04 www.njctl.org Table of Contents Slide 3 / 137 Click on the topic to go to that section Key Terms Explain Characteristics
Quadratic Equations. Learning Objectives. Quadratic Function 2. where a, b, and c are real numbers and a 0
 Quadratic Equations Learning Objectives 1. Graph a quadratic function using transformations. Identify the vertex and axis of symmetry of a quadratic function 3. Graph a quadratic function using its vertex,
Graphing Absolute Value Functions
 Graphing Absolute Value Functions To graph an absolute value equation, make an x/y table and plot the points. Graph y = x (Parent graph) x y -2 2-1 1 0 0 1 1 2 2 Do we see a pattern? Desmos activity: 1.
Quadratic Functions (Section 2-1)
") Quadratic Functions (Section 2-1) Section 2.1, Definition of Polynomial Function f(x) = a is the constant function f(x) = mx + b where m 0 is a linear function f(x) = ax 2 + bx + c with a 0 is a quadratic
Quadratic Functions (Section 2-1) Section 2.1, Definition of Polynomial Function f(x) = a is the constant function f(x) = mx + b where m 0 is a linear function f(x) = ax 2 + bx + c with a 0 is a quadratic
The x-intercept can be found by setting y = 0 and solving for x: 16 3, 0
 y=-3/4x+4 and y=2 x I need to graph the functions so I can clearly describe the graphs Specifically mention any key points on the graphs, including intercepts, vertex, or start/end points. What is the
Important!!! First homework is due on Monday, September 26 at 8:00 am.
 Important!!! First homework is due on Monday, September 26 at 8:00 am. You can solve and submit the homework on line using webwork: http://webwork.dartmouth.edu/webwork2/m3cod/. If you do not have a user
Name: Chapter 7 Review: Graphing Quadratic Functions
 Name: Chapter Review: Graphing Quadratic Functions A. Intro to Graphs of Quadratic Equations: = ax + bx+ c A is a function that can be written in the form = ax + bx+ c where a, b, and c are real numbers
MAC Rev.S Learning Objectives. Learning Objectives (Cont.) Module 4 Quadratic Functions and Equations
 Module 4 Quadratic Functions and Equations") MAC 1140 Module 4 Quadratic Functions and Equations Learning Objectives Upon completing this module, you should be able to 1. understand basic concepts about quadratic functions and their graphs.. complete
MAC 1140 Module 4 Quadratic Functions and Equations Learning Objectives Upon completing this module, you should be able to 1. understand basic concepts about quadratic functions and their graphs.. complete
Replacing f(x) with k f(x) and. Adapted from Walch Education
 with k f(x) and. Adapted from Walch Education") Replacing f(x) with k f(x) and f(k x) Adapted from Walch Education Graphing and Points of Interest In the graph of a function, there are key points of interest that define the graph and represent the characteristics
Replacing f(x) with k f(x) and f(k x) Adapted from Walch Education Graphing and Points of Interest In the graph of a function, there are key points of interest that define the graph and represent the characteristics
1 Vertical and Horizontal
 www.ck12.org Chapter 1. Vertical and Horizontal Transformations CHAPTER 1 Vertical and Horizontal Transformations Here you will learn about graphing more complex types of functions easily by applying horizontal
Section 18-1: Graphical Representation of Linear Equations and Functions
 Section 18-1: Graphical Representation of Linear Equations and Functions Prepare a table of solutions and locate the solutions on a coordinate system: f(x) = 2x 5 Learning Outcome 2 Write x + 3 = 5 as
2.2 Transformers: More Than Meets the y s
 10 SECONDARY MATH II // MODULE 2 STRUCTURES OF EXPRESSIONS 2.2 Transformers: More Than Meets the y s A Solidify Understanding Task Writetheequationforeachproblembelow.Useasecond representationtocheckyourequation.
8-4 Transforming Quadratic Functions
 8-4 Transforming Quadratic Functions Warm Up Lesson Presentation Lesson Quiz Algebra 1 Warm Up For each quadratic function, find the axis of symmetry and vertex, and state whether the function opens upward
GSE Algebra 1 Name Date Block. Unit 3b Remediation Ticket
 Unit 3b Remediation Ticket Question: Which function increases faster, f(x) or g(x)? f(x) = 5x + 8; two points from g(x): (-2, 4) and (3, 10) Answer: In order to compare the rate of change (roc), you must
POLYNOMIALS Graphing Polynomial Functions Common Core Standard
 K Polynomials, Lesson 6, Graphing Polynomial Functions (r. 2018) POLYNOMIALS Graphing Polynomial Functions Common Core Standard Next Generation Standard F-BF.3 Identify the effect on the graph of replacing
Unit 3 Higher topic list
 This is a comprehensive list of the topics to be studied for the Edexcel unit 3 modular exam. Beside the topics listed are the relevant tasks on www.mymaths.co.uk that students can use to practice. Logon
Unit 2: Functions and Graphs
 AMHS Precalculus - Unit 16 Unit : Functions and Graphs Functions A function is a rule that assigns each element in the domain to exactly one element in the range. The domain is the set of all possible
Math Analysis Chapter 1 Notes: Functions and Graphs
 Math Analysis Chapter 1 Notes: Functions and Graphs Day 6: Section 1-1 Graphs Points and Ordered Pairs The Rectangular Coordinate System (aka: The Cartesian coordinate system) Practice: Label each on the
Chapter P: Preparation for Calculus
 1. Which of the following is the correct graph of y = x x 3? E) Copyright Houghton Mifflin Company. All rights reserved. 1 . Which of the following is the correct graph of y = 3x x? E) Copyright Houghton
Sketching graphs of polynomials
 Sketching graphs of polynomials We want to draw the graphs of polynomial functions y = f(x). The degree of a polynomial in one variable x is the highest power of x that remains after terms have been collected.
Graphing Techniques and Transformations. Learning Objectives. Remarks
 Graphing Techniques and Transformations Learning Objectives 1. Graph functions using vertical and horizontal shifts 2. Graph functions using compressions and stretches. Graph functions using reflections
Math Analysis Chapter 1 Notes: Functions and Graphs
 Math Analysis Chapter 1 Notes: Functions and Graphs Day 6: Section 1-1 Graphs; Section 1- Basics of Functions and Their Graphs Points and Ordered Pairs The Rectangular Coordinate System (aka: The Cartesian
a translation by c units a translation by c units
 1.6 Graphical Transformations Introducing... Translations 1.) Set your viewing window to [-5,5] by [-5,15]. 2.) Graph the following functions: y 1 = x 2 y 2 = x 2 + 3 y 3 = x 2 + 1 y 4 = x 2-2 y 5 = x
Pure Math 30: Explained!
 www.puremath30.com 30 part i: stretches about other lines Stretches about other lines: Stretches about lines other than the x & y axis are frequently required. Example 1: Stretch the graph horizontally
Foundations of Math II
 Foundations of Math II Unit 6b: Toolkit Functions Academics High School Mathematics 6.6 Warm Up: Review Graphing Linear, Exponential, and Quadratic Functions 2 6.6 Lesson Handout: Linear, Exponential,
Warm - Up. Sunday, February 1, HINT: plot points first then connect the dots. Draw a graph with the following characteristics:
 Warm - Up Sunday, February 1, 2015 Draw a graph with the following characteristics: Maximums at (-3,4) and (2,2) Minimum at (-1,-3) X intercepts at (-4,0), (-2,0), (1,0), and (3,0) Y intercept at (0,-2)
Vertical Line Test a relationship is a function, if NO vertical line intersects the graph more than once
 Algebra 2 Chapter 2 Domain input values, X (x, y) Range output values, Y (x, y) Function For each input, there is exactly one output Example: Vertical Line Test a relationship is a function, if NO vertical
MAT 106: Trigonometry Brief Summary of Function Transformations
 MAT 106: Trigonometry Brief Summary of Function Transformations The sections below are intended to provide a brief overview and summary of the various types of basic function transformations covered in
Second Edition. Concept Builders. Jana Kohout
 Second Edition Concept Builders Jana Kohout First published in Australia as an online resource in 016. Edited and printed in 017. Jana Kohout 017 Reproduction and Communication for educational purposes
1.5 Part - 2 Inverse Relations and Inverse Functions
 1.5 Part - 2 Inverse Relations and Inverse Functions What happens when we reverse the coordinates of all the ordered pairs in a relation? We obviously get another relation, but does it have any similarities
Birkdale High School - Higher Scheme of Work
 Birkdale High School - Higher Scheme of Work Module 1 - Integers and Decimals Understand and order integers (assumed) Use brackets and hierarchy of operations (BODMAS) Add, subtract, multiply and divide
Function Transformations and Symmetry
 CHAPTER Function Transformations and Symmetry The first well-documented postal system was in ancient Rome, where mail was carried by horsedrawn carriages and ox-drawn wagons. The US Postal Service delivers
Quadratics and their Properties
 Algebra 2 Quadratics and their Properties Name: Ms. Williams/Algebra 2 Pd: 1 Table of Contents Day 1: COMPLETING THE SQUARE AND SHIFTING PARABOLAS SWBAT: Write a quadratic from standard form to vertex
Honors Algebra 2 Function Transformations Discovery
 Honors Algebra Function Transformations Discovery Name: Date: Parent Polynomial Graphs Using an input-output table, make a rough sketch and compare the graphs of the following functions. f x x. f x x.
Sections Transformations
 MCR3U Sections 1.6 1.8 Transformations Transformations: A change made to a figure or a relation such that it is shifted or changed in shape. Translations, reflections and stretches/compressions are types
Investigating Transformations With DESMOS
 MPM D0 Date: Investigating Transformations With DESMOS INVESTIGATION Part A: What if we add a constant to the x in y = x? 1. Use DESMOS to graph the following quadratic functions on the same grid. Graph
Quadratic Functions CHAPTER. 1.1 Lots and Projectiles Introduction to Quadratic Functions p. 31
 CHAPTER Quadratic Functions Arches are used to support the weight of walls and ceilings in buildings. Arches were first used in architecture by the Mesopotamians over 4000 years ago. Later, the Romans
3. parallel: (b) and (c); perpendicular (a) and (b), (a) and (c)
 and (c); perpendicular (a) and (b), (a) and (c)") SECTION 1.1 1. Plot the points (0, 4), ( 2, 3), (1.5, 1), and ( 3, 0.5) in the Cartesian plane. 2. Simplify the expression 13 7 2. 3. Use the 3 lines whose equations are given. Which are parallel? Which
SECTION 1.1 1. Plot the points (0, 4), ( 2, 3), (1.5, 1), and ( 3, 0.5) in the Cartesian plane. 2. Simplify the expression 13 7 2. 3. Use the 3 lines whose equations are given. Which are parallel? Which
Objective. 9-4 Transforming Quadratic Functions. Graph and transform quadratic functions.
 Warm Up Lesson Presentation Lesson Quiz Warm Up For each quadratic function, find the axis of symmetry and vertex, and state whether the function opens upward or downward. 1. y = x 2 + 3 2. y = 2x 2 x
5.3 Vertex Form of Quadratics 2017.notebook. October 20, Homework Answers:
 Homework Answers: 21. 23. 25. 27. 52. 69. 70. 71. 50. a. Vertex (315, 630) b. Domain: (0, 630) Range: (0, 630) c. 360 ft d. 630ft 1 Graph WARM UP 1) Find the vertex of the quadratic function: 2) Complete
Quadratic Functions. Full Set of Notes. No Solutions
 Quadratic Functions Full Set of Notes No Solutions Graphing Quadratic Functions The graph of a quadratic function is called a parabola. Applications of Parabolas: http://www.doe.virginia.gov/div/winchester/jhhs/math/lessons/calc2004/appparab.html
1.1 Horizontal & Vertical Translations
 Unit II Transformations of Functions. Horizontal & Vertical Translations Goal: Demonstrate an understanding of the effects of horizontal and vertical translations on the graphs of functions and their related
2.1 Quadraticsnts.notebook. September 10, 2018
 1 A quadratic function is a polynomial function of second degree. The graph of a quadratic function is called a parabola. 2 Standard Form: Intercept Form: Vertex Form: f(x) = a(x h) 2 + k vertex: (h, k)
Algebra II Notes Transformations Unit 1.1. Math Background
 Lesson. - Parent Functions and Transformations Math Background Previously, you Studied linear, absolute value, exponential and quadratic equations Graphed linear, absolute value, exponential and quadratic
Notes Rules for Transformations of Functions If f x is the original functions, a > 0 and c > 0.
 9.1.2 Parabola Investigation Do Now 1. Vertical means and horizontal is. 2. Another word for compress is. 3. Given the statement 0 < a < 1, a represents numbers like 4. Given the statement a > 1, a represents
Standard Form v. Vertex Form
 Standard Form v. Vertex Form The Standard Form of a quadratic equation is:. The Vertex Form of a quadratic equation is where represents the vertex of an equation and is the same a value used in the Standard
MATHS METHODS QUADRATICS REVIEW. A reminder of some of the laws of expansion, which in reverse are a quick reference for rules of factorisation
 MATHS METHODS QUADRATICS REVIEW LAWS OF EXPANSION A reminder of some of the laws of expansion, which in reverse are a quick reference for rules of factorisation a) b) c) d) e) FACTORISING Exercise 4A Q6ace,7acegi
Warm Up. Factor the following numbers and expressions. Multiply the following factors using either FOIL or Box Method
 Warm Up Factor the following numbers and expressions 1. 36 2. 36x 3 + 48x 2 + 24x Multiply the following factors using either FOIL or Box Method 3. (3x 2)(x 1) 4. (x 2)(x + 3) Objectives Recognize standard
QUADRATIC FUNCTIONS. PROTOTYPE: f(x) = ax 2 + bx + c. (1) The leading coefficient a 0 is called the shape parameter.
 = ax 2 + bx + c. (1) The leading coefficient a 0 is called the shape parameter.") QUADRATIC FUNCTIONS PROTOTYPE: f(x) = ax 2 + bx + c. (1) The leading coefficient a 0 is called the shape parameter. SHAPE-VERTEX FORMULA One can write any quadratic function (1) as f(x) = a(x h) 2 + k,
QUADRATIC FUNCTIONS PROTOTYPE: f(x) = ax 2 + bx + c. (1) The leading coefficient a 0 is called the shape parameter. SHAPE-VERTEX FORMULA One can write any quadratic function (1) as f(x) = a(x h) 2 + k,
Quadratic Functions In Standard Form In Factored Form In Vertex Form Transforming Graphs. Math Background
 Graphing In Standard Form In Factored Form In Vertex Form Transforming Graphs Math Background Previousl, ou Identified and graphed linear functions Applied transformations to parent functions Graphed quadratic
1.1 Functions. Cartesian Coordinate System
 1.1 Functions This section deals with the topic of functions, one of the most important topics in all of mathematics. Let s discuss the idea of the Cartesian coordinate system first. Cartesian Coordinate
MEI Desmos Tasks for AS Pure
 Task 1: Coordinate Geometry Intersection of a line and a curve 1. Add a quadratic curve, e.g. y = x² 4x + 1 2. Add a line, e.g. y = x 3 3. Select the points of intersection of the line and the curve. What
Math 3 Coordinate Geometry Part 2 Graphing Solutions
 Math 3 Coordinate Geometry Part 2 Graphing Solutions 1 SOLVING SYSTEMS OF EQUATIONS GRAPHICALLY The solution of two linear equations is the point where the two lines intersect. For example, in the graph
Worksheet: Transformations of Quadratic Functions
 Worksheet: Transformations of Quadratic Functions Multiple Choice Identif the choice that best completes the statement or answers the question.. Which correctl identifies the values of the parameters a,
Warm Up Grab your calculator Find the vertex: y = 2x x + 53 (-5, 3)
") Warm Up Grab your calculator Find the vertex: y = 2x 2 + 20x + 53 (-5, 3) Quiz will be next Tuesday, folks. Check HW/ New Section Another useful form of writing quadratic functions is the standard form.
Warm Up Grab your calculator Find the vertex: y = 2x 2 + 20x + 53 (-5, 3) Quiz will be next Tuesday, folks. Check HW/ New Section Another useful form of writing quadratic functions is the standard form.
Sec 4.1 Coordinates and Scatter Plots. Coordinate Plane: Formed by two real number lines that intersect at a right angle.
 Algebra I Chapter 4 Notes Name Sec 4.1 Coordinates and Scatter Plots Coordinate Plane: Formed by two real number lines that intersect at a right angle. X-axis: The horizontal axis Y-axis: The vertical
II. Functions. 61. Find a way to graph the line from the problem 59 on your calculator. Sketch the calculator graph here, including the window values:
 II Functions Week 4 Functions: graphs, tables and formulas Problem of the Week: The Farmer s Fence A field bounded on one side by a river is to be fenced on three sides so as to form a rectangular enclosure
Graphical Methods Booklet
 Graphical Methods Booklet This document outlines the topic of work and the requirements of students working at New Zealand Curriculum level 7. Parabola, vertex form y = x 2 Vertex (0,0) Axis of symmetry
In this section we continue our study of functions. We have already been introduced to
 DETAILED SOLUTIONS AND CONCEPTS - GRAPHS OF COMMON FUNCTIONS Prepared by Ingrid Stewart, Ph.D., College of Southern Nevada Please Send Questions and Comments to ingrid.stewart@csn.edu. Thank you! PLEASE
Section 2.1 Graphs. The Coordinate Plane
 Section 2.1 Graphs The Coordinate Plane Just as points on a line can be identified with real numbers to form the coordinate line, points in a plane can be identified with ordered pairs of numbers to form
Unit: Quadratic Functions
 Unit: Quadratic Functions Learning increases when you have a goal to work towards. Use this checklist as guide to track how well you are grasping the material. In the center column, rate your understand
3.1 Investigating Quadratic Functions in Vertex Form
 Math 2200 Date: 3.1 Investigating Quadratic Functions in Vertex Form Degree of a Function - refers to the highest exponent on the variable in an expression or equation. In Math 1201, you learned about
Y. Butterworth Lehmann & 9.2 Page 1 of 11
 Pre Chapter 9 Coverage Quadratic (2 nd Degree) Form a type of graph called a parabola Form of equation we'll be dealing with in this chapter: y = ax 2 + c Sign of a determines opens up or down "+" opens
Math 125 Little Book Homework Chapters 7, 10, 11, and 12
 Math 125 Little Book Homework Chapters 7, 10, 11, and 12 Do NOT copy the book follow the guidelines given for each section. NO CREDIT will be given if you copy the book! You earn 2 points if you turn in