Scalar Field Visualization I
|
|
|
- Helen Berry
- 6 years ago
- Views:
Transcription
1 Scalar Field Visualization I

.")
2 What is a Scalar Field? The approximation of certain scalar function in space f(x,y,z). Image source: blimpyb.com f

3 What is a Scalar Field? The approximation of certain scalar function in space f(x,y,z). Most of time, they come in as some scalar values defined on some sample points. Image source: blimpyb.com Image source: code google.com
4 What is a Scalar Field? The approximation of certain scalar function in space f(x,y,z). Most of time, they come in as some scalar values defined on some sample points. Image source: blimpyb.com Visualization primitives: Geometry: iso contours (2D), iso surfaces (3D), Attributes: colors, transparency, 3D textures.
5 Generate 2D color plots
6 Generate 2D color plots 1. Color transfer function 2. Color interpolation
7 To create a color plot, we need to define a proper Transfer Function to set Color as a function of Scalar Value. The following shows a simple transfer function. Scalar values >[0,1] > Colors In OpenGL, the mapping of 1D texture
8 To create a color plot, we need to define a proper Transfer Function to set Color as a function of Scalar Value. The following shows a simple transfer function. Scalar values >[0,1]
9 To create a color plot, we need to define a proper Transfer Function to set Color as a function of Scalar Value. The following shows a simple transfer function. [0,1] > Colors 0 > blue (hue=240) t > > red (hue=0)

10 To create a color plot, we need to define a proper Transfer Function to set Color as a function of Scalar Value. The following shows a simple transfer function. Scalar values >[0,1] > Colors In OpenGL, the mapping of 1D texture
11 Use the Right Transfer Function Color Scale to Represent a Range of Scalar Values

12 Rainbow Scale

13 Gray Scale

14 Intensity and Saturation Color Scales

15 Two Color Interpolation
16 Heated Object Color Scale

17 Add One Component at a time an extension from the heated object color scale

18 Blue White Red Color Scale

19 (Discrete) Color Scale Contour Source:
20 Generate 2D color plots 1. Color transfer function 2. Color interpolation


21 2D Interpolated Color Plots How can we turn the discrete samples into a continuous color plot? Here s the input: we have a 2D grid of data points. At each node, we have an X, Y, Z, and a scalar value S. We know Smin, Smax, and a Transfer Function. 2D parameterization of the original domain Even though this is a 2D technique, we keep around the X, Y, and Z coordinates so that the grid doesn t have to lie in any particular plane.
22 2D Interpolated Color Plots Let us look at one square (or quad) of the mesh at a time For each scalar value at a vertex float hsv[3], rgb[3]; hsv HsvRgb (hsv, rgb); ; Convert hsv color to rgb color
23 2D Interpolated Color Plots We let OpenGL deal with the color interpolation // compute color at V0 glcolor3fv (rgb0); glvertex3f (x0, y0, z0); // compute color at V1 glcolor3fv (rgb1); glvertex3f (x1, y1, z1); // compute color at V3 glcolor3fv (rgb3); glvertex3f (x3, y3, z3); // compute color at V2 glcolor3fv (rgb2); glvertex3f (x2, y2, z2);
24 What if the data is defined on a triangle mesh?
25 // compute color at V0 glcolor3fv (rgb0); glvertex3f (x0, y0, z0); V2 // compute color at V1 glcolor3fv (rgb1); glvertex3f (x1, y1, z1); // compute color at V3 glcolor3fv (rgb3); glvertex3f (x3, y3, z3); V0 V1

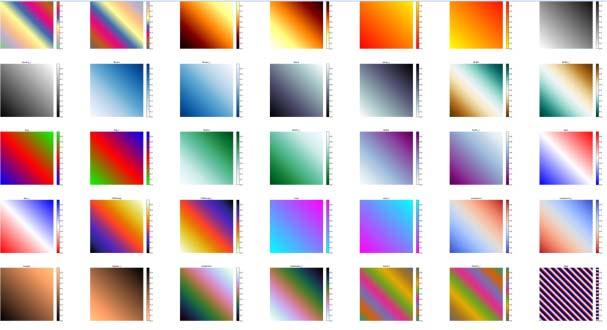
26 Recall: A Gallery of Color Scales Many more can be found at
27 Geometric Based Scalar Field Visualization Iso Contouring and Iso Surfacing


28 Contour (iso value) line(s) 2D Contour Lines Sub sets of the original data that correlate all the points with the same scalar values. If the 2D scalar field is considered as a height field (2D surface), the contours are the intersections of a moving horizontal plane with this height field. Image source: Image source:

29 2D Contour Lines Here s the situation: we have a 2D grid of data points. At each node, we have an X, Y, Z, and a scalar value S. We know the Transfer Function. We also have a particular scalar value, S*, at which we want to draw the contour (iso value) line(s).

30 2D Contour Lines: Marching Squares Instead of dealing with the entire grid, we once again look at one square at a time, then march through them all in order. For this reason, this method is called the Marching Squares.
31 Marching Squares What s really going to happen is that we are not creating contours by connecting points into a complete curve. We are creating contours by drawing a collection of 2 point line segments, safe in the knowledge that those line segments will align across square boundaries.
32 Marching Squares Does S* cross any edges of this square? We have a particular scalar value, S*, at which we want to draw the contour (iso value) line(s). Linearly interpolating any scalar value from node0 to node1 gives: 1 where Setting this interpolated S equal to S* and solving for t gives:
33 Marching Squares (x*, y*) If 0. t* 1., then S* crosses this edge. You can compute where S* crosses the edge by using the same linear interpolation equation you used to compute S*. You will need that for later visualization. 1 1
34 Marching Squares Do this for all 4 edges when you are done, there are 5 possible ways this could have turned out # of intersections = 0 # of intersections = 2 # of intersections = 1 # of intersections = 3
35 Marching Squares Do this for all 4 edges when you are done, there are 5 possible ways this could have turned out # of intersections = 0 Do nothing # of intersections = 2 Draw a line connecting them # of intersections = 1 # of intersections = 3 Error: this means that the contour got into the square and never got out If one intersection is not on a vertex >Error: this means that the contour got into the square and never got out
36 Marching Squares Special cases What if S1 == S0 (i.e. t*= ) because There are two possibilities.
Scalar Field Visualization I
 Scalar Field Visualization I What is a Scalar Field? The approximation of certain scalar function in space f(x,y,z). Image source: blimpyb.com f What is a Scalar Field? The approximation of certain scalar
Scalar Field Visualization. Some slices used by Prof. Mike Bailey
 Scalar Field Visualization Some slices used by Prof. Mike Bailey Scalar Fields The approximation of certain scalar function in space f(x,y,z). Most of time, they come in as some scalar values defined on
CIS 4930/ SCIENTIFICVISUALIZATION
 CIS 4930/6930-902 SCIENTIFICVISUALIZATION ISOSURFACING Paul Rosen Assistant Professor University of South Florida slides credits Tricoche and Meyer ADMINISTRATIVE Read (or watch video): Kieffer et al,
11/1/13. Visualization. Scientific Visualization. Types of Data. Height Field. Contour Curves. Meshes
 CSCI 420 Computer Graphics Lecture 26 Visualization Height Fields and Contours Scalar Fields Volume Rendering Vector Fields [Angel Ch. 2.11] Jernej Barbic University of Southern California Scientific Visualization
Visualization. CSCI 420 Computer Graphics Lecture 26
 CSCI 420 Computer Graphics Lecture 26 Visualization Height Fields and Contours Scalar Fields Volume Rendering Vector Fields [Angel Ch. 11] Jernej Barbic University of Southern California 1 Scientific Visualization
Scientific Visualization Example exam questions with commented answers
 Scientific Visualization Example exam questions with commented answers The theoretical part of this course is evaluated by means of a multiple- choice exam. The questions cover the material mentioned during
Lecture overview. Visualisatie BMT. Fundamental algorithms. Visualization pipeline. Structural classification - 1. Structural classification - 2
 Visualisatie BMT Fundamental algorithms Arjan Kok a.j.f.kok@tue.nl Lecture overview Classification of algorithms Scalar algorithms Vector algorithms Tensor algorithms Modeling algorithms 1 2 Visualization
Scalar Visualization
 Scalar Visualization Visualizing scalar data Popular scalar visualization techniques Color mapping Contouring Height plots outline Recap of Chap 4: Visualization Pipeline 1. Data Importing 2. Data Filtering
Scalar Algorithms: Contouring
 Scalar Algorithms: Contouring Computer Animation and Visualisation Lecture tkomura@inf.ed.ac.uk Institute for Perception, Action & Behaviour School of Informatics Contouring Scaler Data Last Lecture...
4. Basic Mapping Techniques
 4. Basic Mapping Techniques Mapping from (filtered) data to renderable representation Most important part of visualization Possible visual representations: Position Size Orientation Shape Brightness Color
Scalar Visualization
 Scalar Visualization 5-1 Motivation Visualizing scalar data is frequently encountered in science, engineering, and medicine, but also in daily life. Recalling from earlier, scalar datasets, or scalar fields,
CS 4620 Midterm, March 21, 2017
 CS 460 Midterm, March 1, 017 This 90-minute exam has 4 questions worth a total of 100 points. Use the back of the pages if you need more space. Academic Integrity is expected of all students of Cornell
Visualization Computer Graphics I Lecture 20
 15-462 Computer Graphics I Lecture 20 Visualization Height Fields and Contours Scalar Fields Volume Rendering Vector Fields [Angel Ch. 12] April 15, 2003 Frank Pfenning Carnegie Mellon University http://www.cs.cmu.edu/~fp/courses/graphics/
Height Fields and Contours Scalar Fields Volume Rendering Vector Fields [Angel Ch. 12] April 23, 2002 Frank Pfenning Carnegie Mellon University
![Height Fields and Contours Scalar Fields Volume Rendering Vector Fields [Angel Ch. 12] April 23, 2002 Frank Pfenning Carnegie Mellon University](/thumbs/90/102611276.jpg "Height Fields and Contours Scalar Fields Volume Rendering Vector Fields [Angel Ch. 12] April 23, 2002 Frank Pfenning Carnegie Mellon University") 15-462 Computer Graphics I Lecture 21 Visualization Height Fields and Contours Scalar Fields Volume Rendering Vector Fields [Angel Ch. 12] April 23, 2002 Frank Pfenning Carnegie Mellon University http://www.cs.cmu.edu/~fp/courses/graphics/
15-462 Computer Graphics I Lecture 21 Visualization Height Fields and Contours Scalar Fields Volume Rendering Vector Fields [Angel Ch. 12] April 23, 2002 Frank Pfenning Carnegie Mellon University http://www.cs.cmu.edu/~fp/courses/graphics/
Assignment #3: 2D Scalar Field Visualization II: Iso-contouring
 Assignment #3: 2D Scalar Field Visualization II: Iso-contouring Goals: Due Sept. 21st, before midnight This is the continuation of the 2D scalar field visualization project. So, please continue working
Topics and things to know about them:
 Practice Final CMSC 427 Distributed Tuesday, December 11, 2007 Review Session, Monday, December 17, 5:00pm, 4424 AV Williams Final: 10:30 AM Wednesday, December 19, 2007 General Guidelines: The final will
Visualization. Images are used to aid in understanding of data. Height Fields and Contours Scalar Fields Volume Rendering Vector Fields [chapter 26]
![Visualization. Images are used to aid in understanding of data. Height Fields and Contours Scalar Fields Volume Rendering Vector Fields [chapter 26]](/thumbs/74/70771954.jpg "Visualization. Images are used to aid in understanding of data. Height Fields and Contours Scalar Fields Volume Rendering Vector Fields [chapter 26]") Visualization Images are used to aid in understanding of data Height Fields and Contours Scalar Fields Volume Rendering Vector Fields [chapter 26] Tumor SCI, Utah Scientific Visualization Visualize large
Visualization Images are used to aid in understanding of data Height Fields and Contours Scalar Fields Volume Rendering Vector Fields [chapter 26] Tumor SCI, Utah Scientific Visualization Visualize large
2D rendering takes a photo of the 2D scene with a virtual camera that selects an axis aligned rectangle from the scene. The photograph is placed into
 2D rendering takes a photo of the 2D scene with a virtual camera that selects an axis aligned rectangle from the scene. The photograph is placed into the viewport of the current application window. A pixel
Visualization Computer Graphics I Lecture 20
 15-462 Computer Graphics I Lecture 20 Visualization Height Fields and Contours Scalar Fields Volume Rendering Vector Fields [Angel Ch. 12] November 20, 2003 Doug James Carnegie Mellon University http://www.cs.cmu.edu/~djames/15-462/fall03
CSC Computer Graphics
 // CSC. Computer Graphics Lecture Kasun@dscs.sjp.ac.lk Department of Computer Science University of Sri Jayewardanepura Polygon Filling Scan-Line Polygon Fill Algorithm Span Flood-Fill Algorithm Inside-outside
Review for Mastery Using Graphs and Tables to Solve Linear Systems
 3-1 Using Graphs and Tables to Solve Linear Systems A linear system of equations is a set of two or more linear equations. To solve a linear system, find all the ordered pairs (x, y) that make both equations
Scalar Visualization
 Scalar Visualization Mike Bailey mjb@cs.oregonstate.edu scalar.pptx In Visualization, we Use the Concept of a Transfer Function to set Color as a Function of Scalar Value Color Scalar Value 1 A Gallery
Scientific Visualization. CSC 7443: Scientific Information Visualization
 Scientific Visualization Scientific Datasets Gaining insight into scientific data by representing the data by computer graphics Scientific data sources Computation Real material simulation/modeling (e.g.,
Graphics Hardware and Display Devices
 Graphics Hardware and Display Devices CSE328 Lectures Graphics/Visualization Hardware Many graphics/visualization algorithms can be implemented efficiently and inexpensively in hardware Facilitates interactive
Scalar Visualization. In Visualization, we Use the Concept of a Transfer Function to set Color as a Function of Scalar Value.
 Scalar Visualization In Visualization, we Use the Concept of a ransfer Function to set Color as a Function of Scalar Value Mike Bailey mjb@cs.oregonstate.edu Color Scalar Value scalar.pptx A Gallery of
Last class. A vertex (w x, w y, w z, w) - clipping is in the - windowing and viewport normalized view volume if: - scan conversion/ rasterization
 - clipping is in the - windowing and viewport normalized view volume if: - scan conversion/ rasterization") Lecture 6 Last class Last lecture (clip coordinates): A vertex (w x, w y, w z, w) - clipping is in the - windowing and viewport normalized view volume if: - scan conversion/ rasterization normalized view
Lecture 6 Last class Last lecture (clip coordinates): A vertex (w x, w y, w z, w) - clipping is in the - windowing and viewport normalized view volume if: - scan conversion/ rasterization normalized view
CSE152a Computer Vision Assignment 1 WI14 Instructor: Prof. David Kriegman. Revision 0
 CSE152a Computer Vision Assignment 1 WI14 Instructor: Prof. David Kriegman. Revision Instructions: This assignment should be solved, and written up in groups of 2. Work alone only if you can not find a
How shapes are represented in 3D Graphics. Aims and objectives By the end of the lecture you will be able to describe
 Today s lecture Today we will learn about The mathematics of 3D space vectors How shapes are represented in 3D Graphics Modelling shapes as polygons Aims and objectives By the end of the lecture you will
Contours & Implicit Modelling 4
 Brief Recap Contouring & Implicit Modelling Contouring Implicit Functions Visualisation Lecture 8 lecture 6 Marching Cubes lecture 3 visualisation of a Quadric toby.breckon@ed.ac.uk Computer Vision Lab.
CIS 467/602-01: Data Visualization
 CIS 467/60-01: Data Visualization Isosurfacing and Volume Rendering Dr. David Koop Fields and Grids Fields: values come from a continuous domain, infinitely many values - Sampled at certain positions to
Terrain rendering (part 1) Due: Monday, March 10, 10pm
 Due: Monday, March 10, 10pm") CMSC 3700 Winter 014 Introduction to Computer Graphics Project 4 February 5 Terrain rendering (part 1) Due: Monday, March 10, 10pm 1 Summary The final two projects involves rendering large-scale outdoor
CMSC 3700 Winter 014 Introduction to Computer Graphics Project 4 February 5 Terrain rendering (part 1) Due: Monday, March 10, 10pm 1 Summary The final two projects involves rendering large-scale outdoor
Marching Squares Algorithm. Can you summarize the marching squares algorithm based on what we just discussed?
 Marching Squares Algorithm Can you summarize the marching squares algorithm based on what we just discussed? Marching Squares Algorithm Can you summarize the marching squares algorithm based on what we
1 Introduction to Graphics
 1 1.1 Raster Displays The screen is represented by a 2D array of locations called pixels. Zooming in on an image made up of pixels The convention in these notes will follow that of OpenGL, placing the
Lecture notes: Object modeling
 Lecture notes: Object modeling One of the classic problems in computer vision is to construct a model of an object from an image of the object. An object model has the following general principles: Compact
Previously... contour or image rendering in 2D
 Volume Rendering Visualisation Lecture 10 Taku Komura Institute for Perception, Action & Behaviour School of Informatics Volume Rendering 1 Previously... contour or image rendering in 2D 2D Contour line
Geometric Features for Non-photorealistiic Rendering
 CS348a: Computer Graphics Handout # 6 Geometric Modeling and Processing Stanford University Monday, 27 February 2017 Homework #4: Due Date: Mesh simplification and expressive rendering [95 points] Wednesday,
Assignment 4: Mesh Parametrization
 CSCI-GA.3033-018 - Geometric Modeling Assignment 4: Mesh Parametrization In this exercise you will Familiarize yourself with vector field design on surfaces. Create scalar fields whose gradients align
Graphics Pipeline 2D Geometric Transformations
 Graphics Pipeline 2D Geometric Transformations CS 4620 Lecture 8 1 Plane projection in drawing Albrecht Dürer 2 Plane projection in drawing source unknown 3 Rasterizing triangles Summary 1 evaluation of
Input Nodes. Surface Input. Surface Input Nodal Motion Nodal Displacement Instance Generator Light Flocking
 Input Nodes Surface Input Nodal Motion Nodal Displacement Instance Generator Light Flocking The different Input nodes, where they can be found, what their outputs are. Surface Input When editing a surface,
Computing Visibility. Backface Culling for General Visibility. One More Trick with Planes. BSP Trees Ray Casting Depth Buffering Quiz
 Computing Visibility BSP Trees Ray Casting Depth Buffering Quiz Power of Plane Equations We ve gotten a lot of mileage out of one simple equation. Basis for D outcode-clipping Basis for plane-at-a-time
Graded Assignment 2 Maple plots
 Graded Assignment 2 Maple plots The Maple part of the assignment is to plot the graphs corresponding to the following problems. I ll note some syntax here to get you started see tutorials for more. Problem
Computer Graphics Fundamentals. Jon Macey
 Computer Graphics Fundamentals Jon Macey jmacey@bournemouth.ac.uk http://nccastaff.bournemouth.ac.uk/jmacey/ 1 1 What is CG Fundamentals Looking at how Images (and Animations) are actually produced in
Terrain Rendering (Part 1) Due: Thursday November 30 at 10pm
 Due: Thursday November 30 at 10pm") CMSC 23700 Autumn 2017 Introduction to Computer Graphics Project 5 November 16, 2015 Terrain Rendering (Part 1) Due: Thursday November 30 at 10pm 1 Summary The final project involves rendering large-scale
CMSC 23700 Autumn 2017 Introduction to Computer Graphics Project 5 November 16, 2015 Terrain Rendering (Part 1) Due: Thursday November 30 at 10pm 1 Summary The final project involves rendering large-scale
CS 559 Computer Graphics Midterm Exam March 22, :30-3:45 pm
 CS 559 Computer Graphics Midterm Exam March 22, 2010 2:30-3:45 pm This exam is closed book and closed notes. Please write your name and CS login on every page! (we may unstaple the exams for grading) Please
Improving perception of intersecting 2D scalar fields. Mark Robinson Advisor: Dr. Kay Robbins
 Improving perception of intersecting 2D scalar fields Mark Robinson Advisor: Dr. Kay Robbins Outline of Presentation 1. Definition 2. 2D, 3D visualization techniques 3. Description of stratification 4.
The Traditional Graphics Pipeline
 Last Time? The Traditional Graphics Pipeline Participating Media Measuring BRDFs 3D Digitizing & Scattering BSSRDFs Monte Carlo Simulation Dipole Approximation Today Ray Casting / Tracing Advantages? Ray
Data Representation in Visualisation
 Data Representation in Visualisation Visualisation Lecture 4 Taku Komura Institute for Perception, Action & Behaviour School of Informatics Taku Komura Data Representation 1 Data Representation We have
EECE 478. Learning Objectives. Learning Objectives. Rasterization & Scenes. Rasterization. Compositing
 EECE 478 Rasterization & Scenes Rasterization Learning Objectives Be able to describe the complete graphics pipeline. Describe the process of rasterization for triangles and lines. Compositing Manipulate
CS337 INTRODUCTION TO COMPUTER GRAPHICS. Describing Shapes. Constructing Objects in Computer Graphics. Bin Sheng Representing Shape 9/20/16 1/15
 Describing Shapes Constructing Objects in Computer Graphics 1/15 2D Object Definition (1/3) Lines and polylines: Polylines: lines drawn between ordered points A closed polyline is a polygon, a simple polygon
Spring 2009 Prof. Hyesoon Kim
 Spring 2009 Prof. Hyesoon Kim Application Geometry Rasterizer CPU Each stage cane be also pipelined The slowest of the pipeline stage determines the rendering speed. Frames per second (fps) Executes on
3D Modeling: Surfaces
 CS 430/536 Computer Graphics I 3D Modeling: Surfaces Week 8, Lecture 16 David Breen, William Regli and Maxim Peysakhov Geometric and Intelligent Computing Laboratory Department of Computer Science Drexel
Graphics Programming
 Graphics Programming 3 rd Week, 2011 OpenGL API (1) API (application programming interface) Interface between an application program and a graphics system Application Program OpenGL API Graphics Library
Student Outcomes. Lesson Notes. Classwork. Opening Exercise (3 minutes)
") Student Outcomes Students solve problems related to the distance between points that lie on the same horizontal or vertical line Students use the coordinate plane to graph points, line segments and geometric
Student Outcomes Students solve problems related to the distance between points that lie on the same horizontal or vertical line Students use the coordinate plane to graph points, line segments and geometric
Outline. Visualization Discretization Sampling Quantization Representation Continuous Discrete. Noise
 Fundamentals Data Outline Visualization Discretization Sampling Quantization Representation Continuous Discrete Noise 2 Data Data : Function dependent on one or more variables. Example Audio (1D) - depends
Using ChromaDepth to obtain Inexpensive Single-image Stereovision for Scientific Visualization
 Using ChromaDepth to obtain Inexpensive Single-image Stereovision for Scientific Visualization What is ChromaDepth? ChromaDepth was invented by Richard Steenblik as a way to amplify the common chromostereoscopy
CS 464 Review. Review of Computer Graphics for Final Exam
 CS 464 Review Review of Computer Graphics for Final Exam Goal: Draw 3D Scenes on Display Device 3D Scene Abstract Model Framebuffer Matrix of Screen Pixels In Computer Graphics: If it looks right then
Scalar Data. Visualization Torsten Möller. Weiskopf/Machiraju/Möller
 Scalar Data Visualization Torsten Möller Weiskopf/Machiraju/Möller Overview Basic strategies Function plots and height fields Isolines Color coding Volume visualization (overview) Classification Segmentation
the gamedesigninitiative at cornell university Lecture 17 Color and Textures
 Lecture 7 Color and Textures Take Away For Today Image color and composition What is RGB model for images? What does alpha represent? How does alpha composition work? Graphics primitives How do primitives
The Traditional Graphics Pipeline
 Final Projects Proposals due Thursday 4/8 Proposed project summary At least 3 related papers (read & summarized) Description of series of test cases Timeline & initial task assignment The Traditional Graphics
CS123 INTRODUCTION TO COMPUTER GRAPHICS. Describing Shapes. Constructing Objects in Computer Graphics 1/15
 Describing Shapes Constructing Objects in Computer Graphics 1/15 2D Object Definition (1/3) Lines and polylines: Polylines: lines drawn between ordered points A closed polyline is a polygon, a simple polygon
Marching Cubes Robert Hunt CS 525. Introduction
 Marching Cubes Robert Hunt CS 525 Introduction The Marching Cubes algorithm is a method for visualizing a conceptual surface called an isosurface. An isosurface is formed from a set of points in 3 space
This is called the vertex form of the quadratic equation. To graph the equation
 Name Period Date: Topic: 7-5 Graphing ( ) Essential Question: What is the vertex of a parabola, and what is its axis of symmetry? Standard: F-IF.7a Objective: Graph linear and quadratic functions and show
GPU Programming EE Midterm Examination
 Name Solution GPU Programming EE 4702-1 Midterm Examination Wednesday, 18 October 2017 11:30 12:20 CDT Alias Think of something, quick! Problem 1 Problem 2 Problem 3 Problem 4 Exam Total (30 pts) (20 pts)
CS451Real-time Rendering Pipeline
 1 CS451Real-time Rendering Pipeline JYH-MING LIEN DEPARTMENT OF COMPUTER SCIENCE GEORGE MASON UNIVERSITY Based on Tomas Akenine-Möller s lecture note You say that you render a 3D 2 scene, but what does
Contouring and Isosurfaces. Ronald Peikert SciVis Contouring 2-1
 Contouring and Isosurfaces Ronald Peikert SciVis 2007 - Contouring 2-1 What are contours? Set of points where the scalar field s has a given value c: Examples in 2D: height contours on maps isobars on
Texture Mapping. Texture (images) lecture 16. Texture mapping Aliasing (and anti-aliasing) Adding texture improves realism.
 lecture 16. Texture mapping Aliasing (and anti-aliasing) Adding texture improves realism.") lecture 16 Texture mapping Aliasing (and anti-aliasing) Texture (images) Texture Mapping Q: Why do we need texture mapping? A: Because objects look fake and boring without it. Adding texture improves realism.
lecture 16 Texture mapping Aliasing (and anti-aliasing) Texture (images) Texture Mapping Q: Why do we need texture mapping? A: Because objects look fake and boring without it. Adding texture improves realism.
Face Morphing. Introduction. Related Work. Alex (Yu) Li CS284: Professor Séquin December 11, 2009
 Li CS284: Professor Séquin December 11, 2009") Alex (Yu) Li CS284: Professor Séquin December 11, 2009 Face Morphing Introduction Face morphing, a specific case of geometry morphing, is a powerful tool for animation and graphics. It consists of the
Alex (Yu) Li CS284: Professor Séquin December 11, 2009 Face Morphing Introduction Face morphing, a specific case of geometry morphing, is a powerful tool for animation and graphics. It consists of the
3D Graphics and OpenGl. First Steps
 3D Graphics and OpenGl First Steps Rendering of 3D Graphics Objects defined in (virtual/mathematical) 3D space. Rendering of 3D Graphics Objects defined in (virtual/mathematical) 3D space. We see surfaces
Data Visualization (DSC 530/CIS )
") Data Visualization (DSC 530/CIS 60-0) Isosurfaces & Volume Rendering Dr. David Koop Fields & Grids Fields: - Values come from a continuous domain, infinitely many values - Sampled at certain positions
Data Visualization (DSC 530/CIS 60-0) Isosurfaces & Volume Rendering Dr. David Koop Fields & Grids Fields: - Values come from a continuous domain, infinitely many values - Sampled at certain positions
Chapter IV Fragment Processing and Output Merging. 3D Graphics for Game Programming
 Chapter IV Fragment Processing and Output Merging Fragment Processing The per-fragment attributes may include a normal vector, a set of texture coordinates, a set of color values, a depth, etc. Using these
Scalar Algorithms -- surfaces
 Scalar Algorithms -- surfaces Color Mapping Slicing Clipping Contouring / iso-surface 1 Sources of Scalar Data Sensors CT/MRI Surface Scanners: laser/range scans Simulations CFD/FEM Mathematical Implicit
Contours & Implicit Modelling 1
 Contouring & Implicit Modelling Visualisation Lecture 8 Institute for Perception, Action & Behaviour School of Informatics Contours & Implicit Modelling 1 Brief Recap Contouring Implicit Functions lecture
Data Visualization (DSC 530/CIS )
") Data Visualization (DSC 530/CIS 60-01) Scalar Visualization Dr. David Koop Online JavaScript Resources http://learnjsdata.com/ Good coverage of data wrangling using JavaScript Fields in Visualization Scalar
Data Visualization (DSC 530/CIS 60-01) Scalar Visualization Dr. David Koop Online JavaScript Resources http://learnjsdata.com/ Good coverage of data wrangling using JavaScript Fields in Visualization Scalar
EXAMINATIONS 2016 TRIMESTER 2
 EXAMINATIONS 2016 TRIMESTER 2 CGRA 151 INTRODUCTION TO COMPUTER GRAPHICS Time Allowed: TWO HOURS CLOSED BOOK Permitted materials: Silent non-programmable calculators or silent programmable calculators
The Traditional Graphics Pipeline
 Last Time? The Traditional Graphics Pipeline Reading for Today A Practical Model for Subsurface Light Transport, Jensen, Marschner, Levoy, & Hanrahan, SIGGRAPH 2001 Participating Media Measuring BRDFs
TDA362/DIT223 Computer Graphics EXAM (Same exam for both CTH- and GU students)
") TDA362/DIT223 Computer Graphics EXAM (Same exam for both CTH- and GU students) Saturday, January 13 th, 2018, 08:30-12:30 Examiner Ulf Assarsson, tel. 031-772 1775 Permitted Technical Aids None, except
TDA362/DIT223 Computer Graphics EXAM (Same exam for both CTH- and GU students) Saturday, January 13 th, 2018, 08:30-12:30 Examiner Ulf Assarsson, tel. 031-772 1775 Permitted Technical Aids None, except
Draw the basic Geometry Objects. Hanyang University
 Draw the basic Geometry Objects Hanyang University VERTEX ATTRIBUTE AND GEOMETRIC PRIMITIVES Vertex Vertex A point in 3D space, or a corner of geometric primitives such as triangles, polygons. Vertex attributes
Lab - Introduction to Finite Element Methods and MATLAB s PDEtoolbox
 Scientific Computing III 1 (15) Institutionen för informationsteknologi Beräkningsvetenskap Besöksadress: ITC hus 2, Polacksbacken Lägerhyddsvägen 2 Postadress: Box 337 751 05 Uppsala Telefon: 018 471
CS4620/5620: Lecture 14 Pipeline
 CS4620/5620: Lecture 14 Pipeline 1 Rasterizing triangles Summary 1! evaluation of linear functions on pixel grid 2! functions defined by parameter values at vertices 3! using extra parameters to determine
Homework #2. Shading, Ray Tracing, and Texture Mapping
 Computer Graphics Prof. Brian Curless CSE 457 Spring 2000 Homework #2 Shading, Ray Tracing, and Texture Mapping Prepared by: Doug Johnson, Maya Widyasari, and Brian Curless Assigned: Monday, May 8, 2000
CPSC GLOBAL ILLUMINATION
 CPSC 314 21 GLOBAL ILLUMINATION Textbook: 20 UGRAD.CS.UBC.CA/~CS314 Mikhail Bessmeltsev ILLUMINATION MODELS/ALGORITHMS Local illumination - Fast Ignore real physics, approximate the look Interaction of
Graphics. Texture Mapping 고려대학교컴퓨터그래픽스연구실.
 Graphics Texture Mapping 고려대학교컴퓨터그래픽스연구실 3D Rendering Pipeline 3D Primitives 3D Modeling Coordinates Model Transformation 3D World Coordinates Lighting 3D World Coordinates Viewing Transformation 3D Viewing
CHAPTER 1 Graphics Systems and Models 3
 ?????? 1 CHAPTER 1 Graphics Systems and Models 3 1.1 Applications of Computer Graphics 4 1.1.1 Display of Information............. 4 1.1.2 Design.................... 5 1.1.3 Simulation and Animation...........
8.2 Graph and Write Equations of Parabolas
 8.2 Graph and Write Equations of Parabolas Where is the focus and directrix compared to the vertex? How do you know what direction a parabola opens? How do you write the equation of a parabola given the
Animation & Rendering
 7M836 Animation & Rendering Introduction, color, raster graphics, modeling, transformations Arjan Kok, Kees Huizing, Huub van de Wetering h.v.d.wetering@tue.nl 1 Purpose Understand 3D computer graphics
Medical Image Processing using MATLAB
 Medical Image Processing using MATLAB Emilia Dana SELEŢCHI University of Bucharest, Romania ABSTRACT 2. 3. 2. IMAGE PROCESSING TOOLBOX MATLAB and the Image Processing Toolbox provide a wide range of advanced
TcpMDT. Digital Terrain Model Version 7.5. TcpMDT
 Digital Terrain Model Version 7.5 Versions and Modules PROFESSIONAL STANDARD IMAGES SURVEYING POINT CLOUD Product Features STANDARD Surveying Points Management Digital Terrain Model Contours Terrain Cross
CS2401 COMPUTER GRAPHICS ANNA UNIV QUESTION BANK
 CS2401 Computer Graphics CS2401 COMPUTER GRAPHICS ANNA UNIV QUESTION BANK CS2401- COMPUTER GRAPHICS UNIT 1-2D PRIMITIVES 1. Define Computer Graphics. 2. Explain any 3 uses of computer graphics applications.
CS 354R: Computer Game Technology
 CS 354R: Computer Game Technology Texture and Environment Maps Fall 2018 Texture Mapping Problem: colors, normals, etc. are only specified at vertices How do we add detail between vertices without incurring
form are graphed in Cartesian coordinates, and are graphed in Cartesian coordinates.
 Plot 3D Introduction Plot 3D graphs objects in three dimensions. It has five basic modes: 1. Cartesian mode, where surfaces defined by equations of the form are graphed in Cartesian coordinates, 2. cylindrical
6.837 Introduction to Computer Graphics Final Exam Tuesday, December 20, :05-12pm Two hand-written sheet of notes (4 pages) allowed 1 SSD [ /17]
![6.837 Introduction to Computer Graphics Final Exam Tuesday, December 20, :05-12pm Two hand-written sheet of notes (4 pages) allowed 1 SSD [ /17]](/thumbs/87/95541269.jpg "6.837 Introduction to Computer Graphics Final Exam Tuesday, December 20, :05-12pm Two hand-written sheet of notes (4 pages) allowed 1 SSD [ /17]") 6.837 Introduction to Computer Graphics Final Exam Tuesday, December 20, 2011 9:05-12pm Two hand-written sheet of notes (4 pages) allowed NAME: 1 / 17 2 / 12 3 / 35 4 / 8 5 / 18 Total / 90 1 SSD [ /17]
6.837 Introduction to Computer Graphics Final Exam Tuesday, December 20, 2011 9:05-12pm Two hand-written sheet of notes (4 pages) allowed NAME: 1 / 17 2 / 12 3 / 35 4 / 8 5 / 18 Total / 90 1 SSD [ /17]
3 CHAPTER. Coordinate Geometry
 3 CHAPTER We are Starting from a Point but want to Make it a Circle of Infinite Radius Cartesian Plane Ordered pair A pair of numbers a and b instead in a specific order with a at the first place and b
Chapter 7 - Light, Materials, Appearance
 Chapter 7 - Light, Materials, Appearance Types of light in nature and in CG Shadows Using lights in CG Illumination models Textures and maps Procedural surface descriptions Literature: E. Angel/D. Shreiner,
Adaptive Point Cloud Rendering
 1 Adaptive Point Cloud Rendering Project Plan Final Group: May13-11 Christopher Jeffers Eric Jensen Joel Rausch Client: Siemens PLM Software Client Contact: Michael Carter Adviser: Simanta Mitra 4/29/13
Spring 2011 Prof. Hyesoon Kim
 Spring 2011 Prof. Hyesoon Kim Application Geometry Rasterizer CPU Each stage cane be also pipelined The slowest of the pipeline stage determines the rendering speed. Frames per second (fps) Executes on
Triangle Rasterization
 Triangle Rasterization Computer Graphics COMP 770 (236) Spring 2007 Instructor: Brandon Lloyd 2/07/07 1 From last time Lines and planes Culling View frustum culling Back-face culling Occlusion culling
Open Game Engine Exchange Specification
 Open Game Engine Exchange Specification Version 1.0.1 by Eric Lengyel Terathon Software LLC Roseville, CA Open Game Engine Exchange Specification ISBN-13: 978-0-9858117-2-3 Copyright 2014, by Eric Lengyel
Image Analysis. 1. A First Look at Image Classification
 Image Analysis Image Analysis 1. A First Look at Image Classification Lars Schmidt-Thieme Information Systems and Machine Learning Lab (ISMLL) Institute for Business Economics and Information Systems &
AMCS / CS 247 Scientific Visualization Lecture 4: Data Representation, Pt. 1. Markus Hadwiger, KAUST
 AMCS / CS 247 Scientific Visualization Lecture 4: Data Representation, Pt. 1 Markus Hadwiger, KAUST Reading Assignment #2 (until Sep 1) Read (required): Data Visualization book, finish Chapter 2 Data Visualization