By: Eng. Mohammed T. Abo Alroos
|
|
|
- Evelyn Hutchinson
- 6 years ago
- Views:
Transcription
1 By: Eng. Mohammed T. Abo Alroos
2 Use Case Points The formula for calculating UCP is composed of three variables: 1. Unadjusted Use Case Points (UUCP), which measures the complexity of the functional requirements 2. The Technical Complexity Factor (TCF), which measures the complexity of the nonfunctional requirements 3. The Environment Complexity Factor (ECF), which assesses the development team s experience and their development environment
3 UCP = UUCP * TCF * ECF Unadjusted Use Case Points (UUCPs) are computed as a sum of these two components: 1. The Unadjusted Actor Weight (UAW), based on the combined complexity of all the actors in all the use cases. 2. The Unadjusted Use Case Weight (UUCW), based on the total number of activities (or steps) contained in all the use case scenarios.
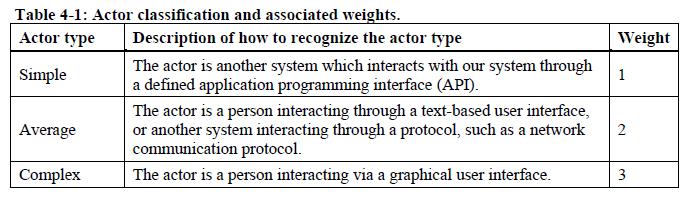
4 UAW

5 UAW - Example
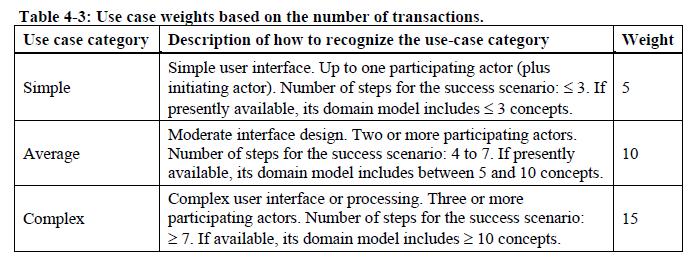
6 UUCW
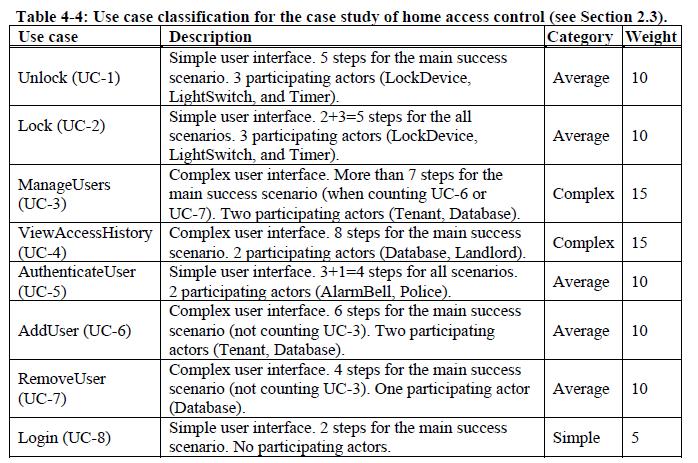
7 UUCW-Example
8 Technical Complexity Factor (TCF) Nonfunctional Requirements Thirteen standard technical factors were identified (by expert developers) to estimate the impact on productivity of the nonfunctional requirements for the project. Where : constant1=0.6 and Constant2=0.01 Wi = weight of ith technical factor Fi = perceived complexity of ith technical factor
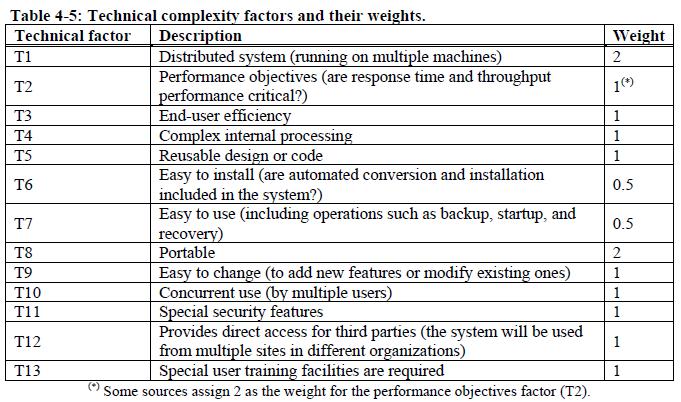
9

10 TCF-Example TCF= (31)=0.91
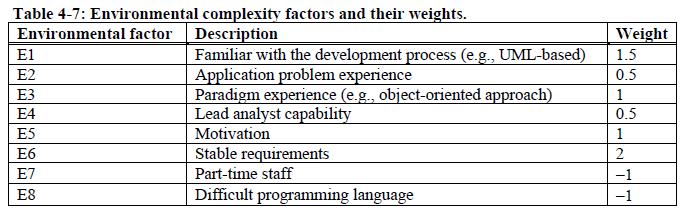
11 Environment Complexity Factor (ECF) The environmental factors measure the experience level of the people on the project and the stability of the project Where : Constant1 = 1.4 Constant2=-0.03 Wi = weight of ith environmental factor Fi = perceived impact of ith environmental factor
12

13 ECP-Example ECP= (11)=1.07
14 UCP-Example UUCP = 97 TCF = 0.91 ECF = 1.07 For the sample case study, the final UCP is the following: UCP = 97 * 0.91 * 1.07 = or 94 use case points.
15 Project Duration Suppose the project has Productivity Factor (PF) = 20, so find the project duration : Project Duration =94.45 * 20=1889 hours Dividing the Project Duration by 40 hours (for one man work week) = 47 man-weeks. Therefore, for the sample values in this article, it would take one developer 47 weeks (or about 12 months) to complete the application.
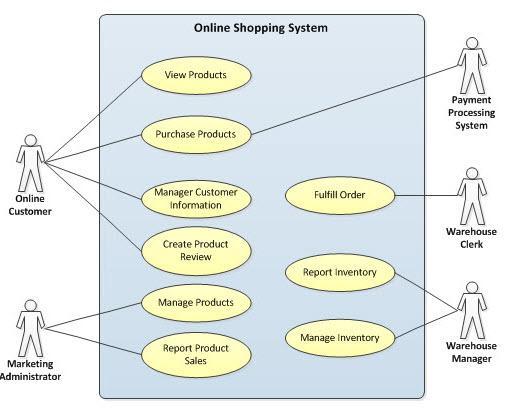
16 Example 1 To illustrate the process of calculating the UCP, an Online Shopping System will be used. The diagram below depicts the Use Case Diagram for the system to be developed.
17
18 UUCW To calculate the UUCW, the use cases must be defined and the number of transactions for each use case identified. The Online Shopping System use case diagram is depicting that nine use cases exist for the system. Assuming 2 of these use cases are simple, 3 are average and 4 are complex, the calculation for UUCW is as follows: UUCW = (Total No. of Simple Use Cases x 5) + (Total No. Average Use Cases x 10) + (Total No. Complex Use Cases x 15) For the Online Shopping System, the UUCW = (2 x 5) + (3 x 10) + (4 x 15) = 100 UUCW = 100
19 UAW To calculate the UAW, the actors must be identified. The Online Shopping System use case diagram is depicting five actors; One simple for the Payment Processing System and four complex for each of the human users actors (i.e. Online Customer, Marketing Administrator, Warehouse Clerk, Warehouse Manager.) The calculation for UAW is as follows: UAW = (Total No. of Simple Actors x 1) + (Total No. Average Actors x 2) + (Total No. Complex Actors x 3) For the Online Shopping System, UAW = (1 x 1) + (0 x 2) + (4 x 3) = 13 UAW = 13
20 TCF To calculate the TCF, each of the technical factors is assigned a value based on how essential the technical aspect is to the system being developed. The diagram below shows the assigned values for the Online Shopping System. The values are multiplied by the weighted values and the total TF is determined.
21 Factor Description Weight Assigned Value Weight x Assigned Value T1 Distributed system T2 Response time/performance objectives T3 End-user efficiency T4 Internal processing complexity T5 Code reusability T6 Easy to install T7 Easy to use T8 Portability to other platforms T9 System maintenance T10 Concurrent/parallel processing T11 Security features T12 Access for third parties T13 End user training Total (TF): 42
22 TCF Next, the TCF is calculated: TCF = (TF/100) For the Online Shopping System, TCF = (42/100) = 1.02 TCF = 1.02
23 ECF To calculate the ECF, each of the environmental factors is assigned a value based the team experience level. The diagram below shows the assigned values for the Online Shopping System. The values are multiplied by the weighted values and the total EF is determined.
24 E1 Factor Description Weight Assigned Value Familiarity with development process used Weight x Assigned Value E2 Application experience E3 Object-oriented experience of team E4 Lead analyst capability E5 Motivation of the team E6 Stability of requirements E7 Part-time staff E8 Difficult programming language Total (EF): 10.5 ECF = (-0.03 x EF) For the Online Shopping System, ECF = (-0.03 * 10.5) = ECF = 1.085
25 UCP UCP = (UUCW + UAW) x TCF x ECF For the Online Shopping System, UCP = ( ) x 1.02 x = UCP = For the Online Shopping System, the total estimated size to develop the software is Use Case Points.
26 Project Duration Now that the size of the project is known, the total effort for the project can be estimated. For the Online Shopping System example, 28 man hours per use case point will be used. For the Online Shopping System, Estimated Effort (Project Duration )= x 28 Estimated Effort = 3501 Hours
27 Example 2 Use Case Type Description Weight Number of Use Cases Simple A simple user interface and touches only a single database entity; its success scenario has 3 steps or less; its implementation involves less than 5 classes. Result Average Complex More interface design and touches 2 or more database entities; between 4 to 7 steps; its implementation involves between 5 to 10 classes. Involves a complex user interface or processing and touches 3 or more database entities; over seven steps; its implementation involves more than 10 classes Total UUCW 220
28 UAW Actor Type Description Weight Number of Actors Result Simple Average The Actor represents another system with a defined API The Actor represents another system interacting through a protocol, like TCP/IP Complex The Actor is a person interacting via an interface Total UAW 44
29 TCF Technical Factor Description Weight Perceived Complexity Calculated Factor (weight*perceived complexity)> T1 Distributed System T2 Performance T3 End User Efficiency T4 Complex internal Processing T5 Reusability T6 Easy to install T7 Easy to use T8 Portable T9 Easy to change T10 Concurrent T11 Special security features T12 T13 Provides direct access for third parties Special user training facilities are required Total Factor 47 TCF = (.01*Total Factor). the TCF = 1.07
30 ECF Environmental Factor Description Weight Perceived Impact Calculated Factor (weight*perceived complexity) E1 Familiarity with UML E2 Application Experience E3 Object Oriented Experience E4 Lead analyst capability E5 Motivation E6 Stable Requirements E7 Part-time workers E8 Difficult Programming language Total Factor 26 ECF = (-0.03*Total Factor, the ECF = 0.62
31 UCP UCP = TCP * ECF * UUCP UCP= 1.07 * 0.62 * 264 = The Productivity Factor (PF) is a ratio of the number of man hours per use case point based on past projects. A typical value is 20. Duration = 1.07 * 0.62 * 264 * 20 = or 3503 hours. Dividing the UCP by 40 hours (for one man work week) = 88 man-weeks. Therefore, for the sample values in this article, it would take one developer 88 weeks (or about 22 months) to complete the application
32 Cyclomatic Complexity Thomas McCabe [1974] devised a measure of cyclomatic complexity, intended to capture the complexity of a program s conditional logic. A program with no branches is the least complex; a program with a loop is more complex; and a program with two crossed loops is more complex still. Cyclomatic complexity corresponds roughly to an intuitive idea of the number of different paths through the program the greater the number of different paths through a program, the higher the complexity.
33 Cyclomatic complexity of graph G equals #edges - #nodes + 2 V(G) = e n + 2 Also corresponds to the number of binary decisions in a program plus 1 If all decisions are not binary, a three-way decision is counted as two binary decisions and an n-way case (select or switch) statement is counted as n 1 binary decisions. The iteration test in a looping statement is counted as one binary decision.
34 Converting Code to Graph
35 Given p the number of connected components of a graph: V(G) = e n + 2p (1) V LI (G) = e n + p + 1 (2) (2) is known as linearly-independent cyclomatic complexity V LI does not change when program is modularized into p modules
36 Cyclomatic Complexity Drawback Cyclomatic complexity ignores the complexity of sequential statements. In other words, any program with no conditional branching has zero cyclomatic complexity. It does not distinguish different kinds of control flow complexity, such as loops vs. IF-THEN-ELSE statements or selection statements vs. nested IF- THEN-ELSE statements.
37 Cyclomatic complexity metric was originally designed to indicate a program s testability and understandability. It allows you to also determine the minimum number of unique tests that must be run to execute every executable statement in the program. To have good testability and maintainability, McCabe recommends that no program module should exceed a cyclomatic complexity of 10.
38 Example 1 Compute The cyclomatic Complexity????!!! And derive the independent paths
39 Solution By one of these ways : V(G)=number of simple decisions + 1 =3+1=4 V(G)=number of enclosed areas + 1=3+1=4 V(G)=e-n+2p=11-9+2=4
 = 4, there are four")


40 1 2 Next, we derive the independent paths: Since V(G) = 4, there are four paths Path 1: 1,2,3,6,7,8 Path 2: 1,2,3,5,7,8 Path 3: 1,2,4,7,8 Path 4: 1,2,4,7,2,4,...7,8 7 8 Finally, we derive test cases to exercise these paths.
41 What is the complexity V(G)? public void howcomplex() { int i=20; while (i<10) { System.out.printf("i is %d", i); if (i%2 == 0) { System.out.println("even"); } else { System.out.println("odd"); } } }
42 Solution public void howcomplex() { int i=20; i); } while (i<10) { System.out.printf("i is %d", } if (i%2 == 0) { System.out.println("even"); } else { System.out.println("odd"); } V(G) = 2 enclosed area + 1 = 3
43 Example 2
44 Solution
45 Example 3
46 Solution
47 Example 4 Void Test::Test3(){ String a,b,c,d,e,f; If((a ==b) (e == f)) C=d Else C=f }
48 Example 5
49 Solve (a) Draw the flowchart of the above algorithm. (b) Draw the corresponding graph and label the nodes as n1, n2, and edges as e1, e2, (c) Calculate the cyclomatic complexity of the above algorithm.
50 Solution / a
51 Solution /b
52 Solution / c Using the original formula by McCabe [1974] we have V(G) = *2 = 7 Notice that there are a total of 19 nodes in Quicksort and Partition because nodes n4 and n5 are each split in two. Alternatively, [Henderson-Sellers & Tegarden, 1994] linearly-independent cyclomatic complexity for the graph yields VLI(G) = = 6 which is what we obtain, as well, by a simple rule: VLI(G) = number of closed regions + 1 = = 6
53 Measuring Module Cohesion Cohesion is defined as a measure of relatedness or consistency in the functionality of a software unit. It is an attribute that identifies to which degree the parts within that unit belong together or are related to each other. Modules with high cohesion : robust, reliable, reusable, and easy to understand. Modules with low cohesion : difficult to understand, test, maintain, and reuse
54 Internal Cohesion or Syntactic Cohesion Internal cohesion can best be understood as syntactic cohesion evaluated by examining the code of each individual module A very crude modularization is to require that each module should not exceed certain size, e.g., 50 lines of code. This would arbitrarily quantize the program into blocks of about 50 lines each. Alternatively, we may require that each unit of design has certain prescribed size. For example, a package is required to have certain number of classes, or each class a certain number of attributes and operations.
55 An Ordinal Scale for Cohesion Measurement high cohesion 6 - Functional cohesion module performs a single well-defined function 5 - Sequential cohesion >1 function, but they occur in an order prescribed by the specification 4 - Communication cohesion >1 function, but on the same data (not a single data structure or class) 3 - Procedural cohesion multiple functions that are procedurally related 2 - Temporal cohesion >1 function, but must occur within the same time span (e.g., initialization) 1 - Logical cohesion module performs a series of similar functions, e.g., Java class java.lang.math 0 - Coincidental cohesion PROBLEM: Depends on subjective human assessment low cohesion
56 An early metric of this type is the Lack of Cohesion of Methods (LCOM1). This metric counts the number of pairs of methods that do not share their class attributes. Under LCOM1, the perfect cohesion achieved when all methods access all attributes. Because of perfect cohesion, we expect the lack-of-cohesion value to be 0. At the opposite end of the spectrum, each method accesses only a single attribute (assuming that m = a). In this case, we expect LCOM = 1, which indicates extreme lack of cohesion.
57 Example Metrics (1) class C1 class C2 class C3 class C4 a 1 a 4 a 1 a 4 a 1 a 4 a 1 a 4 m 1 m 4 m 1 m 4 m 1 m 4 Class Cohesion Metric Definition / Formula m 1 m 4 (1) Lack of Cohesion of Methods (LCOM1) (Chidamber & Kemerer, 1991) LCOM1 = Number of pairs of methods that do not share attributes (2) LCOM2 (Chidamber & Kemerer, 1991) P = Number of pairs of methods that do not share attributes Q = Number of pairs of methods that share attributes LCOM2 = P Q, if P Q 0 0, otherwise (3) (4) LCOM3 (Li & Henry, 1993) LCOM4 (Hitz & Montazeri, 1995) LCOM3 = Number of disjoint components in the graph that represents each method as a node and the sharing of at least one attribute as an edge C1, C4: C2: C3: Similar to LCOM3 and additional edges are used to represent method invocations C1: C2, C3: C4: # Method Pairs = NP = M 2 = M! 2! (M 2)! LCOM1: LCOM1(C1) = P = NP Q = 6 1 = 5 LCOM1(C2) = 6 2 = 4 LCOM1(C3) = 6 2 = 4 LCOM1(C4) = 6 1 = 5 LCOM2: LCOM2(C1) = P Q = 5 1 = 4 LCOM2(C2) = 4 2 = 2 LCOM2(C3) = 4 2 = 2 LCOM2(C4) = 5 1 = 4 NP(Ci) = 4 2 = 6 LCOM3: LCOM3(C1) = 3 LCOM3(C2) = 2 LCOM3(C3) = 2 LCOM3(C4) = 3 LCOM4: LCOM4(C1) = 3 LCOM4(C2) = 2 LCOM4(C3) = 2 LCOM4(C4) = 1 57
58 LCOM3 and LCOM4 for class C7 class C7 a 1 a 4 LCOM3 = Number of disjoint components in the graph that represents each method as a node and the sharing of at least one attribute as an edge Steps: 1. Draw four nodes (circles) for four methods. 2. Connect the first three circles because they are sharing attribute a 1. m 1 m 4 class C7 C7 & C7 : m 1 m 2 m 3 m 4 LCOM3 creates the same graph for C7 and C7 --- there are two disjoint components in both cases LCOM3(C7) = LCOM3(C7 ) = 2 a 1 a 4 m 1 m 4 LCOM4 = Similar to LCOM3 and additional edges are used to represent method invocations Steps: 1. Draw four nodes (circles) for four methods. 2. Connect the first three circles because they are sharing attribute a For C7 only: Connect the last two circles because m 3 invokes m 4. C7: C7 : m 1 m 2 m 3 m 4 m 1 m 2 m 3 m 4 LCOM4 finds two disjoint components in case C7 LCOM4(C7) = 2 LCOM4 finds one disjoint component in case C7 LCOM4(C7 ) = 1 58
59 Example Metrics (1) class C7 class C8 class C9 a 1 a 4 a 1 a 4 a 1 a 4 m 1 m 4 m 1 m 4 m 1 m 4 Class Cohesion Metric Lack of Discrimination Anomaly (LDA) Cases (1) (2) Lack of Cohesion of Methods (LCOM1) (Chidamber & Kemerer, 1991) LCOM2 (Chidamber & Kemerer, 1991) LDA1) When the number of method pairs that share common attributes is the same, regardless of how many attributes they share, e.g., in C7 4 pairs share 1 attribute and in C8 4 pairs share 3 attributes each LDA2) When the number of method pairs that share common attributes is the same, regardless of which attributes are shared, e.g., in C7 4 pairs share same attribute and in C9 4 pairs share 4 different attributes LDA1) and LDA2) same as for LCOM1 LDA3) When P Q, LCOM2 is zero, e.g., C7, C8, and C9 (3) LCOM3 (Li & Henry, 1993) LDA1) same as for LCOM1 LDA4) When the number of disjoint components (have no cohesive interactions) is the same in the graphs of compared classes, regardless of their cohesive interactions, e.g., inability to distinguish b/w C1 & C3 (4) LCOM4 (Hitz & Montazeri, 1995) Same as for LCOM3 class C1 a 1 a 4 m 1 m 4 class C3 a 1 a 4 m 1 m 4 LCOM1: LCOM3: LCOM1(C1) = P = NP Q = 6 1 = 5 LCOM1(C3) = 6 2 = 4 LCOM1(C7) = 6 4 = 2 LCOM1(C8) = 6 4 = 2 LCOM1(C9) = 6 4 = 2 LCOM3(C1) = 3 LCOM3(C3) = 2 LCOM3(C7) = 2 LCOM3(C8) = 2 LCOM3(C9) = 1 LCOM2: LCOM4: LCOM2(C1) = P Q = 5 1 = 4 LCOM2(C3) = 4 2 = 2 LCOM2(C7) = 0 P < Q LCOM2(C8) = 0 P < Q LCOM2(C9) = 0 P < Q LCOM4(C1) = 3 LCOM4(C3) = 2 LCOM4(C7) = 2 LCOM4(C8) = 2 LCOM4(C9) = 1 59
60 Example Metrics (2) class C1 class C2 class C3 class C4 a 1 a 4 a 1 a 4 a 1 a 4 a 1 a 4 m 1 m 4 m 1 m 4 m 1 m 4 Class Cohesion Metric Definition / Formula m 1 m 4 (5) LCOM5 (Henderson-Sellers, 1996) LCOM5 = (a kl) / (l kl), where l is the number of attributes, k is the number of methods, and a is the summation of the number of distinct attributes accessed by each method in a class (6) Coh (Briand et al., 1998) Coh = a / kl, where a, k, and l have the same definitions as above Coh = 1 (1 1/k)LCOM5 k (1 Coh) LCOM5 = k 1 a(c1) = ( ) = 5 a(c2) = ( ) = 6 a(c3) = ( ) = 6 a(c4) = ( ) = 5 LCOM5: LCOM5(C1) = (5 4 4) / (4 4 4) = 11 / 12 LCOM5(C2) = 10 / 12 = 5 / 6 LCOM5(C3) = 5 / 6 LCOM5(C4) = 11 / 12 Coh: Coh(C1) = 5 / 16 Coh(C2) = 6 / 16 = 3 / 8 Coh(C3) = 3 / 8 Coh(C4) = 5 / 16 60
61 Example Metrics (2) class C1 class C2 class C3 class C4 a 1 a 4 a 1 a 4 a 1 a 4 a 1 a 4 m 1 m 4 m 1 m 4 m 1 m 4 m 1 m 4 Class Cohesion Metric Lack of Discrimination Anomaly (LDA) Cases (5) LCOM5 (Henderson-Sellers, 1996) LDA5) when classes have the same number of attributes accessed by methods, regardless of the distribution of these method-attribute associations, e.g., C2 and C3 (6) Coh (Briand et al., 1998) Same as for LCOM5 Coh = 1 (1 1/k)LCOM5 k (1 Coh) LCOM5 = k 1 a(c1) = ( ) = 5 a(c2) = ( ) = 6 a(c3) = ( ) = 6 a(c4) = ( ) = 5 LCOM5: LCOM5(C1) = (5 4 4) / (4 4 4) = 11 / 12 LCOM5(C2) = 10 / 12 = 5 / 6 LCOM5(C3) = 5 / 6 LCOM5(C4) = 11 / 12 Coh: Coh(C1) = 5 / 16 Coh(C2) = 6 / 16 = 3 / 8 Coh(C3) = 3 / 8 Coh(C4) = 5 / 16 61
62 Example Metrics (3) class C1 class C2 class C3 class C4 a 1 a 4 a 1 a 4 a 1 a 4 a 1 a 4 m 1 m 4 m 1 m 4 m 1 m 4 Class Cohesion Metric Definition / Formula m 1 m 4 (7) Tight Class Cohesion (TCC) (Bieman & Kang, 1995) TCC = Fraction of directly connected pairs of methods, where two methods are directly connected if they are directly connected to an attribute. A method m is directly connected to an attribute when the attribute appears within the method s body or within the body of a method invoked by method m C1: C3: directly or transitively C2: C4: (8) (9) (10) Loose Class Cohesion (LCC) (Bieman & Kang, 1995) In class C3: m 1 and m 3 transitively connected via m 2 Degree of Cohesion-Direct (DC D ) (Badri, 2004) Degree of Cohesion-Indirect (DC I ) (Badri, 2004) NP P TCC = Q* / NP = NP Q*(C4) = 3 NP(Ci) = 6 = 1 LCOM1 NP TCC: TCC(C1) = 1 / 6 TCC(C2) = 2 / 6 TCC(C3) = 2 / 6 TCC(C4) = 3 / 6 LCC = Fraction of directly or transitively connected pairs of methods, where two methods are transitively connected if they are directly or indirectly connected to an attribute. A method m, directly connected to an attribute j, is indirectly connected to an attribute i when there is a method directly or transitively connected to both attributes i and j C3: C1, C2: same as for TCC C4: DC D = Fraction of directly connected pairs of methods, where two methods are directly connected if they satisfy the condition mentioned above for TCC or if the two methods directly or transitively invoke C3: C1, C2: same as for TCC the same method C4: DC I = Fraction of directly or transitively connected pairs of methods, where two methods are transitively connected if they satisfy the condition mentioned above for LCC or if the two methods directly or transitively invoke C3: the same method C1, C2: same as for TCC C4: LCC: LCC(C1) = 1/6 LCC(C2) = 2/6 LCC(C3) = 3/6 LCC(C4) = 3/6 DC D : DC D (C1) = 1/6 DC D (C2) = 2/6 DC D (C3) = 2/6 DC D (C4) = 4/6 DC I : DC I (C1) = 1/6 DC I (C2) = 2/6 DC I (C3) = 3/6 DC I (C4) = 4/6 62
63 Example Metrics (4) class C1 class C2 class C3 class C4 a 1 a 4 a 1 a 4 a 1 a 4 a 1 a 4 m 1 m 4 m 1 m 4 m 1 m 4 Class Cohesion Metric Definition / Formula m 1 m 4 (11) (12) (13) Class Cohesion (CC) (Bonja & Kidanmariam, 2006) Class Cohesion Metric (SCOM) (Fernandez & Pena, 2006) Low-level design Similarity-based Class Cohesion (LSCC) (Al Dallal & Briand, 2009) CC = Ratio of the summation of the similarities between all pairs of methods to the total number of pairs of methods. The similarity between methods i and j is defined as: I i I j Similarity(i, j) = where, I i and I j are the sets of attributes referenced by methods i and j I i I j CC = Ratio of the summation of the similarities between all pairs of methods to the total number of pairs of methods. The similarity between methods i and j is defined as: I i I j I i I j Similarity(i, j) =. where, l is the number of attributes min( I i, I j ) l LSCC(C) = 0 1 if k = 1 l i=1 x i (x i 1) if k = 0 or l = 0 otherwise lk (k 1) where l is the number of attributes, k is the number of methods, and x is the number of methods that reference attribute i CC: CC(C1) = 1 / 2 CC(C2) = 1 CC(C3) = 1 CC(C4) = 1 / 2 SCOM: SCOM(C1) = 2 / 4 = 1 / 2 SCOM(C2) = 2 / / 4 = 1 SCOM(C3) = 2 / / 4 = 1 SCOM(C4) = 2 / 4 = 1 / 2 LSCC: LSCC(C1) = 2 / (4*4*3) = 2 / 48 = 1 / 24 LSCC(C2) = (2 + 2) / (4*4*3) = 1 / 12 LSCC(C3) = 1 / 12 LSCC(C4) = 1 / 24 63
International Journal of Software and Web Sciences (IJSWS)
") International Association of Scientific Innovation and Research (IASIR) (An Association Unifying the Sciences, Engineering, and Applied Research) ISSN (Print): 2279-0063 ISSN (Online): 2279-0071 International
International Association of Scientific Innovation and Research (IASIR) (An Association Unifying the Sciences, Engineering, and Applied Research) ISSN (Print): 2279-0063 ISSN (Online): 2279-0071 International
Improving the Applicability of Object-Oriented Class Cohesion Metrics
 Improving the Applicability of Object-Oriented Class Cohesion Metrics Jehad Al Dallal Department of Information Science Kuwait University P.O. Box 5969, Safat 13060, Kuwait jehad@ku.edu.kw Abstract Context:
Procedia Computer Science
 Procedia Computer Science 00 (2009) 000 000 Procedia Computer Science www.elsevier.com/locate/procedia INSODE 2011 Theoretical Analysis for the Impact of Including Special Methods in Lack-of-Cohesion Computation
2IS55 Software Evolution. Software metrics (2) Alexander Serebrenik
 Alexander Serebrenik") 2IS55 Software Evolution Software metrics (2) Alexander Serebrenik Administration Assignment 5: Deadline: May 22 1-2 students Next week NO CLASS Next class May 15 / SET / W&I 2-5-2012 PAGE 1 Sources /
2IS55 Software Evolution Software metrics (2) Alexander Serebrenik Administration Assignment 5: Deadline: May 22 1-2 students Next week NO CLASS Next class May 15 / SET / W&I 2-5-2012 PAGE 1 Sources /
JOURNAL OF OBJECT TECHNOLOGY
 JOURNAL OF OBJECT TECHNOLOGY Online at http://www.jot.fm. Published by ETH Zurich, Chair of Software Engineering JOT, 24 Vol. 3, No. 4 (April 24) Special issue: TOOLS USA 23 A Proposal of a New Class Cohesion
High Precision Cohesion Metric
 High Precision Cohesion Metric N. KAYARVIZHY 1, S. KANMANI 2, R.V. UTHARIARAJ 3 1 Assistant Professor, Department of Computer Science and Engineering AMC Engineering College 12 th K.M., Bannerghatta Road,
COST ESTIMATION FOR DISTRIBUTED SYSTEMS USING USE CASE DIAGRAM
 S. V. Pingale et al. : Cost Estimation for Distributed Systems using Use Case Diagram Journal of Advances in Engineering Science 41 Section C (3), July - December 2010, PP 41-48 COST ESTIMATION FOR DISTRIBUTED
2IS55 Software Evolution. Software metrics (3) Alexander Serebrenik
 Alexander Serebrenik") 2IS55 Software Evolution Software metrics (3) Alexander Serebrenik Sources / SET / W&I 19-3-2013 PAGE 1 From imperative to OO All metrics so far were designed for imperative languages Applicable for OO
2IS55 Software Evolution Software metrics (3) Alexander Serebrenik Sources / SET / W&I 19-3-2013 PAGE 1 From imperative to OO All metrics so far were designed for imperative languages Applicable for OO
Towards Cohesion-based Metrics as Early Quality Indicators of Faulty Classes and Components
 2009 International Symposium on Computing, Communication, and Control (ISCCC 2009) Proc.of CSIT vol.1 (2011) (2011) IACSIT Press, Singapore Towards Cohesion-based Metrics as Early Quality Indicators of
Resource Estimation for Objectory Projects
 Resource Estimation for Objectory Projects Gustav Karner Objective Systems SF AB Torshamnsgatan 39, Box 1128 164 22 Kista email: gustav@os.se September 17, 1993 Abstract In order to estimate the resources
Quantify the project. Better Estimates. Resolve Software crises
 Quantify the project Quantifying schedule, performance,work effort, project status Helps software to be compared and evaluated Better Estimates Use the measure of your current performance to improve your
Object Oriented Metrics. Impact on Software Quality
 Object Oriented Metrics Impact on Software Quality Classic metrics Lines Of Code Function points Complexity Code coverage - testing Maintainability Index discussed later Lines of Code KLOC = 1000 Lines
Measuring Cohesion and Coupling of Object-Oriented Systems
 Master Thesis Software Engineering Thesis no: MSE-2004:29 Month: August Year: 2004 Measuring Cohesion and Coupling of Object-Oriented Systems - Derivation and Mutual Study of Cohesion and Coupling Imran
Enhancing Mood Metrics Using Encapsulation
 Proceedings of the 8th WSEAS International Conference on Automation and Information, Vancouver, Canada, June 9-2, 2007 252 Enhancing Mood Metrics Using Encapsulation SUNINT SAINI, MEHAK AGGARWAL Department
Introduction to Software Engineering
 Introduction to Software Engineering (CS350) Lecture 17 Jongmoon Baik Testing Conventional Applications 2 Testability Operability it operates cleanly Observability the results of each test case are readily
FOR0383 Software Quality Assurance
 This method seems much, much bigger than all the other methods. FOR0383 Software Quality Assurance Lecture 15 Code metrics "You cannot control what you cannot measure." Tom DeMarco 2/11/2009 Dr Andy Brooks
Money Machine. Report #3. Group No. 6. Team Members. Instructor: Prof.
 Money Machine Report #3 Group No. 6 Team Members Name Rylan Uherek Avinash Oza Aakash Patel Mozam Todiwala Mandeep Desai Pintu Patel Email rylan@scarletmail.rutgers.edu avioza@scarletmail.rutgers.edu Aak4shpatel@gmail.com
Measuring Complexity
 Measuring Complexity outline why should we measure the complexity of a software system? what might we want to measure? complexity of the source code within a code module between code modules complexity
Software Metrics. Lines of Code
 Software Metrics Naveed Arshad Lines of Code The total number of lines of executable code in the software program or module being measured But lines of code could mean anything e.g. count only executable
A Unified Framework for Cohesion Measurement in Object-Oriented Systems
 A Unified Framework for Cohesion Measurement in Object-Oriented Systems Lionel C. Briand, John W. Daly, and Jürgen Wüst Fraunhofer Institute for Experimental Software Engineering 1 Kaiserslautern, Germany.
HOW AND WHEN TO FLATTEN JAVA CLASSES?
 HOW AND WHEN TO FLATTEN JAVA CLASSES? Jehad Al Dallal Department of Information Science, P.O. Box 5969, Safat 13060, Kuwait ABSTRACT Improving modularity and reusability are two key objectives in object-oriented
DEPARTMENT OF COMPUTER SCIENCE AND ENGINEERING CS SOFTWARE ENGINEERING
 DEPARTMENT OF COMPUTER SCIENCE AND ENGINEERING CS 6403 - SOFTWARE ENGINEERING QUESTION BANK TWO MARKS UNIT I SOFTWARE PROCESS AND PROJECT MANAGEMENT 1. What is software engineering? Software engineering
CHAPTER 4 HEURISTICS BASED ON OBJECT ORIENTED METRICS
 CHAPTER 4 HEURISTICS BASED ON OBJECT ORIENTED METRICS Design evaluation is most critical activity during software development process. Design heuristics are proposed as a more accessible and informal means
Classification for Object-Oriented Cohesion Metrics
 Volume 2, 5, May 2013 Classification for Object-Oriented Cohesion Metrics TejdedaAlhussenAlhadi, Dr. AbdualhafidShuwehdi,Sagaya Aurelia Xavier Patrick Kishore, Dr. Omer Jomah Abstract This paper presents
VETRI VINAYAHA COLLEGE OF ENGINEERING AND TECHNOLOGY DEPARTMENT OF COMPUTER SCIENCE AND ENGINEERING
 VETRI VINAYAHA COLLEGE OF ENGINEERING AND TECHNOLOGY DEPARTMENT OF COMPUTER SCIENCE AND ENGINEERING CS6403 SOFTWARE ENGINEERING II year/ IV sem CSE (Regulation 2013) UNIT 1- SOFTWARE PROCESS AND PROJECT
Software Testing. 1. Testing is the process of demonstrating that errors are not present.
 What is Testing? Software Testing Many people understand many definitions of testing :. Testing is the process of demonstrating that errors are not present.. The purpose of testing is to show that a program
Analysis of Cohesion and Coupling Metrics for Object Oriented System
 2016 IJSRSET Volume 2 Issue 2 Print ISSN : 2395-1990 Online ISSN : 2394-4099 Themed Section: Engineering and Technology Analysis of Cohesion and Coupling Metrics for Object Oriented System Annushri Sethi
Analysis of the Trade-Offs and Benefits of Using the Publisher-Subscriber Design Pattern
 Analysis of the Trade-Offs and Benefits of Using the Publisher-Subscriber Design Pattern Technical Paper Srihitha Yerabaka Advisor: Prof. Ivan Marsic Abstract Design patterns describe a proven successful
Taxonomy Dimensions of Complexity Metrics
 96 Int'l Conf. Software Eng. Research and Practice SERP'15 Taxonomy Dimensions of Complexity Metrics Bouchaib Falah 1, Kenneth Magel 2 1 Al Akhawayn University, Ifrane, Morocco, 2 North Dakota State University,
Software Metrics and Design Principles. What is Design?
 Software Metrics and Design Principles Chapters 5,8 What is Design? Design is the process of creating a plan or blueprint to follow during actual construction Design is a problem-solving activity that
Measuring internal product attributes: structure. Basel Dudin
 Measuring internal product attributes: structure Basel Dudin dudinbk@mcmaster.ca outline Representing Structure and Complexity Control Flow Graphs (CFG): Representation of Structure Examples of CFG Cyclomatic
Using Metrics To Manage Software Risks. 1. Introduction 2. Software Metrics 3. Case Study: Measuring Maintainability 4. Metrics and Quality
 Using Metrics To Manage Software Risks 1. Introduction 2. Software Metrics 3. Case Study: Measuring Maintainability 4. Metrics and Quality 1 1. Introduction Definition Measurement is the process by which
UNIT 1-SOFTWARE PROCESS AND PROJECT MANAGEMENT
 PART A (2 MARKS) UNIT 1-SOFTWARE PROCESS AND PROJECT MANAGEMENT 1. What is software engineering? Software engineering is a discipline in which theories, methods and tools are applied to develop professional
Darshan Institute of Engineering & Technology for Diploma Studies
 REQUIREMENTS GATHERING AND ANALYSIS The analyst starts requirement gathering activity by collecting all information that could be useful to develop system. In practice it is very difficult to gather all
Cohesion as Changeability Indicator in Object-Oriented Systems
 Cohesion as Changeability Indicator in Object-Oriented Systems Hind Kabaili, Rudolf K. Keller and François Lustman Département IRO Université de Montréal C.P. 6128, succursale Centre-ville Montréal, Québec
Object Oriented Measurement
 Object Oriented Measurement Diego Chaparro González dchaparro@acm.org Student number: 59881P 17th January 2003 Abstract This document examines the state of art in software products measurement, with focus
Software Testing: A Craftsman s Approach, 4 th Edition. Chapter 16 Software Complexity
 Chapter 16 Software Complexity Levels of Software Complexity Unit Level Topological (cyclomatic) complexity, based on a program graph Decisional complexity, a refinement of topological complexity, based
Measuring the quality of UML Designs
 Measuring the quality of UML Designs Author: Mr. Mark Micallef (mmica@cs.um.edu.mt) Supervisor: Dr. Ernest Cachia (eacaci@cs.um.edu.mt) Affiliation: University of Malta (www.um.edu.mt) Keywords Software
Technical Metrics for OO Systems
 Technical Metrics for OO Systems 1 Last time: Metrics Non-technical: about process Technical: about product Size, complexity (cyclomatic, function points) How to use metrics Prioritize work Measure programmer
Software metrics for Java and C++ practices. Référencement des métriques utiles à la caractérisation des pratiques sensibles pour Java et C++
 Software metrics for Java and C++ practices Référencement des métriques utiles à la caractérisation des pratiques sensibles pour Java et C++ Workpackage: 1.1 31 March 2010 This deliverable is available
COMPARATIVE ANALYSIS OF COHESION METRICS FOR COMPONENT BASED SOFTWARE SYSTEM
 COMPARATIVE ANALYSIS OF COHESION METRICS FOR COMPONENT BASED SOFTWARE SYSTEM 1 POOJA RANA, 2 RAJENDER SINGH 1 Research scholar, Department of Computer Science and Applications, M.D. University, Rohtak,
SENG 421: Software Metrics
 SENG 421: Software Metrics Measuring Internal Product Attributes: Structural Complexity (Chapter 6) Department of Electrical & Computer Engineering, University of Calgary B.H. Far (far@ucalgary.ca) http://www.enel.ucalgary.ca/people/far/lectures/seng421/06/
SOFTWARE PRODUCT QUALITY SOFTWARE ENGINEERING SOFTWARE QUALITY SOFTWARE QUALITIES - PRODUCT AND PROCESS SOFTWARE QUALITY - QUALITY COMPONENTS
 SOFTWARE PRODUCT QUALITY Today: - Software quality - Quality Components - Good software properties SOFTWARE ENGINEERING SOFTWARE QUALITY Today we talk about quality - but what is quality? Suitable Fulfills
Darshan Institute of Engineering & Technology for Diploma Studies
 CODING Good software development organizations normally require their programmers to follow some welldefined and standard style of coding called coding standards. Most software development organizations
Software Metrics for Package Remodularisation
 Software Metrics for Package Remodularisation (Des métriques logicielles pour la remodularisation de packages) Deliverable: 1.1 - Cutter ANR 2010 BLAN 0219 02 Stéphane Ducasse, Nicolas Anquetil, Usman
CHAPTER 4 OBJECT ORIENTED COMPLEXITY METRICS MODEL
 64 CHAPTER 4 OBJECT ORIENTED COMPLEXITY METRICS MODEL 4.1 INTRODUCTION Customers measure the aspects of the final product to determine whether it meets the requirements and provides sufficient quality.
Chapter 10. Testing and Quality Assurance
 Chapter 10 Testing and Quality Assurance Different styles of doing code review Human Reviewer Code Inspection with continuous integration infrastructure Pinger s testing set up Testing Related topics 1.
Project Management with Enterprise Architect
 Project Management with Enterprise Architect Enterprise Architect is an intuitive, flexible and powerful UML analysis and design tool for building robust and maintainable software. This booklet explains
ARiSA First Contact Analysis
 ARiSA First Contact Analysis Applied Research In System Analysis - ARiSA You cannot control what you cannot measure Tom DeMarco Software Grail Version 1.3 Programming Language Java 1.4 Date 2 nd of December,
CS6403 SOFTWARE ENGINEERING Year / Sem : II / IV Sub. Code &Subject : CS6403 SOFTWARE ENGINEERING QUESTION BANKWITH ANSWERS
 CS6403 SOFTWARE ENGINEERING Year / Sem : II / IV Sub. Code &Subject : CS6403 SOFTWARE ENGINEERING QUESTION BANKWITH ANSWERS UNIT 1-SOFTWARE PROCESS AND PROJECT MANAGEMENT 1. What is software engineering?
An Object-Oriented Metrics Suite for Ada 95
 An Object-Oriented Metrics Suite for Ada 95 William W. Pritchett IV DCS Corporation 133 Braddock Place Alexandria, VA 22314 73.683.843 x726 wpritche@dcscorp.com 1. ABSTRACT Ada 95 added object-oriented
Interactions A link message
 Interactions An interaction is a behavior that is composed of a set of messages exchanged among a set of objects within a context to accomplish a purpose. A message specifies the communication between
Department of Electrical & Computer Engineering, University of Calgary. B.H. Far
 SENG 421: Software Metrics Software Test Metrics (Chapter 10) Department of Electrical & Computer Engineering, University of Calgary B.H. Far (far@ucalgary.ca) http://www.enel.ucalgary.ca/people/far/lectures/seng421/10/
Research Article ISSN:
 Research Article [Agrawal, 1(3): May, 2012] IJESRT INTERNATIONAL JOURNAL OF ENGINEERING SCIENCES & RESEARCH TECHNOLOGY Use Of Software Metrics To Measure And Improve The Quality Of The Software Design
Solved Question Paper June 2017
 Solved Question Paper June 2017 1.a) What are the benefits of Object Oriented Methodology in real life applications? Briefly explain each element of the state diagram with respect to dynamic modeling.
Fault Prediction OO Systems Using the Conceptual Cohesion of Classes
 Fault Prediction OO Systems Using the Conceptual Cohesion of Classes Subba Rao Polamuri, S. Rama Sree, M.Rajababu Dept of Computer Science and Engineering, Aditya Engineering College Surampalem, Kakinada,
How We Design Interfaces, and How To Assess It
 How We Design Interfaces, and How To Assess It Hani Abdeen, Houari Sahraoui, Shata Osama To cite this version: Hani Abdeen, Houari Sahraoui, Shata Osama. How We Design Interfaces, and How To Assess It.
Analysis of software architecture quality metrics
 Analysis of software architecture quality metrics Hongyu Chen hongyu.chen@rwthaachen.de 23.04.2014 Motivation Goals elated work Approaches Evaluation Conclusion Motivation Motivation A good software architecture
Principal Component Analysis of Lack of Cohesion in Methods (LCOM) metrics
 metrics") Principal Component Analysis of Lack of Cohesion in Methods (LCOM) metrics Anuradha Lakshminarayana Timothy S.Newman Department of Computer Science University of Alabama in Huntsville Abstract In this
Principal Component Analysis of Lack of Cohesion in Methods (LCOM) metrics Anuradha Lakshminarayana Timothy S.Newman Department of Computer Science University of Alabama in Huntsville Abstract In this
What are Metrics?! Functions, that assign a precise numerical value to. Detecting Design Problems using Metrics
 Detecting Design Problems using Metrics What are Metrics?! Functions, that assign a precise numerical value to! Products (Software)! Resources (Staff, Tools, Hardware)! Processes (Software development).
Subject: Software Engineering & UML (MCA 401)
") International School of Informatics and Management Model Answer Paper for Midterm Test MCA IV Semester Subject: Software Engineering & UML (MCA 401) Ques1. Marks: 3 What do youunderstand by cyclomatic
International School of Informatics and Management Model Answer Paper for Midterm Test MCA IV Semester Subject: Software Engineering & UML (MCA 401) Ques1. Marks: 3 What do youunderstand by cyclomatic
Improving the quality of software cohesion metrics through dynamic analysis
 Improving the quality of software cohesion metrics through dynamic analysis Ravneet kaur, Amritsar Department of Computer Science, Lovely Professional university, Phagwara, India Abstract - Class cohesion
MTAT : Software Testing
 MTAT.03.159: Software Testing Lecture 03: White-Box Testing (Textbook Ch. 5) Spring 2013 Dietmar Pfahl email: dietmar.pfahl@ut.ee Lecture Chapter 5 White-box testing techniques (Lab 3) Structure of Lecture
Software Design & Evolution. Lecture 04. You cannot control what you cannot measure. Metrics & Problem Detection. Michele Lanza
 Software Design & Evolution Lecture 04 Michele Lanza Metrics & Problem Detection Metrics? Don t trust them Michele Lanza & Radu Marinescu Object-Oriented Metrics in Practice Using Software Metrics to Characterize,
INTRODUCTION TO SOFTWARE ENGINEERING
 INTRODUCTION TO SOFTWARE ENGINEERING Structural Testing d_sinnig@cs.concordia.ca Department for Computer Science and Software Engineering Introduction Testing is simple all a tester needs to do is find
Moonzoo Kim CS Division of EECS Dept.
 Chapter 15 Product Metrics Moonzoo Kim CS Division of EECS Dept. KAIST 1 Overview of Ch15. Product Metrics 15.1 Software Quality 15.2 A Framework for Product Metrics 15.3 Metrics for the Analysis Model
Software design and Implementation 1/6. Software Design and Implementation. Sample Final Exam
 Software design and Implementation 1/6 Software Design and Implementation Sample Final Exam 18.11.2004 Conditions: Closed book Duration: 120 min Name: Student ID: 1. /20 2. /20 3. /20 4. /20 5. /20 Total
Chapter 10. Object-Oriented Analysis and Modeling Using the UML. McGraw-Hill/Irwin
 Chapter 10 Object-Oriented Analysis and Modeling Using the UML McGraw-Hill/Irwin Copyright 2007 by The McGraw-Hill Companies, Inc. All rights reserved. Objectives 10-2 Define object modeling and explain
Risk-based Object Oriented Testing
 Risk-based Object Oriented Testing Linda H. Rosenberg, Ph.D. Ruth Stapko Albert Gallo NASA GSFC SATC NASA, Unisys SATC NASA, Unisys Code 302 Code 300.1 Code 300.1 Greenbelt, MD 20771 Greenbelt, MD 20771
An Object Oriented Runtime Complexity Metric based on Iterative Decision Points
 An Object Oriented Runtime Complexity Metric based on Iterative Amr F. Desouky 1, Letha H. Etzkorn 2 1 Computer Science Department, University of Alabama in Huntsville, Huntsville, AL, USA 2 Computer Science
Systems Analysis and Design in a Changing World, Fourth Edition
 Systems Analysis and Design in a Changing World, Fourth Edition Systems Analysis and Design in a Changing World, 4th Edition Learning Objectives Explain the purpose and various phases of the systems development
What is Structural Testing?
 Structural Testing What is Structural Testing? Based on Source Code Examine the internal structure of the program Test cases are derived from an examination of program s logic Do not pay any attention
Metrics and OO. SE 3S03 - Tutorial 12. Alicia Marinache. Week of Apr 04, Department of Computer Science McMaster University
 and OO OO and OO SE 3S03 - Tutorial 12 Department of Computer Science McMaster University Complexity Lorenz CK Week of Apr 04, 2016 Acknowledgments: The material of these slides is based on [1] (chapter
Software Testing Prof. Rajib Mall Department of Computer Science and Engineering Indian Institute of Technology, Kharagpur. Lecture 13 Path Testing
 Software Testing Prof. Rajib Mall Department of Computer Science and Engineering Indian Institute of Technology, Kharagpur Lecture 13 Path Testing Welcome to this session and we will discuss about path
Roll No. :. Invigilator's Signature :.. CS/MCA/SEM-4/MCA-401/ SOFTWARE ENGINEERING & TQM. Time Allotted : 3 Hours Full Marks : 70
 Name : Roll No. :. Invigilator's Signature :.. CS/MCA/SEM-4/MCA-401/2012 2012 SOFTWARE ENGINEERING & TQM Time Allotted : 3 Hours Full Marks : 70 The figures in the margin indicate full marks. Candidates
A Study of Software Metrics
 International Journal of Computational Engineering & Management, Vol. 11, January 2011 www..org 22 A Study of Software Metrics Gurdev Singh 1, Dilbag Singh 2, Vikram Singh 3 1 Assistant Professor, JIET
A SENSITIVE METRIC OF CLASS COHESION. Luis Fernández, Rosalía Peña
 82 International Journal "Information Theories & Applications" Vol.13 [JSP, 2005] JavaServer Pages. http://ava.sun.com/2ee/jsp/ [Taglibs, 2005] Tag libraries. http://ava.sun.com/products/jsp/taglibraries/
A Suite of Object Oriented Cognitive Complexity Metrics
 Received November 29, 2017, accepted December 27, 2017, date of publication January 10, 2018, date of current version March 13, 2018. Digital Object Identifier 10.1109/ACCESS.2018.2791344 A Suite of Object
a. The following method would allow an object of the static type List<String> to be passed to it as an argument.
 On the final exam you will be provided UML diagrams for design patterns (as in the midterm) and also JavaDoc description of methods in the Reflection API. 1. True/False (if false, explain why) a. The following
Quality Metrics Tool for Object Oriented Programming
 Quality Metrics Tool for Object Oriented Programming Mythili Thirugnanam * and Swathi.J.N. Abstract Metrics measure certain properties of a software system by mapping them to numbers (or to other symbols)
MTAT : Software Testing
 MTAT.03.159: Software Testing Lecture 03: White-Box Testing (Textbook Ch. 5) Dietmar Pfahl Spring 2016 email: dietmar.pfahl@ut.ee Lecture Chapter 5 White-box testing techniques (Lab 3) Structure of Lecture
MTAT Software Engineering. Written Exam 17 January Start: 9:15 End: 11:45
 MTAT.03.094 Software Engineering Written Exam 17 January 2014 Start: 9:15 End: 11:45 Important Notes: The exam is open book and open laptop. Web browsing is allowed, but you are not allowed to use e mail
Comparing Software Abstractions Baby Steps. Michael Hansen Lab Lunch Talk 2011
 Comparing Software Abstractions Baby Steps Michael Hansen Lab Lunch Talk 2011 Comparing Abstractions Need objective comparison method Libraries (OpenGL vs. Direct3D) Language constructs ( -expressions,
LECTURE 11 TEST DESIGN TECHNIQUES IV
 Code Coverage Testing 1. Statement coverage testing 2. Branch coverage testing 3. Conditional coverage testing LECTURE 11 TEST DESIGN TECHNIQUES IV Code Complexity Testing 1. Cyclomatic Complexity s V
Investigation of Metrics for Object-Oriented Design Logical Stability
 Investigation of Metrics for Object-Oriented Design Logical Stability Mahmoud O. Elish Department of Computer Science George Mason University Fairfax, VA 22030-4400, USA melish@gmu.edu Abstract As changes
Design Concepts and Principles
 Design Concepts and Principles Analysis to Design Data Object Description Entity- Relationship Diagram Data Flow Diagram Process Specification (PSPEC) Component level design (or) procedural design Data
Maintainability and Agile development. Author: Mika Mäntylä
 Maintainability and Agile development Author: Mika Mäntylä ISO 9126 Software Quality Characteristics Are the required functions available in the software? How easy is it to
Darshan Institute of Engineering & Technology for Diploma Studies Rajkot Unit-1
 Failure Rate Darshan Institute of Engineering & Technology for Diploma Studies Rajkot Unit-1 SOFTWARE (What is Software? Explain characteristics of Software. OR How the software product is differing than
Empirical Evaluation and Critical Review of Complexity Metrics for Software Components
 Proceedings of the 6th WSEAS Int. Conf. on Software Engineering, Parallel and Distributed Systems, Corfu Island, Greece, February 16-19, 2007 24 Empirical Evaluation and Critical Review of Complexity Metrics
UNIT II Requirements Analysis and Specification & Software Design
 UNIT II Requirements Analysis and Specification & Software Design Requirements Analysis and Specification Many projects fail: because they start implementing the system: without determining whether they
Thresholds for Software Quality Metrics in Open Source Android Projects
 Thresholds for Software Quality Metrics in Open Source Android Projects Mile Stojkovski Applied Computer Science Submission date: December 2017 Supervisor: Deepti Mishra, IDI Co-supervisor: Mariusz Nowostawski,
Object-Oriented Systems Analysis and Design Using UML
 10 Object-Oriented Systems Analysis and Design Using UML Systems Analysis and Design, 8e Kendall & Kendall Copyright 2011 Pearson Education, Inc. Publishing as Prentice Hall Learning Objectives Understand
Verification and Validation. Assuring that a software system meets a user s needs. Verification vs Validation. The V & V Process
 Verification and Validation Assuring that a software system meets a user s needs Ian Sommerville 1995/2000 (Modified by Spiros Mancoridis 1999) Software Engineering, 6th edition. Chapters 19,20 Slide 1
COHERENCY OF CLASSES TO MEASURE THE QUALITY OF OBJECT ORIENTED DESIGN AN EMPIRICAL ANALYSIS
 COHERENCY OF CLASSES TO MEASURE THE QUALITY OF OBJECT ORIENTED DESIGN AN EMPIRICAL ANALYSIS M.V.VIJAYA SARADHI 1, B.R.SASTRY 2 1 Assoc.Prof &HOD, Dept. of CSE, ASTRA, Bandlaguda, Hyderabad, India 2 Director,
SOFTWARE COMPLEXITY MEASUREMENT USING MULTIPLE CRITERIA ABSTRACT
 SOFTWARE COMPLEXITY MEASUREMENT USING MULTIPLE CRITERIA Bhaskar Raj Sinha, Pradip Peter Dey, Mohammad Amin and Hassan Badkoobehi National University, School of Engineering, Technology, and Media 3678 Aero
J2EE Development Best Practices: Improving Code Quality
 Session id: 40232 J2EE Development Best Practices: Improving Code Quality Stuart Malkin Senior Product Manager Oracle Corporation Agenda Why analyze and optimize code? Static Analysis Dynamic Analysis
On the Impact of Refactoring Operations on Code Quality Metrics
 On the Impact of Refactoring Operations on Code Quality Metrics Oscar Chaparro 1, Gabriele Bavota 2, Andrian Marcus 1, Massimiliano Di Penta 2 1 University of Texas at Dallas, Richardson, TX 75080, USA
Using design abstractions to visualize, quantify, and restructure software 1
 The Journal of Systems and Software 42 (1998) 175±187 Using design abstractions to visualize, quantify, and restructure software 1 Byung-Kyoo Kang a, James M. Bieman b, * a Electronics and Telecommunications
Visualizing Software Metrics for increased Refactoring
 Visualizing Software Metrics for increased Refactoring Paul Steneram Bibby ada08pst@student.lu.se Fredrik Palmquist dat11fpa@student.lu.se March 7, 2016 Keywords: Agile Development, Code Complexity, Refactoring
INTERNAL ASSESSMENT TEST III Answer Schema
 INTERNAL ASSESSMENT TEST III Answer Schema Subject& Code: Object-Oriented Modeling and Design (15CS551) Sem: V ISE (A & B) Q. No. Questions Marks 1. a. Ans Explain the steps or iterations involved in object