Announcements. Data Sources a list of data files and their sources, an example of what I am looking for:
|
|
|
- Norah Nash
- 6 years ago
- Views:
Transcription
1 Data Announcements Data Sources a list of data files and their sources, an example of what I am looking for: Source Map of Bangor MEGIS NG911 road file for Bangor MEGIS Tax maps for Bangor City Hall, may need to digitize. Addresses of Schools MEGIS Questionaire results Need to conduct interviews School quality rankings? Lecture 11 1 Test 1covering chapters 1-8 and labs 1-4 Test will be ed to all students Tuesday (Oct. 18 th ), on or before 6:00 PM The test is open book, open notes. The test should be ed back to me by noon, Oct. 20 th. No class on the 20 th. Lecture


2 Basic Spatial Analysis Ch. 9 Lecture 11 3 Spatial data analysis Input -> spatial operation -> output Lecture
3 Input Scope The area or extent of the input data. Local point to point Neighborhood adjacent regions have input Global the entire input data layer may influence output Lecture 11 5 Spatial Data Analysis Usually involves manipulations or calculation of coordinates or attribute variables with a various operators (tools), such as: Measurement Queries & Selection Attribute Location Reclassification Dissolve Buffering Overlay Clip Erase Update Intersect Identity Union Symmetrical Difference Merge Network Analysis Lecture
4 Table Operations Statistics count, minimum, maximum, sum, mean, standard deviation and the number of null values, as well as a frequency distribution of the variable. Summarize - summary statistics include the count, average, minimum, and maximum values Join 1:1 or m:1, two tables become one, but it is not permanent. Relate all other relationships, tables remain separate. Append Tables must have the same columns, number and type Lecture 11 7 Measurement: Figure 6.4 Vector GIS measurements: (a) distance and (b) area Lecture

5 Attribute Selection A query is a question to the database. The database response is a table. The ArcGIS database response is selected records. If the table is the feature table it also displays the selection on the map. Selected records can be exported to form a new shapefile/feature class. Lecture 11 9 Theme Name SQL Lecture
6 Spatial Selection (Select by Location) Identifying features based on spatial criteria Adjacency, connectivity, containment, arrangement Lecture Adjacency depends on the algorithm used (the same is true for all spatial operations) Lecture


7 Touch the boundary of Lecture Share a line segment with Lecture

8 Spatial Selection Identifying features based on spatial criteria Adjacency, connectivity, containment, arrangement Allows us to know which roads connect. Analyze transportation networks. Which river or streams flow into another. Analyze electrical networks. Lecture Spatial Selection Identifying features based on spatial criteria Adjacency, connectivity, containment, arrangement Lecture
9 Selection based on spatial and non-spatial attributes Lecture Spatial data analysis: Reclassification An assignment of a class or value based on the attributes or geography of an object Example: Parcels Reclassified By size Lecture

10 Spatial data analysis: Reclassification Lecture Reclassify in ArcGIS Lecture

11 Lecture Natural Breaks (Jenks) Natural Breaks classes are based on natural groupings inherent in the data. Class breaks are identified that best group similar values and that maximize the differences between classes. The features are divided into classes whose boundaries are set where there are relatively big differences in the data values. Natural breaks are data-specific classifications and not useful for comparing multiple maps built from different underlying information. From ArcGIS 10 Help Lecture
12 Natural Breaks Lecture Lecture
13 Equal Interval Equal interval divides the range of attribute values into equal-sized subranges. This allows you to specify the number of intervals, and ArcGIS will automatically determine the class breaks based on the value range. For example, if you specify three classes for a field whose values range from 0 to 300, ArcGIS will create three classes with ranges of 0 100, , and Equal interval is best applied to familiar data ranges, such as percentages and temperature. This method emphasizes the amount of an attribute value relative to other values. For example, it will show that a store is part of the group of stores that make up the top one-third of all sales. From ArcGIS 10 Help Lecture Equal Interval Lecture

14 Lecture Quantile Each class contains an equal number of features. A quantile classification is well suited to linearly distributed data. Quantile assigns the same number of data values to each class. There are no empty classes or classes with too few or too many values. From ArcGIS 10 Help Lecture
15 Quantile Lecture Lecture

16 Standard Deviation The Standard deviation classification method shows you how much a feature's attribute value varies from the mean. ArcMap calculates the mean and standard deviation. Class breaks are created with equal value ranges that are a proportion of the standard deviation usually at intervals of 1,½, ⅓, or ¼ standard deviations using mean values and the standard deviations from the mean. A two-color ramp helps emphasize values above the mean and values below the mean. From ArcGIS 10 Help Lecture Standard Deviation Lecture
17 Lecture Geometric Interval The geometrical interval classification scheme creates class breaks based on class intervals that have a geometrical series. The geometrical coefficient in this classifier can change once (to its inverse) to optimize the class ranges. The algorithm creates geometrical intervals by minimizing the square sum of elements per class. This ensures that each class range has approximately the same number of values with each class and that the change between intervals is fairly consistent. This algorithm was specifically designed to accommodate continuous data. It produces a result that is visually appealing and cartographically comprehensive. It minimizes variance within classes and can even work reasonably well on data that is not normally distributed. From ArcGIS 10 Help Lecture

18 Geometric Interval Lecture Lecture

19 The Modifiable Areal Unit Problem (MAUP) The results of data analysis are influenced by the number and sizes of the zones used to organize the data. The Modifiable Area Unit Problem has at least three aspects: 1. The number of ways in which fine-scale zones can be aggregated into larger units is often great. 2. The number, sizes, and shapes of zones affect the results of analysis. 3. There are usually no Lecture objective 11 criteria for choosing one zoning scheme over another. 37 MAUP Example Lecture

20 Dissolve Lecture Vector Buffers Lecture


21 Mechanics of Point and Line Buffering Lecture Buffering Variants: point buffer examples Lecture

22 Lecture Regions in Buffering inside, outside, enclosed Lecture

23 Overlay Analysis Combination of different data layers Both spatial and attribute data is combined Requires that data layers use a common coordinate system A new data layer is created Lecture Lecture
24 Lecture Vector Overlay Topology is likely to be different Vector overlays often identify line intersection points automatically. Intersecting lines are split and a node placed at the intersection point Topology must be recreated for later processing Any type of vector may be overlain with any other type Output typically takes the lowest dimension of the inputs For example: Point on Polygon results in a point Lecture
25 Ambiguous result Unambiguous result Lecture Vector Overlay - Most common ways applied, but there are other methods. CLIP INTERSECTION UNION Lecture
26 CLIP Cookie cutter approach Bounding polygon defines the clipped second layer Neither the bounding polygon attributes nor geographic (spatial data) are included in the output layer Lecture Lecture

 is discarded) Lecture 11 54")
27 Lecture INTERSECTION Combines data from both layers but only for the bounding area (Bounding polygon also defines the output layer Data from both layers are combined Data outside the bounding layer (1 st layer) is discarded) Lecture

28 Lecture Lecture
29 UNION Includes all data from both the bounding and data layers New polygons are formed by the combinations of the coordinate data from each layer Lecture Lecture

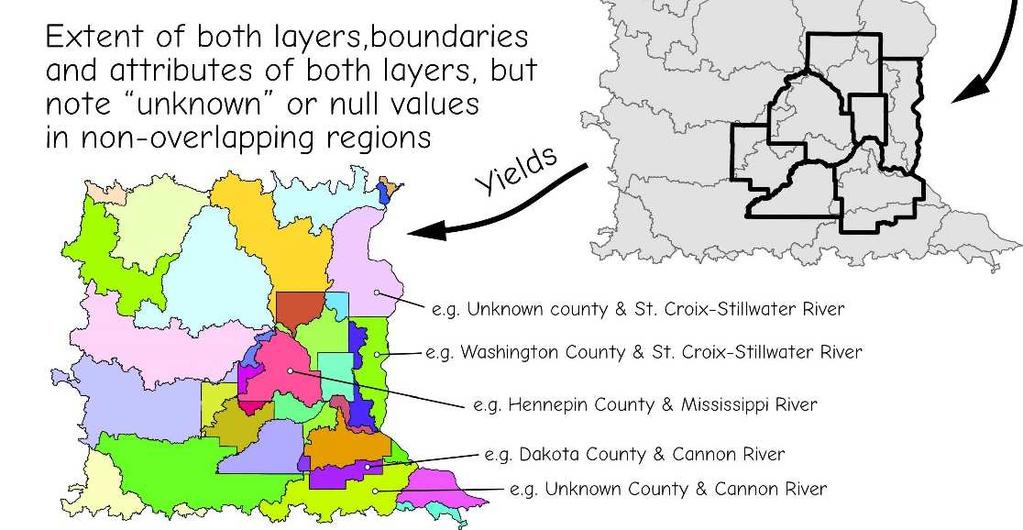
30 Lecture Lecture
31 Identity Analysis Computes a geometric intersection of the Input Features and Identity Features. The Input Features or portions thereof that overlap Identity Features will get the attributes of those Identity Features. Lecture Identity Analysis The Input Features must be point, multipoint, line, or polygon. The Identity Features must be polygons. Output may be multipart. If multipart features are not desired, use the Multipart to Singlepart tool on the output. Lecture


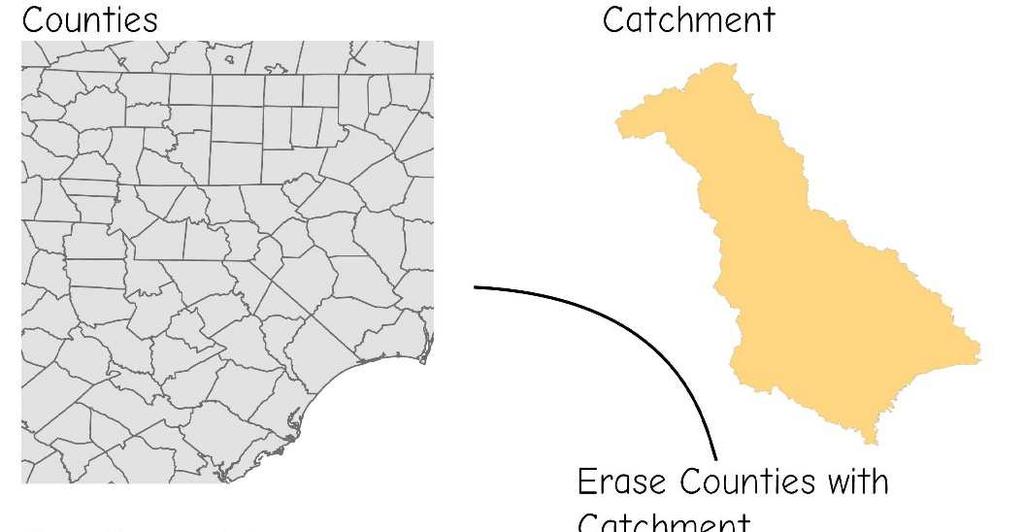
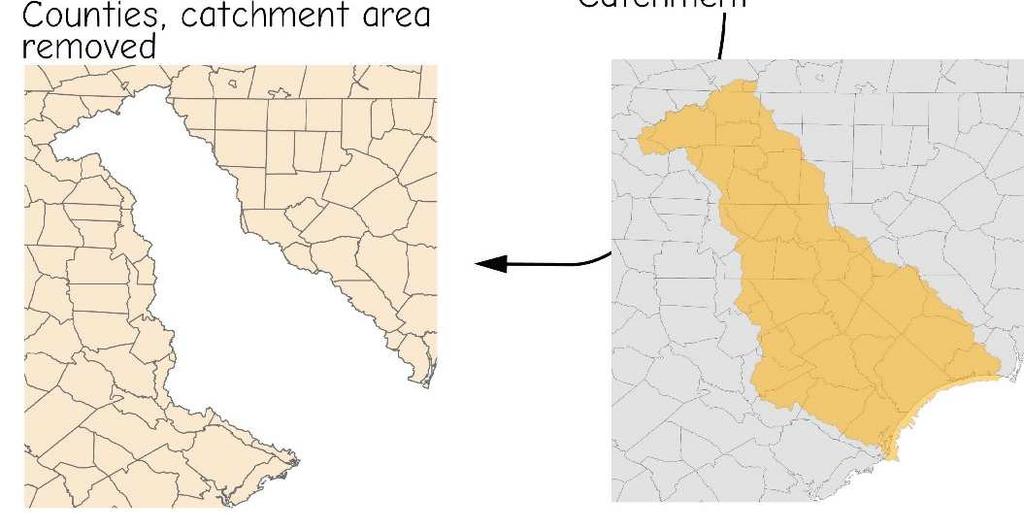
32 Symmetrical Difference Computes a geometric intersection of the input and update features. Features or portions of features in the input and update features which do not overlap will be written to the Output Feature Class. The input and difference feature class and feature layer must have polygon geometry. Output may be multipart. Lecture Update Computes a geometric intersection of the Input Features and Update Features. The attributes and geometry of the input features are updated by the update features in the output feature class. The input must be a polygon. ArcGIS Desktop Help Lecture
33 Why do buffering and vector overlay often take so long? Because a time consuming line intersection test must be performed for all lines in the data layers Then, inside vs. outside regions must be identified for all new polygons Lecture Finding the interior: Interior: Is a point inside a polygon? (shaded)? n= 2, out Potential point n= 4, out n= 3, in n= 1, in Algorithm: Pick a Algorithm: direction (East (right) count in the line example) crossings to Count outside line crossings of convex to thehull, outside if of they convex is an hull odd (shaded number polygon) the point is inside, if If odd even number number, then the point is inside outside If even, the point is outside Lecture
 so the polygons don t line up.")
34 Vector Overlay Common features in Vector overlays create Slivers or Sliver polygons A common feature in both layers. The problem is that each definition is very subtly different (different time, source, materials) so the polygons don t line up. They can only be seen a very large display scale but can represent over half the output polygons. They take very little space but affect analytical results. Lecture Lecture
35 Methods to reduce/remove slivers: Redefine the common boundaries with highest coordinate accuracy and replace them in all layers before overlay Manually identify and remove Use snap distance during overlay Lecture Merge New parcels can be created by merging existing parcels in the parcel fabric. Adjacent parcels can be merged to create a single parcel, and disjoint parcels can be merged to create multipart parcels. Parcels being merged can be saved as historic parcels, kept current, or deleted. ArcGIS Desktop Help Lecture
Watershed Sciences 4930 & 6920 ADVANCED GIS
 Slides by Wheaton et al. (2009-2014) are licensed under a Creative Commons Attribution-NonCommercial-ShareAlike 3.0 Unported License Watershed Sciences 4930 & 6920 ADVANCED GIS VECTOR ANALYSES Joe Wheaton
Lecture 8. Vector Data Analyses. Tomislav Sapic GIS Technologist Faculty of Natural Resources Management Lakehead University
 Lecture 8 Vector Data Analyses Tomislav Sapic GIS Technologist Faculty of Natural Resources Management Lakehead University Vector Data Analysis Vector data analysis involves one or a combination of: Measuring
Watershed Sciences 4930 & 6920 GEOGRAPHIC INFORMATION SYSTEMS
 Watershed Sciences 4930 & 6920 GEOGRAPHIC INFORMATION SYSTEMS WATS 4930/6920 WHERE WE RE GOING WATS 6915 welcome to tag along for any, all or none WEEK FIVE Lecture VECTOR ANALYSES Joe Wheaton HOUSEKEEPING
Copyright The McGraw-Hill Companies, Inc. Permission required for reproduction or display.
 CHAPTER 11 VECTOR DATA ANALYSIS 11.1 Buffering 11.1.1 Variations in Buffering Box 11.1 Riparian Buffer Width 11.1.2 Applications of Buffering 11.2 Overlay 11.2.1 Feature Type and Overlay 11.2.2 Overlay
Vector-Based GIS Data Processing. Chapter 6
 Vector-Based GIS Data Processing Chapter 6 Vector Data Model Feature Classes points lines polygons Layers limited to one class of data Figure p. 186 Vector Data Model Shapefiles ArcView non-topological
Spatial Analysis (Vector) I
 I") Spatial Analysis (Vector) I GEOG 300, Lecture 8 Dr. Anthony Jjumba 1 Spatial Analysis In a GIS, Data are usually grouped into layers (or themes). The analysis functions of a GIS use the spatial and non-spatial
Spatial Analysis (Vector) I GEOG 300, Lecture 8 Dr. Anthony Jjumba 1 Spatial Analysis In a GIS, Data are usually grouped into layers (or themes). The analysis functions of a GIS use the spatial and non-spatial
Basic Geospatial Analysis Techniques: This presentation introduces you to basic geospatial analysis techniques, such as spatial and aspatial
 Basic Geospatial Analysis Techniques: This presentation introduces you to basic geospatial analysis techniques, such as spatial and aspatial selections, buffering and dissolving, overly operations, table
Mid-term exam. GIS and Forest Engineering Applications. Week 5. FE 257. GIS and Forest Engineering Applications. Week 5
 FE 257. GIS and Forest Engineering Applications Week 5 Week 5 Last week (Chapter 3): Acquiring, creating, and editing GIS s Examining Error Chapter 7 Buffering and other proximity operations Questions?
GEOGRAPHIC INFORMATION SYSTEMS Lecture 17: Geoprocessing and Spatial Analysis
 GEOGRAPHIC INFORMATION SYSTEMS Lecture 17: and Spatial Analysis tools are commonly used tools that we normally use to prepare data for further analysis. In ArcMap, the most commonly used tools appear in
GIS in the Social and Natural Sciences. Last Lecture. Today s Outline 5/14/2017. GEOG 4110/5100 Special Topics in Geography
 GEOG 4110/5100 Special Topics in Geography GIS in the Social and Natural Sciences Working with Vector Data in a GIS Last Lecture We talked about the main types of vector data models (CDS, TDS, TIN, Networks)
VECTOR ANALYSIS: QUERIES, MEASUREMENTS & TRANSFORMATIONS
 VECTOR ANALYSIS: QUERIES, MEASUREMENTS & TRANSFORMATIONS GIS Analysis Winter 2016 Spatial Analysis Operations performed on spatial data that add value Can reveal things that might otherwise be invisible
layers in a raster model
 layers in a raster model Layer 1 Layer 2 layers in an vector-based model (1) Layer 2 Layer 1 layers in an vector-based model (2) raster versus vector data model Raster model Vector model Simple data structure
GEOGRAPHIC INFORMATION SYSTEMS Lecture 18: Spatial Modeling
 Spatial Analysis in GIS (cont d) GEOGRAPHIC INFORMATION SYSTEMS Lecture 18: Spatial Modeling - the basic types of analysis that can be accomplished with a GIS are outlined in The Esri Guide to GIS Analysis
Spa$al Analysis and Modeling (GIST 4302/5302) Guofeng Cao Department of Geosciences Texas Tech University
 Guofeng Cao Department of Geosciences Texas Tech University") Spa$al Analysis and Modeling (GIST 4302/5302) Guofeng Cao Department of Geosciences Texas Tech University Class Outlines Spatial Point Pattern Regional Data (Areal Data) Continuous Spatial Data (Geostatistical
Spa$al Analysis and Modeling (GIST 4302/5302) Guofeng Cao Department of Geosciences Texas Tech University Class Outlines Spatial Point Pattern Regional Data (Areal Data) Continuous Spatial Data (Geostatistical
Chapter 17 Creating a New Suit from Old Cloth: Manipulating Vector Mode Cartographic Data
 Chapter 17 Creating a New Suit from Old Cloth: Manipulating Vector Mode Cartographic Data Imagine for a moment that digital cartographic databases were a perfect analog of the paper map. Once you digitized
Lecture 6: GIS Spatial Analysis. GE 118: INTRODUCTION TO GIS Engr. Meriam M. Santillan Caraga State University
 Lecture 6: GIS Spatial Analysis GE 118: INTRODUCTION TO GIS Engr. Meriam M. Santillan Caraga State University 1 Spatial Data It can be most simply defined as information that describes the distribution
Key Terms. Symbology. Categorical attributes. Style. Layer file
 Key Terms Symbology Categorical attributes Style Layer file Review Questions POP-RANGE is a string field of the Cities feature class with the following entries: 0-9,999, 10,000-49,999, 50,000-99,000 This
Introduction to GIS 2011
 Introduction to GIS 2011 Digital Elevation Models CREATING A TIN SURFACE FROM CONTOUR LINES 1. Start ArcCatalog from either Desktop or Start Menu. 2. In ArcCatalog, create a new folder dem under your c:\introgis_2011
LAB 9: Buffering and Overlay in ArcGIS - ArcMAP
 LAB 9: Buffering and Overlay in ArcGIS - ArcMAP What You ll Learn: to apply the concepts of buffering and overlay, two common cartographic operations. You should read chapter 9 in the GIS Fundamentals
ArcView QuickStart Guide. Contents. The ArcView Screen. Elements of an ArcView Project. Creating an ArcView Project. Adding Themes to Views
 ArcView QuickStart Guide Page 1 ArcView QuickStart Guide Contents The ArcView Screen Elements of an ArcView Project Creating an ArcView Project Adding Themes to Views Zoom and Pan Tools Querying Themes
Combine Yield Data From Combine to Contour Map Ag Leader
 Combine Yield Data From Combine to Contour Map Ag Leader Exporting the Yield Data Using SMS Program 1. Data format On Hard Drive. 2. Start program SMS Basic. a. In the File menu choose Open. b. Click on
ArcCatalog or the ArcCatalog tab in ArcMap ArcCatalog or the ArcCatalog tab in ArcMap ArcCatalog or the ArcCatalog tab in ArcMap
 ArcGIS Procedures NUMBER OPERATION APPLICATION: TOOLBAR 1 Import interchange file to coverage 2 Create a new 3 Create a new feature dataset 4 Import Rasters into a 5 Import tables into a PROCEDURE Coverage
Tips for a Good Meshing Experience
 Tips for a Good Meshing Experience Meshes are very powerful and flexible for modeling 2D overland flows in a complex urban environment. However, complex geometries can be frustrating for many modelers
GIS and Forest Engineering Applications
 FE 257. GIS and Forest Engineering Applications Week 3 This week s topics Clip and erase processes Chapter 6 Selecting landscape features in a GIS Chapter 5 GIS Lab3: Determining land use and ownership
Pond Distance and Habitat for use in Wildlife Modeling
 Pond Distance and Habitat for use in Wildlife Modeling These instructions enable you to aggregate layers within a study area, calculate new fields, and create new data out of existing data, for use in
Editing & Maintaining Parcels with ArcMap. Christine Leslie Amy Andis
 Editing & Maintaining Parcels with ArcMap Christine Leslie Amy Andis What to expect An introduction to the parcel fabric A detailed explanation of the parcel fabric data model General editing techniques
Remote Sensing and GIS. GIS Spatial Overlay Analysis
 Subject Paper No and Title Module No and Title Module Tag Geology Remote Sensing and GIS GIS Spatial Overlay Analysis RS & GIS XXXI Principal Investigator Co-Principal Investigator Co-Principal Investigator
Data Assembly, Part II. GIS Cyberinfrastructure Module Day 4
 Data Assembly, Part II GIS Cyberinfrastructure Module Day 4 Objectives Continuation of effective troubleshooting Create shapefiles for analysis with buffers, union, and dissolve functions Calculate polygon
Exercise 3: Creating a Geodatabase
 Exercise 3: Creating a Geodatabase Introduction: A database (DB) is an organized collection of data, that we can visualize as being a group of tables. An example of a simple database can be seen below:
Step by Step GIS. Section 1
 Step by Step GIS Section 1 Contact the web page given below for the data required to do the exercises (http://www.pasda.psu.edu/default.asp) Before beginning the tutorials please visit the Preparation
Soil texture: based on percentage of sand in the soil, partially determines the rate of percolation of water into the groundwater.
 Overview: In this week's lab you will identify areas within Webster Township that are most vulnerable to surface and groundwater contamination by conducting a risk analysis with raster data. You will create
Chapter 9. Attribute joins
 Chapter 9 Spatial Joins 9-1 Copyright McGraw-Hill Education. Permission required for reproduction or display. Attribute joins Recall that Attribute joins: involve combining two attribute tables together
GIS Virtual Workshop: Buffering
 This workshop will teach the different methods of buffering data. They will include: Basic buffering of data Merging buffering zones Clipping the buffer Concentric rings around the object You will find
Computational Geometry Algorithms Library. Geographic information Systems
 Computational Geometry Algorithms Library in Geographic information Systems Edward Verbree, Peter van Oosterom and Wilko Quak TU Delft, Department of Geodesy, Thijsseweg 11, 2629 JA Delft, the Netherlands
Making Yield Contour Maps Using John Deere Data
 Making Yield Contour Maps Using John Deere Data Exporting the Yield Data Using JDOffice 1. Data Format On Hard Drive 2. Start program JD Office. a. From the PC Card menu on the left of the screen choose
Multidimensional Data and Modelling - DBMS
 Multidimensional Data and Modelling - DBMS 1 DBMS-centric approach Summary: l Spatial data is considered as another type of data beside conventional data in a DBMS. l Enabling advantages of DBMS (data
Spatial Analysis and Modeling (GIST 4302/5302) Database Fundaments. Database. Review: Bits and Bytes
 Database Fundaments. Database. Review: Bits and Bytes") Spatial Analysis and Modeling (GIST 4302/5302) Database Fundaments Guofeng Cao Department of Geosciences Texas Tech University Review: Bits and Bytes Data stored in a computer system is measured in bits
Spatial Analysis and Modeling (GIST 4302/5302) Database Fundaments Guofeng Cao Department of Geosciences Texas Tech University Review: Bits and Bytes Data stored in a computer system is measured in bits
GIS Basics for Urban Studies
 GIS Basics for Urban Studies Date: March 21, 2018 Contacts: Mehdi Aminipouri, Graduate Peer GIS Faciliator, SFU Library (maminipo@sfu.ca) Keshav Mukunda, GIS & Map Librarian Librarian for Geography (kmukunda@sfu.ca)
Welcome to NR402 GIS Applications in Natural Resources. This course consists of 9 lessons, including Power point presentations, demonstrations,
 Welcome to NR402 GIS Applications in Natural Resources. This course consists of 9 lessons, including Power point presentations, demonstrations, readings, and hands on GIS lab exercises. Following the last
Lab 1: Exploring ArcMap and ArcCatalog In this lab, you will explore the ArcGIS applications ArcCatalog and ArcMap. You will learn how to use
 Lab 1: Exploring ArcMap and ArcCatalog In this lab, you will explore the ArcGIS applications ArcCatalog and ArcMap. You will learn how to use ArcCatalog to find maps and data and how to display maps in
ArcMap Editing Tips and Tricks. Sean Jones
 ArcMap Editing Tips and Tricks Sean Jones Overview Topics - Tuning your editing map - Creating features - Editing features and attributes - Aligning and editing coincident features - Addins Format - Software
Utility Network Management in ArcGIS: Migrating Your Data to the Utility Network. John Alsup & John Long
 Utility Network Management in ArcGIS: Migrating Your Data to the Utility Network John Alsup & John Long Presentation Outline Utility Network Preparation - Migration Patterns - Understanding the Asset Package
Working with Attribute Data and Clipping Spatial Data. Determining Land Use and Ownership Patterns associated with Streams.
 GIS LAB 3 Working with Attribute Data and Clipping Spatial Data. Determining Land Use and Ownership Patterns associated with Streams. One of the primary goals of this course is to give you some hands-on
Protocol for Riparian Buffer Restoration Prioritization in Centre County and Clinton County
 Protocol for Riparian Buffer Restoration Prioritization in Centre County and Clinton County Chesapeake Conservancy has developed this methodology to prioritize riparian buffer restoration in Centre County
Geographical Information Systems Institute. Center for Geographic Analysis, Harvard University. LAB EXERCISE 1: Basic Mapping in ArcMap
 Harvard University Introduction to ArcMap Geographical Information Systems Institute Center for Geographic Analysis, Harvard University LAB EXERCISE 1: Basic Mapping in ArcMap Individual files (lab instructions,
Vector Data. James Frew ESM 263 Winter
 Vector Data 1 Why Vector Data? Recall: features vs fields features: discrete enffes with specific locafons fields: confnuous funcfons of (x, y) Vector is GIS-speak for feature representafons dimensionality:
Maps as Numbers: Data Models
 Maps as Numbers: Data Models vertices E Reality S E S arcs S E Conceptual Models nodes E Logical Models S Start node E End node S Physical Models 1 The Task An accurate, registered, digital map that can
GISCI GEOSPATIAL CORE TECHNICAL KNOWLEDGE EXAM CANDIDATE MANUAL AUGUST 2017
 GISCI GEOSPATIAL CORE TECHNICAL KNOWLEDGE EXAM CANDIDATE MANUAL AUGUST 2017 This document provides information about the GISCI Geospatial Core Technical Knowledge Exam, now a requirement for GISCI GISP
GIS LAB 1. Basic GIS Operations with ArcGIS. Calculating Stream Lengths and Watershed Areas.
 GIS LAB 1 Basic GIS Operations with ArcGIS. Calculating Stream Lengths and Watershed Areas. ArcGIS offers some advantages for novice users. The graphical user interface is similar to many Windows packages
A CONSISTENCY MAINTENANCE OF SHARED BOUNDARY AFTER POLYGON GENERALIZATION
 CO-182 A CONSISTENCY MAINTENANCE OF SHARED BOUNDARY AFTER POLYGON GENERALIZATION AI T.(1), ZHANG W.(2) (1) Wuhan University, WUHAN CITY, CHINA ; (2) Zhongnan University of Economics and Law, WUHAN CITY,
Streamlining Editing Workflows. Amber Bethell
 Streamlining Editing Workflows Amber Bethell Workflow for solving geographic problems Ask a question Create or acquire data Validate and update data Analyze data Create cartographic product Act upon knowledge
Lecturer 2: Spatial Concepts and Data Models
 Lecturer 2: Spatial Concepts and Data Models 2.1 Introduction 2.2 Models of Spatial Information 2.3 Three-Step Database Design 2.4 Extending ER with Spatial Concepts 2.5 Summary Learning Objectives Learning
Spatial Patterns Point Pattern Analysis Geographic Patterns in Areal Data
 Spatial Patterns We will examine methods that are used to analyze patterns in two sorts of spatial data: Point Pattern Analysis - These methods concern themselves with the location information associated
An Introduction to Spatial Databases
 An Introduction to Spatial Databases R. H. Guting VLDB Journal v3, n4, October 1994 Speaker: Giovanni Conforti Outline: a rather old (but quite complete) survey on Spatial DBMS Introduction & definition
Creating a Smaller Data Set from a Larger Data Set Vector Data
 Creating a Smaller Data Set from a Larger Data Set Vector Data Written by Barbara Parmenter, revised by Carolyn Talmadge January 16, 2015 USING THE SELECTION METHOD QUICK METHOD BY CREATING A LAYER FILE...
GEOSPATIAL ENGINEERING COMPETENCIES. Geographic Information Science
 GEOSPATIAL ENGINEERING COMPETENCIES Geographic Information Science The character and structure of spatial information, its methods of capture, organisation, classification, qualification, analysis, management,
Using Spatial Data in a Desktop GIS; QGIS 2.8 Practical 2
 Using Spatial Data in a Desktop GIS; QGIS 2.8 Practical 2 Practical 2 Learning objectives: To work with a vector base map within a GIS and overlay point data. To practise using Ordnance Survey mapping
Building and Analyzing Topology in Autodesk Map GI21-1
 December 2-5, 2003 MGM Grand Hotel Las Vegas Building and Analyzing Topology in Autodesk Map GI21-1 Alex Penney ISD Training Content Manager, Autodesk Professional Services, Autodesk Inc. Topology is one
Spatial Analysis and Modeling (GIST 4302/5302) Representation of Spatial Data. Representation of Spatial Data Models 3/5/18
 Representation of Spatial Data. Representation of Spatial Data Models 3/5/18") 3/5/8 Spatial Analysis and Modeling (GIST 432/532) Representation of Spatial Data Guofeng Cao Department of Geosciences Texas Tech University Representation of Spatial Data Models Object-based model: treats
3/5/8 Spatial Analysis and Modeling (GIST 432/532) Representation of Spatial Data Guofeng Cao Department of Geosciences Texas Tech University Representation of Spatial Data Models Object-based model: treats
Create a Color-Shaded Map
 GIS Techniques for Monitoring and Evaluation of HIV/AIDS and Related Programs Exercise 3.2 Create a Color-Shaded Map *This training was developed as part of a joint effort between MEASURE Evaluation and
Introduction to Geospatial Analysis
 Introduction to Geospatial Analysis Introduction to Geospatial Analysis 1 Descriptive Statistics Descriptive statistics. 2 What and Why? Descriptive Statistics Quantitative description of data Why? Allow
Object modeling and geodatabases. GEOG 419: Advanced GIS
 Object modeling and geodatabases GEOG 419: Advanced GIS CAD Data Model 1960s and 1970s Geographic data stored as points, lines, and areas No attributes; each feature type stored on a different layer No
May 21, 2014 Walter E. Washington Convention Center Washington, DC USA. Copyright 2014, Oracle and/or its affiliates. All rights reserved.
 May 21, 2014 Walter E. Washington Convention Center Washington, DC USA 1 How to Build a Better GIS Application Siva Ravada Senior Director of Development Spatial and Graph & MapViewer Oracle Program Agenda
Data Assembling Topics:
 Topics: 1. GPX to Shape file 2. Data conversion with FME 3. Create a polygon feature 4. Merging /Appending data into a new dataset 5. Reproject data from one coordinate system to another 6. Data clipping
M. Andrea Rodríguez-Tastets. I Semester 2008
 M. -Tastets Universidad de Concepción,Chile andrea@udec.cl I Semester 2008 Outline refers to data with a location on the Earth s surface. Examples Census data Administrative boundaries of a country, state
QGIS Workshop Su Zhang and Laura Gleasner 11/10/2016. QGIS Workshop
 1. Introduction to Quantum GIS (QGIS) QGIS Workshop QGIS is a free and open source Geographic Information System (GIS). QGIS can help you create, edit, visualize, and publish geospatial information on
Lecture 7 Attribute-based Operations
 Lecture 7 Attribute-based Operations Learning Objectives 7.1 What is meant by reduce information content using an attribute-based operation? Why would one want to reduce information? 7.2 What is meant
Lecture 2 Map design. Dr. Zhang Spring, 2017
 Lecture 2 Map design Dr. Zhang Spring, 2017 Model of the course Using and making maps Navigating GIS maps Map design Working with spatial data Geoprocessing Spatial data infrastructure Digitizing File
Advanced Parcel Editing. Amy Andis Tim Hodson
 Advanced Parcel Editing Amy Andis Tim Hodson Overview What to expect in this technical workshop Review of the Parcel Fabric Data Model Advanced Tips and tricks for Parcel entry Assessing Quality of Parcel
Tutorial 4: Query and Select Spatial Data
 Tutorial 4: Query and Select Spatial Data This tutorial will introduce you to the following: Identifying Attribute Data Sources (Review) Toxic Release Inventory (TRI) facilities and NJ County boundaries
Understanding and Using Geometry, Projections, and Spatial Reference Systems in ArcGIS. Rob Juergens, Melita Kennedy, Annette Locke
 Understanding and Using Geometry, Projections, and Spatial Reference Systems in ArcGIS Rob Juergens, Melita Kennedy, Annette Locke Introduction We want to give you a basic understanding of geometry and
Module 7 Raster operations
 Introduction Geo-Information Science Practical Manual Module 7 Raster operations 7. INTRODUCTION 7-1 LOCAL OPERATIONS 7-2 Mathematical functions and operators 7-5 Raster overlay 7-7 FOCAL OPERATIONS 7-8
Lab Exercise 6: Vector Spatial Analysis
 Massachusetts Institute of Technology Department of Urban Studies and Planning 11.520: A Workshop on Geographic Information Systems 11.188: Urban Planning and Social Science Laboratory Lab Exercise 6:
ENGRG Introduction to GIS
 ENGRG 59910 Introduction to GIS Michael Piasecki April 3, 2014 Lecture 11: Raster Analysis GIS Related? 4/3/2014 ENGRG 59910 Intro to GIS 2 1 Why we use Raster GIS In our previous discussion of data models,
Topology in the Geodatabase an Introduction. Erik Hoel Doug Morgenthaler
 Topology in the Geodatabase an Introduction Erik Hoel Doug Morgenthaler ESRI Super Secret Topology Laboratory, May 2012 Agenda ArcGIS Topology defined Validating a topology Editing a topology Geoprocessing
GEOGRAPHIC INFORMATION SYSTEMS Lecture 02: Feature Types and Data Models
 GEOGRAPHIC INFORMATION SYSTEMS Lecture 02: Feature Types and Data Models Feature Types and Data Models How Does a GIS Work? - a GIS operates on the premise that all of the features in the real world can
Geometric Modeling Mortenson Chapter 11. Complex Model Construction
 Geometric Modeling 91.580.201 Mortenson Chapter 11 Complex Model Construction Topics Topology of Models Connectivity and other intrinsic properties Graph-Based Models Emphasize topological structure Boolean
Querying Data with Transact SQL
 Course 20761A: Querying Data with Transact SQL Course details Course Outline Module 1: Introduction to Microsoft SQL Server 2016 This module introduces SQL Server, the versions of SQL Server, including
INTRODUCTION TO GIS WORKSHOP EXERCISE
 111 Mulford Hall, College of Natural Resources, UC Berkeley (510) 643-4539 INTRODUCTION TO GIS WORKSHOP EXERCISE This exercise is a survey of some GIS and spatial analysis tools for ecological and natural
Raster Data Model & Analysis
 Topics: 1. Understanding Raster Data 2. Adding and displaying raster data in ArcMap 3. Converting between floating-point raster and integer raster 4. Converting Vector data to Raster 5. Querying Raster
QGIS Tutorials Documentation
 QGIS Tutorials Documentation Release 0.1 Nathaniel Roth November 30, 2016 Contents 1 Installation 3 1.1 Basic Installation............................................. 3 1.2 Advanced Installation..........................................
Topology in the Geodatabase: An Introduction
 Topology in the Geodatabase: An Introduction Colin Zwicker Erik Hoel ESRI Super Secret Topology Laboratory, May 2016 Agenda ArcGIS Topology defined Validating a topology Editing a topology Geoprocessing
3D Cadastral System Functionalities for 5D Multi- Purpose LIS
 3D Cadastral System Functionalities for 5D Multi- Purpose LIS ΕΣΠΑ 2007-2013, Δράση«Διμερής Ε&Τ Συνεργασία Ελλάδας- Ισραήλ 2013-2015» YΠOYPΓEIO ΠAΙΔΕΙΑΣ ΚΑΙ ΘΡΗΣΚΕΥΜΑΤΩΝ Γ.Γ.Ε.Τ. ΕΥΔΕ - ΕΤΑΚ Outline 5DMuPLIS
BAT Quick Guide 1 / 20
 BAT Quick Guide 1 / 20 Table of contents Quick Guide... 3 Prepare Datasets... 4 Create a New Scenario... 4 Preparing the River Network... 5 Prepare the Barrier Dataset... 6 Creating Soft Barriers (Optional)...
A Hands-on Experience with Arc/Info 8 Desktop
 Demo of Arc/Info 8 Desktop page 1 of 17 A Hands-on Experience with Arc/Info 8 Desktop Prepared by Xun Shi and Ted Quinby Geography 377 December 2000 In this DEMO, we introduce a brand new edition of ArcInfo,
Brief Contents. Foreword by Sarah Frostenson...xvii. Acknowledgments... Introduction... xxiii. Chapter 1: Creating Your First Database and Table...
 Brief Contents Foreword by Sarah Frostenson....xvii Acknowledgments... xxi Introduction... xxiii Chapter 1: Creating Your First Database and Table... 1 Chapter 2: Beginning Data Exploration with SELECT...
Introduction to Spatial Database Systems. Outline
 Introduction to Spatial Database Systems by Cyrus Shahabi from Ralf Hart Hartmut Guting s VLDB Journal v3, n4, October 1994 1 Outline Introduction & definition Modeling Querying Data structures and algorithms
Introducing ArcScan for ArcGIS
 Introducing ArcScan for ArcGIS An ESRI White Paper August 2003 ESRI 380 New York St., Redlands, CA 92373-8100, USA TEL 909-793-2853 FAX 909-793-5953 E-MAIL info@esri.com WEB www.esri.com Copyright 2003
Multidimensional (spatial) Data and Modelling (2)
 Data and Modelling (2)") Multidimensional (spatial) Data and Modelling (2) 1 Representative operations on maps l l l l l are operations on layers used in maps (all 2-d). Synonyms f. map: layer, spatial partition Def. properties:
Multidimensional (spatial) Data and Modelling (2) 1 Representative operations on maps l l l l l are operations on layers used in maps (all 2-d). Synonyms f. map: layer, spatial partition Def. properties:
Alternate Animal Movement Routes v. 2.1
 Alternate Animal Movement Routes v. 2.1 Aka: altroutes.avx Last modified: April 12, 2005 TOPICS: ArcView 3.x, Animal Movement, Alternate, Route, Path, Proportion, Distance, Bearing, Azimuth, Angle, Point,
NRM435 Spring 2017 Accuracy Assessment of GIS Data
 Accuracy Assessment Lab Page 1 of 18 NRM435 Spring 2017 Accuracy Assessment of GIS Data GIS data always contains errors hopefully the errors are so small that will do not significantly affect the results
Getting Started with Spatial Analyst. Steve Kopp Elizabeth Graham
 Getting Started with Spatial Analyst Steve Kopp Elizabeth Graham Workshop Overview Fundamentals of using Spatial Analyst What analysis capabilities exist and where to find them How to build a simple site
RASTER ANALYSIS S H A W N L. P E N M A N E A R T H D A T A A N A LY S I S C E N T E R U N I V E R S I T Y O F N E W M E X I C O
 RASTER ANALYSIS S H A W N L. P E N M A N E A R T H D A T A A N A LY S I S C E N T E R U N I V E R S I T Y O F N E W M E X I C O TOPICS COVERED Spatial Analyst basics Raster / Vector conversion Raster data
Lab 12: Sampling and Interpolation
 Lab 12: Sampling and Interpolation What You ll Learn: -Systematic and random sampling -Majority filtering -Stratified sampling -A few basic interpolation methods Videos that show how to copy/paste data
Advanced Map Labeling using Maplex. Wendy Harrison & Samuel Troth
 Advanced Map Labeling using Maplex Wendy Harrison & Samuel Troth Presentation Overview We ll be using ArcGIS Pro Introduction - Different types of text in ArcGIS - role of the Maplex Label Engine labeling
Cell based GIS. Introduction to rasters
 Week 9 Cell based GIS Introduction to rasters topics of the week Spatial Problems Modeling Raster basics Application functions Analysis environment, the mask Application functions Spatial Analyst in ArcGIS
Map Analysis with Vector Data
 Map Analysis with Vector Data Francisco Olivera, Ph.D., P.E. Srikanth Koka Lauren Walker Aishwarya Vijaykumar Department of Civil Engineering December 5, 2011 Contents Brief Overview of Map Analysis...
Using GIS to Site Minimal Excavation Helicopter Landings
 Using GIS to Site Minimal Excavation Helicopter Landings The objective of this analysis is to develop a suitability map for aid in locating helicopter landings in mountainous terrain. The tutorial uses
Peoria County Front Desk Map Application
 Peoria County Front Desk Map Application Quick Guide, 2017 At a First Glance This guide will tell users all they need to know about the Peoria County Front Desk application which can be found on the Peoria
Basic Queries Exercise - Haiti
 Basic Queries Exercise - Haiti Written by Barbara Parmenter, revised by Carolyn Talmadge on September 18, 2016 SETTING UP... 1 WHERE ARE THE HOSPITALS THAT ARE STILL OPERATING? (SELECT BY ATTRIBUTE )...