What is a Topographic Map?
|
|
|
- Lynette Hardy
- 6 years ago
- Views:
Transcription
1 Topographic Maps

2 Topography From Greek topos, place and grapho, write the study of surface shape and features of the Earth and other planetary bodies. Depiction in maps. Person whom makes maps is called a cartographer.

3 What is a Topographic Map? A topographic map, also known as a contour map, is a map that shows the shape of the land using contour lines. It is a map that shows an elevation field, meaning how high and low the ground is in relation to sea level.
4 What are contour lines? Contours are imaginary lines that join points of equal elevation above or below sea level. They show the exact elevation, the shape of the land, and the steepness of the land s slope. Contour lines never touch or cross.
5 Let s take a walk up a hill!
6 We re now at an elevation of 100 meters. 100m
7 Let s keep going! 100m
8 Now we re at 200m. 200m 100m
9 Shall we march on? 200m 100m
10 We ve made it to 300m! 300m 200m 100m
11 On to the peak! 300m 200m 100m
12 We re on the peak, but what s our elevation? 300m 200m 100m
13 Any ideas? Let s add contour lines for every 50 meters and see if that helps. 300m 200m 100m
14 We know that we are above 350m, but less than 400m. 350m 300m 250m 200m 150m 100m 50m
15 Let s head down the hill, it s getting late! 350m 300m 250m 200m 150m 100m 50m
16 Now what s our elevation? If you said somewhere between 200m and 250m you are right! 350m 300m 250m 200m 150m 100m 50m
17 Let s try this again! 350m 300m 250m 200m 150m 100m 50m

18 What s our elevation now? If you said 50m or just under, you re right! 350m 300m 250m 200m 150m 100m 50m
19 Let s now look at the same hill, but the way we might see it from an airplane!
20 Each color change represents a 50 meter increase.
21 Now, let s try the same hike! Our elevation is 0 meters.
22 Now what is our elevation?
23 If you said more than 150 meters, but less than 200 meters your right!
24 Let s go a little higher.
25 Think you know our elevation now? More than 300meters But less than 350meters
26 If we were standing on the peak, what would be our elevation? More than 350 meters, less than 400 meters
27 Let s head down hill.
28 Know our elevation?
29 More than 100 meters, less than 150 meters

30 Notice the two high points on the island. What is the elevation of the two high points?
31 What is the elevation of Point A? Point A sits right on the 0 ft contour line. Since all points on this line have an elevation of 0 ft, the elevation of point A is zero.
32 What is the elevation of Point B? Point B sits right on the 10 ft contour line. Since all points on this line have an elevation of 10 ft, the elevation of point B is 10 ft.
33 What is the elevation of Point C? Point C does not sit directly on a contour line so we can not determine the elevation precisely. We do know that point C is between the 10ft and 20 ft contour lines so its elevation must be greater than 10 ft and less than 20 ft. Because point C is midway between these contour lines we can estimate the elevation is about 15 feet (Note this assumes that the slope is constant between the two contour lines, this may not be the case).
34 What is the elevation of Point D? We are even less sure of the elevation of point D than point C. Point D is inside the 20 ft. contour line indicating its elevation is above 20 ft. Its elevation has to be less than 30 ft. because there is no 30 ft. contour line shown. But how much less? There is no way to tell. The elevation could be 21 ft, or it could be 29 ft. There is now way to tell from the map.
35 What is the elevation of Point E? Just as with point C above, we need to estimate the elevation of point E somewhere between the 0 ft and 10 ft contour lines it lies in between. Because this point is closer to the 10 ft line than the 0 ft. line we estimate an elevation closer to 10. In this case 8 ft. seems reasonable. Again this estimation makes the assumption of a constant slope between these two contour lines.

36 Contour Interval difference in elevation between each line. MUST be equal spacing. Remember that a contour interval is not the distance between the two lines to get the distance you need to use the map scale Contour interval = 20 feet 520
37 What is a profile? A profile is the side view of a topographic map. Cross sectional view along a line drawn through a portion of a topographic map.
38 Other Topographic Terms Map scale compares distances on the map with distances on earth. Legend explains symbols used on the map. Index contours contour lines that are labeled to help you find the contour interval. Gradient vertical change in elevation Relief -is the difference between its high and low points.

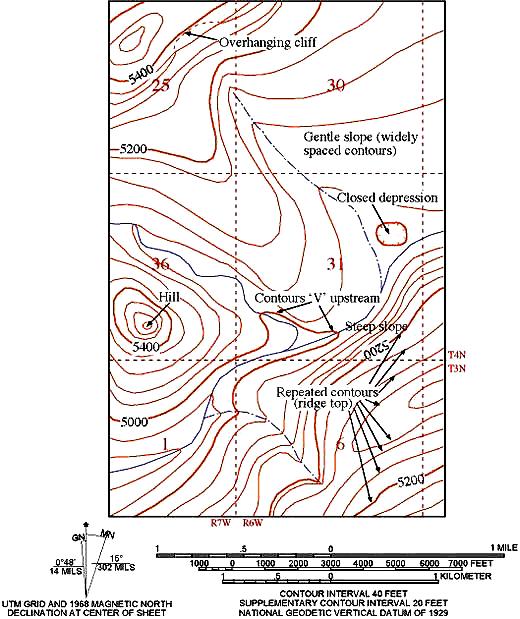
39 What if my contour lines are close together? If the contour lines are close together, then that indicates that area has a steep slope.

40 What if my contour lines are far apart? If the contour lines are far apart, then that indicates the land has a gentle slope (low slope).

41 What do the dark colored contour lines mean? The dark colored contour lines represent every fifth index contour line to make it easier to read.
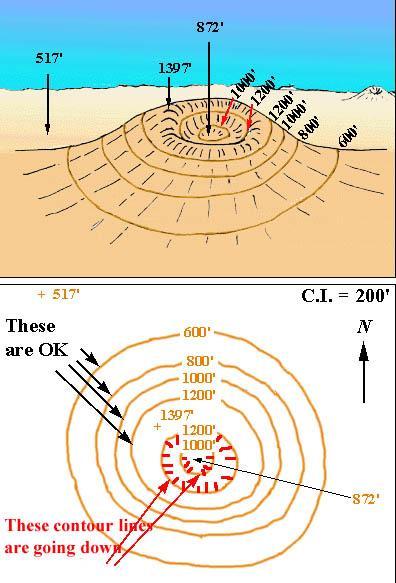
42 What do depressions in the map look like? A depression such as the inside of a dead volcano, is represented by Hachure lines. Hachure lines are regular contour lines with small segments sticking out from it. The first hachure line is at the same elevation as the contour line before it.
43

44 More on Contour Lines Contour lines form V s that point upstream when they cross a stream. It is important to remember that they point in the opposite direction as the flow of water
45 What do the colors on the topographic map represent? Blue lines/shapes represent water features, such as streams and lakes. Brown contour lines Black roads, buildings, railroads, other manmade objects. Green Woodland areas Red - Highways
46
47 Now that I know what a topographic map is, how do I read it? First - determine the contour interval (the distance between each contour line) Second - determine the map scale (usually at the bottom of the map) Third - Identify any hills or depressions Fourth Use the legend to identify man made features.
48 Let s see what you know. E C D A B 1200m 1000m F 600m 800m


49 Grab a piece of paper and write your answers to the following questions. Ready?
50 1. Could the elevation at the peak (B) be 1410 meters? E C D A B 1200m 1000m F 600m 800m
51 2. What is the elevation at (E)? E C D A B 1200m 1000m F 600m 800m
52 3.What is the elevation difference between (A) and (B)? E C D A B 1200m 1000m F 600m 800m
53 4. Could the elevation at (F) be 417 meters? E C D A B 1200m 1000m F 600m 800m
54 5. If you walked a straight line from (D) to (C) would you walk over a ridge or down a valley? E C D A B 1200m 1000m F 600m 800m
55 S 6.Just looking at the map, would it be easier to head down from the peak going East, or going North? E C N W D A B 1200m 1000m F E 600m 800m
56 1. No :The elevation must be under 1400 meters, but over 1300 meters. 2. about 400 meters
57 3. (A) is probably close to the 750 meter line, (B) is above 1300 meters. The difference between the two would probably be 650 to 700 meters.
58 4. No: It must be more than 700 meters and less than 800 meters. 5. Down a valley: If the contour lines point up the slope it s a valley, if they point down the slope it s a ridge.


59 6. East: When contour lines are close together that means there is a steep slope, the further apart the lines, the more gentile the slope and therefore an easier walk! Go east!
Understanding Topographic Maps
 Understanding Topographic Maps 1. Every point on a contour line represents the exact same elevation (remember the glass inserted into the mountain). As a result of this every contour line must eventually
Reconnaissance and Surveillance Leader s Course Map Reading self study worksheet (Tenino, Washington Map)
") Reconnaissance and Surveillance Leader s Course Map Reading self study worksheet (Tenino, Washington Map) General Knowledge 1. Name the five Basic Colors on a map and what they represent? 1. 2. 3. 4. 5.
Reconnaissance and Surveillance Leader s Course Map Reading self study worksheet (Tenino, Washington Map) General Knowledge 1. Name the five Basic Colors on a map and what they represent? 1. 2. 3. 4. 5.
Topic 2B Topographic Maps
 Name Period Topic 2B Topographic Maps Isolines: Contour lines: Contour Interval: Index Contour: The elevation when starting at the OCEAN must be. The contour interval on this map is feet. 2 0 50 E The
Engineering Geology. Engineering Geology is backbone of civil engineering. Topographic Maps. Eng. Iqbal Marie
 Engineering Geology Engineering Geology is backbone of civil engineering Topographic Maps Eng. Iqbal Marie Maps: are a two dimensional representation, of an area or region. There are many types of maps,
Topographic Survey. Topographic Survey. Topographic Survey. Topographic Survey. CIVL 1101 Surveying - Introduction to Topographic Mapping 1/7
 IVL 1101 Surveying - Introduction to Topographic Mapping 1/7 Introduction Topography - defined as the shape or configuration or relief or three dimensional quality of a surface Topography maps are very
2. AREAL PHOTOGRAPHS, SATELLITE IMAGES, & TOPOGRAPHIC MAPS
 LAST NAME (ALL IN CAPS): FIRST NAME: 2. AREAL PHOTOGRAPHS, SATELLITE IMAGES, & TOPOGRAPHIC MAPS Instructions: Refer to Exercise 3 in your Lab Manual on pages 47-64 to answer the questions in this work
Geology and Calculus
 GEOL 452 - Mathematical Tools in Geology Lab Assignment # 6 - Feb 25, 2010 (Due March 9, 2010) Name: Geology and Calculus A. Volume of San Nicolas Island San Nicolas Island is one of the remote and smaller
1. Which diagram best represents the location of the isolines for the elevation field of this landscape? (1) (2) (3) (4)
 (2) (3) (4)") Base your answers to questions 1 through 5 on your knowledge of earth science and on the diagram below which represents the elevation data for a certain landscape region. Points A, B, C, and D are specific
Base your answers to questions 1 through 5 on your knowledge of earth science and on the diagram below which represents the elevation data for a certain landscape region. Points A, B, C, and D are specific
Contour Analysis And Visualization
 Contour Analysis And Visualization Objectives : stages The objectives of Contour Analysis and Visualization can be described in the following 1. To study and analyse the contour 2. Visualize the contour
TEST EXAM PART 2 INTERMEDIATE LAND NAVIGATION
 NAME DATE TEST EXAM PART 2 INTERMEDIATE LAND NAVIGATION 1. Knowing these four basic skills, it is impossible to be totally lost; what are they? a. Track Present Location / Determine Distance / Sense of
Make a TOPOGRAPHIC MAP
 How can you make a topographic map, and what information can you get from it? Activity Overview To build the Panama Canal, engineers dammed the Chagres River. In the process, new lakes were formed, a valley
Vector Data Analysis Working with Topographic Data. Vector data analysis working with topographic data.
 Vector Data Analysis Working with Topographic Data Vector data analysis working with topographic data. 1 Triangulated Irregular Network Triangulated Irregular Network 2 Triangulated Irregular Networks
Applied Cartography and Introduction to GIS GEOG 2017 EL. Lecture-7 Chapters 13 and 14
 Applied Cartography and Introduction to GIS GEOG 2017 EL Lecture-7 Chapters 13 and 14 Data for Terrain Mapping and Analysis DEM (digital elevation model) and TIN (triangulated irregular network) are two
CHAPTER 01 Basics of Surveying
 CHAPTER 01 Basics of Surveying 1.1 How do plane surveys and geodetic surveys differ? Plane surveying assumes all horizontal measurements are taken on a single plane and all vertical measurements are relative
Ilham Marsudi Universitas Negeri Yogyakarta Yogyakarta, Indonesia
 1st International Conference on Technology and Vocational Teachers (ICTVT 2017) Making a Digital Contour Map Ilham Marsudi Universitas Negeri Yogyakarta Yogyakarta, Indonesia ilham@uny.ac.id Abstract---
Making Topographic Maps
 T O P O Applications N Making Topographic Maps M A P S Making Topographic Maps with TNTmips page 1 Before Getting Started TNTmips provides a variety of tools for working with map data and making topographic
Solving Problems with Similar Triangles
 Solving Problems with Similar Triangles xample 1: Given that lines and are parallel in the figure to the right, determine the value of x, the distance between points and. Solution: First, we can demonstrate
Distance in mm from nearest latitude line to location x 150 = seconds of latitude Distance in mm between latitude 2.5 tick marks (along the sides)
") LATITUDE FORMULA FOR 1:24000 SCALE WITH 2.5 TICK MARKS Distance in mm from nearest latitude line to location x 150 = seconds of latitude Distance in mm between latitude 2.5 tick marks (along the sides)
LATITUDE FORMULA FOR 1:24000 SCALE WITH 2.5 TICK MARKS Distance in mm from nearest latitude line to location x 150 = seconds of latitude Distance in mm between latitude 2.5 tick marks (along the sides)
Map Algebra Exercise (Beginner) ArcView 9
 ArcView 9") Map Algebra Exercise (Beginner) ArcView 9 1.0 INTRODUCTION The location of the data set is eastern Africa, more specifically in Nakuru District in Kenya (see Figure 1a). The Great Rift Valley runs through
Map Algebra Exercise (Beginner) ArcView 9 1.0 INTRODUCTION The location of the data set is eastern Africa, more specifically in Nakuru District in Kenya (see Figure 1a). The Great Rift Valley runs through
An Introduction to the Directional Derivative and the Gradient Math Insight
 An Introduction to the Directional Derivative and the Gradient Math Insight The directional derivative Let the function f(x,y) be the height of a mountain range at each point x=(x,y). If you stand at some
Distance in mm from nearest latitude line to location x 150 = seconds of latitude Distance in mm between latitude 2.5 tick marks (along the sides)
") LATITUDE FORMULA FOR 1:24000 SCALE WITH 2.5 TICK MARKS Distance in mm from nearest latitude line to location x 150 = seconds of latitude Distance in mm between latitude 2.5 tick marks (along the sides)
LATITUDE FORMULA FOR 1:24000 SCALE WITH 2.5 TICK MARKS Distance in mm from nearest latitude line to location x 150 = seconds of latitude Distance in mm between latitude 2.5 tick marks (along the sides)
Watershed Modeling Advanced DEM Delineation
 v. 10.1 WMS 10.1 Tutorial Watershed Modeling Advanced DEM Delineation Techniques Model manmade and natural drainage features Objectives Learn to manipulate the default watershed boundaries by assigning
RiparianZone = buffer( River, 100 Feet )
") GIS Analysts perform spatial analysis when they need to derive new data from existing data. In GIS I, for example, you used the vector approach to derive a riparian buffer feature (output polygon) around
GIS Analysts perform spatial analysis when they need to derive new data from existing data. In GIS I, for example, you used the vector approach to derive a riparian buffer feature (output polygon) around
Presenting Highway Noise Exposures The Downfall of Contourtionists
 Presenting Highway Noise Exposures The Downfall of Contourtionists Michael A. Staiano, Staiano Engineering, Inc., Rockville, Maryland This article is intended as a cautionary guide to estimating noise
Surveying Prof. Bharat Lohani Indian Institute of Technology, Kanpur. Lecture - 1 Module - 6 Triangulation and Trilateration
 Surveying Prof. Bharat Lohani Indian Institute of Technology, Kanpur Lecture - 1 Module - 6 Triangulation and Trilateration (Refer Slide Time: 00:21) Welcome to this another lecture on basic surveying.
Week 8 Problems. #2 Points possible: 1. Total attempts: 2 Enter your answer rounded to two decimal places.
 Week 8 Problems Name: Neal Nelson Show Scored View # Points possible:. Total attempts: A pilot is flying over a straight highway. He determines the angles of depression to two mileposts,.6 mi apart, to
LATE AND ABSENT HOMEWORK IS ACCEPTED UP TO THE TIME OF THE CHAPTER TEST ON
 Trig/Math Anal Name No LATE AND ABSENT HOMEWORK IS ACCEPTED UP TO THE TIME OF THE CHAPTER TEST ON HW NO. SECTIONS ASSIGNMENT DUE TT 1 1 Practice Set D TT 1 6 TT 1 7 TT TT 1 8 & Application Problems 1 9
AEC Logic. AEC Terrain. A program to manage earth works in a construction project. Yudhishtirudu Gaddipati 29-Jun-13
 AEC Logic AEC Terrain A program to manage earth works in a construction project Yudhishtirudu Gaddipati 29-Jun-13 Contents 1 Introduction:... 5 2 Program Launch... 5 2.1 How to Launch Program... 5 2.2
Purpose: To explore the raster grid and vector map element concepts in GIS.
 GIS INTRODUCTION TO RASTER GRIDS AND VECTOR MAP ELEMENTS c:wou:nssi:vecrasex.wpd Purpose: To explore the raster grid and vector map element concepts in GIS. PART A. RASTER GRID NETWORKS Task A- Examine
Checkpoint 1 Define Trig Functions Solve each right triangle by finding all missing sides and angles, round to four decimal places
 Checkpoint 1 Define Trig Functions Solve each right triangle by finding all missing sides and angles, round to four decimal places. 1.. B P 10 8 Q R A C. Find the measure of A and the length of side a..
Civil 3D Introduction
 Civil 3D Introduction Points Overview Points are data collected by surveyors which represent existing site conditions (elevations, boundaries, utilities, etc.). Each point is numbered (or named) and has
5B.4 ~ Calculating Sine, Cosine, Tangent, Cosecant, Secant and Cotangent WB: Pgs :1-10 Pgs : 1-7
 SECONDARY 2 HONORS ~ UNIT 5B (Similarity, Right Triangle Trigonometry, and Proof) Assignments from your Student Workbook are labeled WB Those from your hardbound Student Resource Book are labeled RB. Do
PHY120 LAB 4 Maps, Landforms, and Google Earth
 PHY120 LAB 4 Maps, Landforms, and Google Earth Sources: en.wikipedia.org Holcombe_conv_and_meas.pdf mrdata.usgs.gov/geology/state/ www.state.nj.us/dep/njgs/geodata/fmsdoc/fmsuser.htm www.geo.utexas.edu/courses/420k/pdf_files/brunton_compass_09.pdf
Local Elevation Surface Modeling using GPS Derived Point Clouds. John G. Whitman, Jr.
 Local Elevation Surface Modeling using GPS Derived Point Clouds WhitmanJ2@myfairpoint.net Study Area Overview Topographic Background NAIP with Roads and Streams Public DEM Models of Study Area National
Digital Elevation Models (DEM)
") Digital Elevation Models (DEM) Digital representation of the terrain surface also referred to as Digital Terrain Models (DTM) Digital Elevation Models (DEM) How has relief depiction changed with digital
Digital Elevation Models (DEM) Digital representation of the terrain surface also referred to as Digital Terrain Models (DTM) Digital Elevation Models (DEM) How has relief depiction changed with digital
fraction of Nyquist
 differentiator 4 2.1.2.3.4.5.6.7.8.9 1 1 1/integrator 5.1.2.3.4.5.6.7.8.9 1 1 gain.5.1.2.3.4.5.6.7.8.9 1 fraction of Nyquist Figure 1. (top) Transfer functions of differential operators (dotted ideal derivative,
GIS LAB 8. Raster Data Applications Watershed Delineation
 GIS LAB 8 Raster Data Applications Watershed Delineation This lab will require you to further your familiarity with raster data structures and the Spatial Analyst. The data for this lab are drawn from
AUTOMATIC EXTRACTION OF TERRAIN SKELETON LINES FROM DIGITAL ELEVATION MODELS
 AUTOMATIC EXTRACTION OF TERRAIN SKELETON LINES FROM DIGITAL ELEVATION MODELS F. Gülgen, T. Gökgöz Yildiz Technical University, Department of Geodetic and Photogrammetric Engineering, 34349 Besiktas Istanbul,
Two-Dimensional Waves
 Two-Dimensional Waves In our previous lessons, we discussed one-dimensional waves waves that can only travel in straight lines, such as along the length of a spring. In this next part of the unit, we will
An object in 3D space
 An object in 3D space An object's viewpoint Every Alice object has a viewpoint. The viewpoint of an object is determined by: The position of the object in 3D space. The orientation of the object relative
SECTION 7.4 THE LAW OF SINES 483. Triangles AjfijC, and A2B2C2 are shown in Figure 9. b = a = EXAMPLE 5 SSA, the No-Solution Case
 SECTION 7.4 THE LAW OF SINES 483 the foothills of the Himalayas. A later expedition, using triangulation, calculated the height of the highest peak of the Himalayas to be 29,002 ft. The peak was named
SURVEYING-II(5 TH CIVIL) CHAPTER-1 Name of the Chapter - Leveling
 CHAPTER-1 Name of the Chapter - Leveling") SURVEYING-II(5 TH CIVIL) CHAPTER-1 Name of the Chapter - Leveling 1. Define parallax. [2012] The apparent movement of image relative to the cross hair is known as parallax. This occurs due to imperfect
SURVEYING-II(5 TH CIVIL) CHAPTER-1 Name of the Chapter - Leveling 1. Define parallax. [2012] The apparent movement of image relative to the cross hair is known as parallax. This occurs due to imperfect
Lab 11: Terrain Analyses
 Lab 11: Terrain Analyses What You ll Learn: Basic terrain analysis functions, including watershed, viewshed, and profile processing. There is a mix of old and new functions used in this lab. We ll explain
5.5 Right Triangles. 1. For an acute angle A in right triangle ABC, the trigonometric functions are as follow:
 5.5 Right Triangles 1. For an acute angle A in right triangle ABC, the trigonometric functions are as follow: sin A = side opposite hypotenuse cos A = side adjacent hypotenuse B tan A = side opposite side
Digital Elevation Model & Surface Analysis
 Topics: Digital Elevation Model & Surface Analysis 1. Introduction 2. Create raster DEM 3. Examine Lidar DEM 4. Deriving secondary surface products 5. Mapping contours 6. Viewshed Analysis 7. Extract elevation
Field-Scale Watershed Analysis
 Conservation Applications of LiDAR Field-Scale Watershed Analysis A Supplemental Exercise for the Hydrologic Applications Module Andy Jenks, University of Minnesota Department of Forest Resources 2013
v TUFLOW-2D Hydrodynamics SMS Tutorials Time minutes Prerequisites Overview Tutorial
 v. 12.2 SMS 12.2 Tutorial TUFLOW-2D Hydrodynamics Objectives This tutorial describes the generation of a TUFLOW project using the SMS interface. This project utilizes only the two dimensional flow calculation
Unit 6 Introduction to Trigonometry
 Lesson 1: Incredibly Useful Ratios Opening Exercise Unit 6 Introduction to Trigonometry Use right triangle ΔABC to answer 1 3. 1. Name the side of the triangle opposite A in two different ways. 2. Name
City of La Crosse Online Mapping Website Help Document
 City of La Crosse Online Mapping Website Help Document This document was created to assist in using the new City of La Crosse online mapping sites. When the website is first opened, a map showing the City
Digital Elevation Models (DEMs)
") Digital Elevation Models (DEM) - Terrain Models (DTM) How has relief depiction on maps and online changed with digital mapping/ GIS?.. Perhaps more than the other map elements / layers Digital Elevation
Digital Elevation Models (DEM) - Terrain Models (DTM) How has relief depiction on maps and online changed with digital mapping/ GIS?.. Perhaps more than the other map elements / layers Digital Elevation
START>PROGRAMS>ARCGIS>
 Department of Urban Studies and Planning Spring 2006 Department of Architecture Site and Urban Systems Planning 11.304J / 4.255J GIS EXERCISE 2 Objectives: To generate the following maps using ArcGIS Software:
v Overview SMS Tutorials Prerequisites Requirements Time Objectives
 v. 12.2 SMS 12.2 Tutorial Overview Objectives This tutorial describes the major components of the SMS interface and gives a brief introduction to the different SMS modules. Ideally, this tutorial should
APPENDIX 13 TERRAIN NAVIGATOR PRO BASICS. Prepared by the Mapping and Marking Committee. Fifth Edition (Revised and Expanded) June 2014
 June 2014") APPENDIX 13 TERRAIN NAVIGATOR PRO BASICS Prepared by the Mapping and Marking Committee Fifth Edition (Revised and Expanded) June 2014 Published by the Oregon-California Trails Association P.O. Box 1019
APPENDIX 13 TERRAIN NAVIGATOR PRO BASICS Prepared by the Mapping and Marking Committee Fifth Edition (Revised and Expanded) June 2014 Published by the Oregon-California Trails Association P.O. Box 1019
30 o. 60 o 1. INSTRUCTIONAL PLAN Day 3
 INSTRUCTIONAL PLAN Day 3 Subject: Trigonometry Topic: Special Right Triangles, Problem Solving and Applications of Right Triangles Target Learners: College Students Objectives: At the end of the lesson,
COMPARISON OF TWO METHODS FOR DERIVING SKELETON LINES OF TERRAIN
 COMPARISON OF TWO METHODS FOR DERIVING SKELETON LINES OF TERRAIN T. Gökgöz, F. Gülgen Yildiz Technical University, Dept. of Geodesy and Photogrammetry Engineering, 34349 Besiktas Istanbul, Turkey (gokgoz,
I CALCULATIONS WITHIN AN ATTRIBUTE TABLE
 Geology & Geophysics REU GPS/GIS 1-day workshop handout #4: Working with data in ArcGIS You will create a raster DEM by interpolating contour data, create a shaded relief image, and pull data out of the
Polygons and Angles: Student Guide
 Polygons and Angles: Student Guide You are going to be using a Sphero to figure out what angle you need the Sphero to move at so that it can draw shapes with straight lines (also called polygons). The
Using a Garmin GPSMap 64s on a Senior Hike. By: Marilyn Warrant March 12, 2018
 Using a Garmin GPSMap 64s on a Senior Hike By: Marilyn Warrant March 12, 2018 Most of these definitions and instructions should also apply to other models of the Garmin GPSMap 64 and GPSMap 62. This document
Improved Applications with SAMB Derived 3 meter DTMs
 Improved Applications with SAMB Derived 3 meter DTMs Evan J Fedorko West Virginia GIS Technical Center 20 April 2005 This report sums up the processes used to create several products from the Lorado 7
Channel Conditions in the Onion Creek Watershed. Integrating High Resolution Elevation Data in Flood Forecasting
 Channel Conditions in the Onion Creek Watershed Integrating High Resolution Elevation Data in Flood Forecasting Lukas Godbout GIS in Water Resources CE394K Fall 2016 Introduction Motivation Flooding is
about touching on a topic and then veering off to talk about something completely unrelated.
 The Tangent Ratio Tangent Ratio, Cotangent Ratio, and Inverse Tangent 8.2 Learning Goals In this lesson, you will: Use the tangent ratio in a right triangle to solve for unknown side lengths. Use the cotangent
Should Contours Be Generated from Lidar Data, and Are Breaklines Required? Lidar data provides the most
 Should Contours Be Generated from Lidar Data, and Are Breaklines Required? Lidar data provides the most accurate and reliable representation of the topography of the earth. As lidar technology advances
ATNS. USING Google EARTH. Version 1
 ATNS USING Google EARTH Version 1 ATNS/HO/Using Google Earth Page 1 25/04/2013 CONTENTS 1. BASIC SETUP 2. NAVIGATING IN GOOGLE EARTH 3. ADDING OBJECTS TO GOOGLE EARTH 4. USER HELP REFERENCES ATNS/HO/Using
GIS Workshop Spring 2016
 1/ 14 GIS Geographic Information System. An integrated collection of computer software and data used to view and manage information about geographic places, analyze spatial relationships, and model spatial
Inverses of Trigonometric. Who uses this? Hikers can use inverse trigonometric functions to navigate in the wilderness. (See Example 3.
 1-4 Inverses of Trigonometric Functions Objectives Evaluate inverse trigonometric functions. Use trigonometric equations and inverse trigonometric functions to solve problems. Vocabulary inverse sine function
BASIC MATHEMATICS FOR CADASTRAL MAPPING
 BASIC MATHEMATICS FOR CADASTRAL MAPPING Chapter 5 2015 Cadastral Mapping Manual 5-1 Introduction Data which a mapper must use to solve problems comes from a myriad of sources both new and old. The general
Public Land Ordinance of May 20, 1785
 Public Land Ordinance of May 20, 1785 Act of May 18, 1796 Act of May 10, 1800 Act of March 26, 1804 Act of February 11, 1805 Principles and Rules continued: Corners of half and quarter sections not marked
Computation of Slope
 Computation of Slope Prepared by David R. Maidment and David Tarboton GIS in Water Resources Class University of Texas at Austin September 2011, Revised December 2011 There are various ways in which slope
Construction of Water Table Maps Using GIS
 Geology 309 Construction of Water Table Maps Using GIS Geographic Information Systems (GIS) provide useful tools that enable easy construction of water table maps. In this exercise you will use lake elevation
Unit 7. Rational Explorations Numbers & their Opposites. Advanced Math 6 Unit 7 Calendar 2/ /27 2/28 3/1
 Unit 7 Rational Explorations Numbers & their Opposites Number Lines Real World Examples Absolute Value Order Rational Numbers Graph on Coordinate Plane Distance on Coordinate Plane Reflect on Coordinate
GIS Tools for Hydrology and Hydraulics
 1 OUTLINE GIS Tools for Hydrology and Hydraulics INTRODUCTION Good afternoon! Welcome and thanks for coming. I once heard GIS described as a high-end Swiss Army knife: lots of tools in one little package
Students interpret the meaning of the point of intersection of two graphs and use analytic tools to find its coordinates.
 Student Outcomes Students interpret the meaning of the point of intersection of two graphs and use analytic tools to find its coordinates. Classwork Example 1 (7 minutes) Have students read the situation
Skills Practice Skills Practice for Lesson 7.1
 Skills Practice Skills Practice for Lesson.1 Name Date Tangent Ratio Tangent Ratio, Cotangent Ratio, and Inverse Tangent Vocabulary Match each description to its corresponding term for triangle EFG. F
Geo, Chap 8 Practice Test, EV Ver 1
 Name: Class: Date: ID: A Geo, Chap 8 Practice Test, EV Ver 1 Short Answer Find the length of the missing side. Leave your answer in simplest radical form. 1. (8-1) 2. (8-1) A grid shows the positions of
Introduction to Trigonometry
 NAME COMMON CORE GEOMETRY- Unit 6 Introduction to Trigonometry DATE PAGE TOPIC HOMEWORK 1/22 2-4 Lesson 1 : Incredibly Useful Ratios Homework Worksheet 1/23 5-6 LESSON 2: Using Trigonometry to find missing
2.1 Derivatives and Rates of Change
 2.1 Derivatives and Rates of Change In this chapter we study a special type of limit, called a derivative, that occurs when we want to find a slope of a tangent line, or a velocity, or any instantaneous
 Cabrillo College Engineering 1A - Surveying LABORATORY NO. 4 --- THEODOLITE: ANGLE ABOUT A POINT Objectives: To measure the angles about a point by repetition using a theodolite. Equipment: Theodolite,
Pre-Calculus Right Triangle Trigonometry Review Name Dec π
 Pre-Calculus Right Triangle Trigonometry Review Name Dec 201 Convert from Radians to Degrees, or Degrees to Radians 7π 1. 0 2.. 1. 11π. Find the si trig functions of θ. If sin θ =, find the other five
LOCATION W140005XQ STUDENT HANDOUT
 UNITED STATES MARINE CORPS THE BASIC SCHOOL MARINE CORPS TRAINING COMMAND CAMP BARRETT, VIRGINIA 22134-5019 LOCATION W140005XQ STUDENT HANDOUT W14005XQ Introduction Importance In This Lesson The class
Geographic Surfaces. David Tenenbaum EEOS 383 UMass Boston
 Geographic Surfaces Up to this point, we have talked about spatial data models that operate in two dimensions How about the rd dimension? Surface the continuous variation in space of a third dimension
Lecture 4: Digital Elevation Models
 Lecture 4: Digital Elevation Models GEOG413/613 Dr. Anthony Jjumba 1 Digital Terrain Modeling Terms: DEM, DTM, DTEM, DSM, DHM not synonyms. The concepts they illustrate are different Digital Terrain Modeling
MODFLOW - Conceptual Model Approach
 GMS 7.0 TUTORIALS MODFLOW - Conceptual Model Approach 1 Introduction Two approaches can be used to construct a MODFLOW simulation in GMS: the grid approach or the conceptual model approach. The grid approach
Exercise One: Creating A Map Of Species Distribution For A Publication
 --- Chapter three --- Exercise One: Creating A Map Of Species Distribution For A Publication One of the first, and most common, tasks you will want to do in using GIS is to produce maps for use in presentations,
Right Triangles CHAPTER. 3.3 Drafting Equipment Properties of 45º 45º 90º Triangles p. 189
 CHAPTER Right Triangles Hiking is the most popular outdoor activity in the United States, with almost 40% of Americans hiking every year. Hikers should track their location and movements on a map so they
1. NJDEP Landscape 3.3 Viewer Interface
 Using the Landscape Project through NJDEP Landscape 3.3 Viewer Google Chrome or Mozilla Firefox are recommended for the use of this app. Navigate to the NJDEP-DFW s Landscape Project web page at www.njfishandwildlife.com/ensp/landscape/
Ch 8: Right Triangles and Trigonometry 8-1 The Pythagorean Theorem and Its Converse 8-2 Special Right Triangles 8-3 The Tangent Ratio
 Ch 8: Right Triangles and Trigonometry 8-1 The Pythagorean Theorem and Its Converse 8- Special Right Triangles 8-3 The Tangent Ratio 8-1: The Pythagorean Theorem and Its Converse Focused Learning Target:
STUDENT PAGES GIS Tutorial Treasure in the Treasure State
 STUDENT PAGES GIS Tutorial Treasure in the Treasure State Copyright 2015 Bear Trust International GIS Tutorial 1 Exercise 1: Make a Hand Drawn Map of the School Yard and Playground Your teacher will provide
Lab 1- Introduction to Motion
 Partner : Purpose Partner 2: Lab - Section: The purpose of this lab is to learn via a motion detector the relationship between position and velocity. Remember that this device measures the position of
Lecture 21 - Chapter 8 (Raster Analysis, part2)
") GEOL 452/552 - GIS for Geoscientists I Lecture 21 - Chapter 8 (Raster Analysis, part2) Today: Digital Elevation Models (DEMs), Topographic functions (surface analysis): slope, aspect hillshade, viewshed,
GEOL 452/552 - GIS for Geoscientists I Lecture 21 - Chapter 8 (Raster Analysis, part2) Today: Digital Elevation Models (DEMs), Topographic functions (surface analysis): slope, aspect hillshade, viewshed,
Fractions and decimals have opposites, just as integers do. For example, 5 8 and 2 5
 Domain 1 Lesson Rational Numbers Common Core Standards: 6.NS., 6.NS.6.c, 6.NS.7.c Getting the Idea A rational number is a number that can be expressed as the ratio of two integers in the form a, where
Position vs Time Graphs *
 OpenStax-CNX module: m54110 1 Position vs Time Graphs * OpenStax HS Physics This work is produced by OpenStax-CNX and licensed under the Creative Commons Attribution License 4.0 1 : By the end of this
Types of obstacles in chain Surveying
 Types of obstacles in chain Surveying http://wikienvironment.org Types of obstacles in chain Surveying and Solutions of obstacles in chain Surveying: Sometimes it will be observed that many obstructions
Final project: Lecture 21 - Chapter 8 (Raster Analysis, part2) GEOL 452/552 - GIS for Geoscientists I
 GEOL 452/552 - GIS for Geoscientists I") GEOL 452/552 - GIS for Geoscientists I Lecture 21 - Chapter 8 (Raster Analysis, part2) Talk about class project (copy follow_along_data\ch8a_class_ex into U:\ArcGIS\ if needed) Catch up with lecture 20
GEOL 452/552 - GIS for Geoscientists I Lecture 21 - Chapter 8 (Raster Analysis, part2) Talk about class project (copy follow_along_data\ch8a_class_ex into U:\ArcGIS\ if needed) Catch up with lecture 20
Chapter 2 Surfer Tutorial
 Chapter 2 Surfer Tutorial Overview This tutorial introduces you to some of Surfer s features and shows you the steps to take to produce maps. In addition, the tutorial will help previous Surfer users learn
Lab 11: Terrain Analyses
 Lab 11: Terrain Analyses What You ll Learn: Basic terrain analysis functions, including watershed, viewshed, and profile processing. There is a mix of old and new functions used in this lab. We ll explain
GeoWeb Portal. User Manual
 GeoWeb Portal User Manual Purpose The GeoWeb Portal (GWP) is a map viewing and publishing site. It is designed to allow people to build their own maps and review the data that is attached to the elements
Modeling with 3D Polygons, Slabs, and Blocks
 Modeling with 3D Polygons, Slabs, and Blocks DataCAD s 3D polygons, slabs and blocks are closely related entities with a few important differences. A 3D polygon is a single entity with no thickness (unlike
Unit 5 Day 7. Quiz Day
 Unit 5 Day 7 Quiz Day Homework Information Add this to your outline!! Packet Pages 15-16 - Practice from Day 1 Classifying Triangles (notes on notebook paper) Finish Notes p. 14-15 & Print Next Packet
Appendix E. HEC-RAS and HEC-Ecosystem Functions Models
 Appendix E HEC-RAS and HEC-Ecosystem Functions Models 1 Appendix E: Modeled Reaches for the Connecticut River Watershed application of HEC-RAS Separate from the report for the Decision Support System of
Introduction to Geospatial Analysis
 Introduction to Geospatial Analysis Introduction to Geospatial Analysis 1 Descriptive Statistics Descriptive statistics. 2 What and Why? Descriptive Statistics Quantitative description of data Why? Allow