Data products. Dario Fadda (USRA) Pipeline team Bill Vacca Melanie Clarke Dario Fadda
|
|
|
- Benedict Branden Lynch
- 6 years ago
- Views:
Transcription

1 Data products Dario Fadda (USRA) Pipeline team Bill Vacca Melanie Clarke Dario Fadda

2 Pipeline (levels 1 à 2) The pipeline consists in a sequence of modules. For each module, files are created and read in the subsequent module. The raw files are retrievable as Level 1. Many intermediate level 2 products from the first part of the pipeline are not conserved in the archive.

.")
3 Fi7ng ramps Ramps are fitted to estimate the flux on the detectors. The pipeline uses a robust fit and excludes all saturated points from the fit to provide good estimates also for high flux observations. Non-linearity is negligible (less than 1%). Saturated readouts
4 Pipeline (levels 1 à 2) Once grating positions are translated into wavelengths and WCS is assigned to the FITS files, the data are flat-fielded and different grating scans are combined to obtain a series of spectra. This results in the level 2 product in the archive which has the acronym SCM (for scan combined) in their names.

5 Wavelength calibra=on Mars spectrum (black) vs ATRAN (red) Each of the 25 spaxels has its own wavelength calibration for the 16 spectral pixels. The wavelength calibration is good to 15% of a resolution element. Each pixel has its own spectral width. This is taken into account when combining the different scans into a common wavelength grid.
6 Spa=al calibra=on Figure 8: Average fitted spaxel positions in telescope simulator coordinates (red and Spaxels are not on a regular grid. The relative sky position of each pixel is computed and stored. WCS for each cube is computed from dither offsets and reference position. The final cube has N up and E left.
7 Flat fields Flat fields are 5 x 5 x 16 cubes computed in the lab for several key grating positions. For other cases, interpolated values are used. We are in the process of computing flat fields from flight data. These new flats will be used in an upcoming data release.
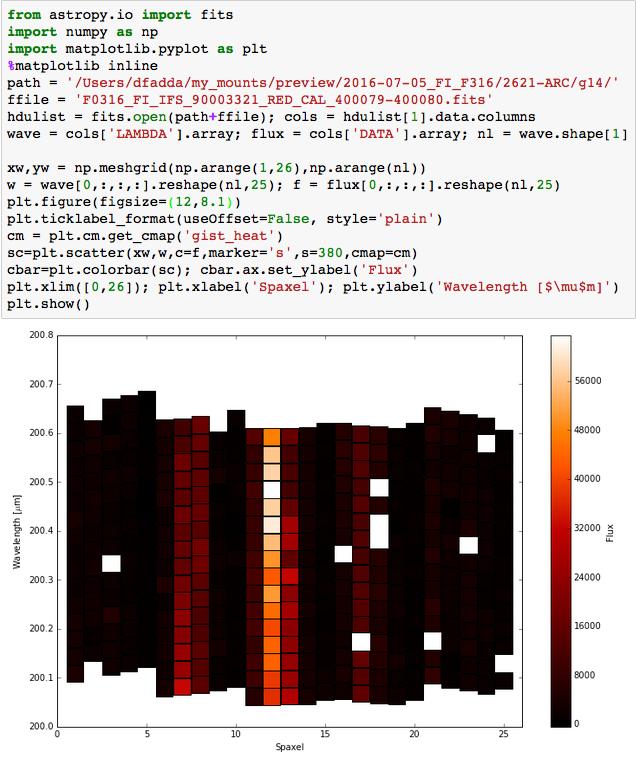
8 SCM files Level 2 data are conserved as several 5x5xN λ cubes.


9 Pipeline (levels 2 à 3) At this point, each file is corrected for atmospheric transmission and flux calibration is applied. The resulting Level 3 products have the letters CAL (for calibrated) in their names.


10 Telluric correc=on Overcorrections A correction is applied to all the data with transmission greater than 60%. Below this value, data are blanked. The correction assumes a standard PWV value, since the real one is not yet measured. You can generate models of atmospheric transmission with ATRAN: To allow the GIs to use the data below this threshold, the final cube has a extension with uncorrected data. A transmission correction should be applied to this data to get useful fluxes.
 and obtaining something not")


11 Telluric correc=on Non existing features We can correct the flux by using a lower water vapor value (5 for instance) and obtaining something not overcorrected. Note that some ATRAN features do not appear in the observed data. So, it s a good precaution to plot the spectrum against the atmospheric transmission. Spikes in the spectrum are edge effects of the wavelength interpolation between adjacent pieces of different spectroscopic observations.
12 Flux calibra=on Based on Mars observation and theoretical spectrum by Lellouch & Amri from 60 μm to 300 μm, extended to 40 μm with black-body curve. Response derived for each combination of filter/orders and dichroics. Comparison with previous observations shows accuracy of 20%. This can be improved with knowledge of the PWV.
13 CAL files The calibrated files contain the median atmospheric transmission and response used as well as the data uncorrected for atmospheric absorption.
14

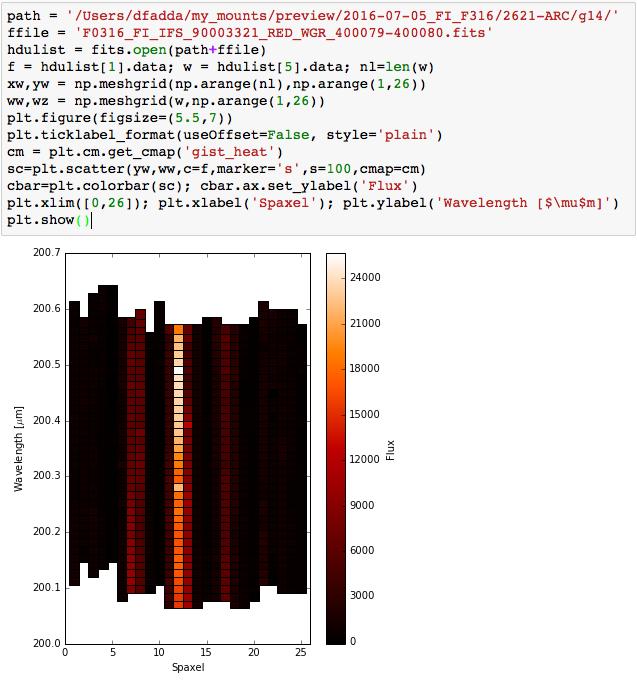
15 Pipeline (levels 2 à 3) The calibrated files are now resampled into a regular wavelength grid and each wavelength plane is projected into a rectilinear spatial grid. The files with WGR in their names (for wavelength grid) contain cubes after wavelength resampling.

16 WGR files Starting from WGR files, each extension contain different data. Data are, in this case, re-gridded along 56 wavelength values for each of the 25 spaxels. There are now only 25 positions.
17
 in their names.")
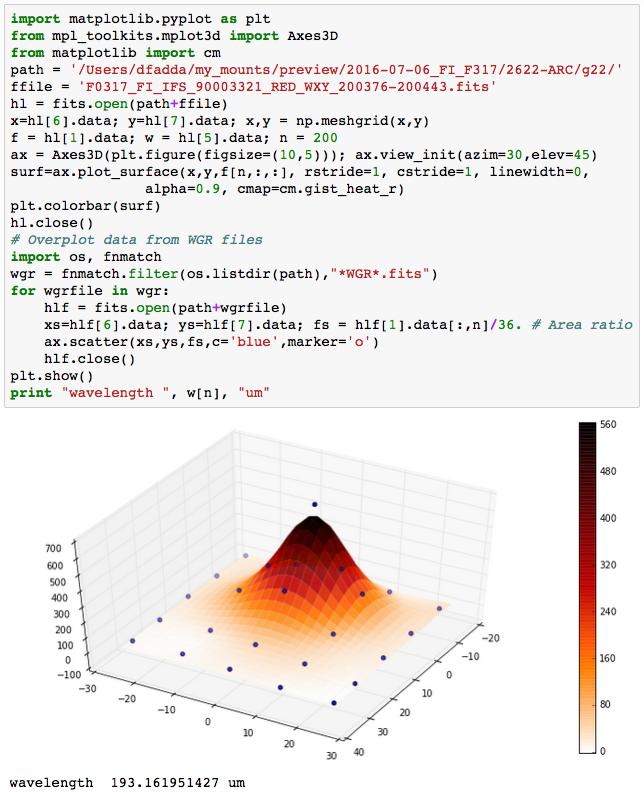
18 Pipeline (levels 3 à 4) The final step consists in obtaining a cube with regular spatial grid over which all the data are coadded. The final cube is conserved with the acronym WXY (for wavelength & spatial rebinned) in their names. Two methods for spatial resampling can be used: Interpolation (using IDL radial basis functions) Local polynomial fitting In the archive usually the default method is fitting. In case of undithered observations we manually process data using interpolation.

19 WXY file Finally, all the WGR files are combined in a single cube which spatial size depends on the observation. Default pixel sizes are 1 and 2 sq. arcsec., for the blue and red arrays, respectively.
20
21 Mul=-mission grouping In the case an observation is performed across several flights, data are first processed for each single flight and then combined at the last step of the pipeline. The grouping is done using the keyword FILEGPID which is assigned manually before processing the data. G.I. will find sometimes data of nearby observations grouped in a single final cube if the spatial and wavelength overlap is significant. If this grouping is not desirable for science (such is the case of repeated observations to detect variability) the G.I. should contact the SOFIA Science Center to split the data in multiple final cubes.
22 Interac=ng with the pipeline Several interactive passages are done during the reduction: Exclude files which are of low quality (e.g. bad atmospheric transmission) Group files from different missions (FileGpID keyword) Change the threshold to reject bad ramp fits Use simple interpolation for the final spatial projection (typically with staring observation) Change the kernel width of the surface fitting for the spatial projection (in case of highly concentrated sources) Typically these choices are done during the QA. It is nevertheless useful to know about these possibilities in case the G.I. notice something strange in their data.
23 Caveat A laundry list of possible problems: u Telluric lines: NaNs and overcorrections u Spatial resampling interpolation vs polynomial fit u Negative continuum (bad reference position) u Bad flats u Ghosts for bright objects
24 Telluric correc=on In the corrected data lines can be cut short because the absorption becomes important (transmission < 60%). In this cases, we can use the uncorrected flux after correcting it with a lower transmission threshold.
25 Telluric correc=on In this case we recomputed the transmission using ATRAN and values in the file header: RESOLUN, LAT_STA, LAT_END, ZA_START, ZA_END. Better statistics for these keywords can be obtained from the WGR files. We put the threshold to 40% to recover more of the line, be able to fit it, and estimate a flux. Note that the correction works only approximately in case of unresolved/narrow features.
26 PiOalls of spa=al resampling The last step of the pipeline which involves spatial resampling and coaddition of the data is the most critical one. In the pipeline there are two methods: Fit a 2D local surface fitting with a 2 nd degree polynomial weighted using flux errors. Interpolation spatial interpolation on a regular grid and coaddition with IDL code griddata using radial basis function. Fitting usually provides smoother images. Since the smoothing kernel is fixed, the result depends on the choice of the kernel and the weighting of the data. The interpolation, on the other hand, weights all the data in the same way. The default values for fitting are generally correct. However, in the case of very concentrated sources, the pipeline can oversmooth. We recently modified the pipeline (vers 1.3.2) to not propagate the response errors into the weights. This was causing the high flux points to be neglected since they had very low weights associated. It is advisable to check your data against pre-projected data (WGR files) to know if the final flux estimate is reliable.
. Slice at 88.5 um.")
27 Interpola=on (Python) Resampling of WGR data (dots) using Python scipy libraries: scipy.interpolate.rbf (radial basis functions with minimal smoothing). Slice at 88.5 um. Total flux is: 1116

28 Interpola=on (IDL) Resampling of WGR data (dots) using the FIFI-LS pipeline: IDL interpolation with radial basis functions Slice at 88.5 um. Total flux is: 1078
 Slice at 88.5 um.")
29 Polynomial fit (default) Interpolation of WGR data (dots) using the FIFI-LS pipeline 1.3.1: polynomial 2D fit smoothing kernel = 2xFWHM (default) Slice at 88.5 um. Total flux is: 555
 Resampling of WGR data (dots)")

30 Polynomial fit ( manual) Resampling of WGR data (dots) using the FIFI-LS pipeline: polynomial 2D fit with smoothing kernel = 1 x FWHM Slice at 88.5 um. Total flux is: 1037

31 Polynomial fit (default) Resampling of WGR data (dots) using the FIFI-LS pipeline 1.3.2: polynomial 2D fit smoothing kernel = 2xFWHM (default) Slice at 88.5 um. Total flux is: 1043
 Resampling of WGR data (dots) using the FIFI-LS pipeline: polynomial 2D")
32 Polynomial fit (manual) Resampling of WGR data (dots) using the FIFI-LS pipeline: polynomial 2D fit smoothing kernel = 1 x FWHM Slice at 88.5 um. Total flux is: 1040
 in Python. Slice at 88.5 um.")
33 2D Gaussian fit 2D Gaussian fit of WGR data (dots) in Python. Slice at 88.5 um. Total flux is: 889
34 Spa=al resampling summary In this particular case we have seen that the default pipeline result could be significantly wrong. In particular, if we normalize all the fluxes to the best fit done in Python with Radial Basis Functions, we have: Pipeline (IDL) interpolation Pipeline Ait (default) Pipeline Ait (narrower kernel) Pipeline Ait (default) Pipeline Ait (narrower kernel) 2D Gaussian Ait 97.0% 50.0% 93.3% 93.9% 93.6% 80.0% In general the pipeline interpolation gives good flux estimates and it has been used for calibration. Nice smooth maps are produced with polynomial fitting, although caution should be used for flux estimates in the case of peaked sources done with the pipeline

35 Poorly dithered data Simple interpolation is preferable is the case of data with very little dithering. There is very little advantage in smoothing data without redundancy. Since interpolation does only local smoothing, it is possible to better see defects in the reduction. In this image we can see a raster scan with single redundancy reduced with interpolation. Residuals from flats are clearly visible. Also, the image shows clearly that there is no overlap between parallel scans.

36 Bad chopping Negative values of the continuum indicate an unlucky choice of the reference chopping position. Bad chop here


, ghosts")


37 Ghosts Ghosts of Mars In presence of bright sources (Mars in this example at 130μm), ghosts can appear in the image. On the right, single pointings with the ghost.

38 Ghosts In the single pointing the ghost accounts for 20% of the total flux. In the final image each ghost contribute approximately 10% of the total flux. Ghosts are taken into account for calibration.
39 What s next? We just archived products from pipeline version which includes flux calibration and telluric corrections We will reprocess the data starting next week with version to get better spatial resampling We are currently analyzing a wealth of data taking during several flights with the scope of computing in-flight flats. For the moment we have produced: A new set of bad pixel masks for each flight series A study of the saturation point of the detectors An estimate of non-linearity of the detectors We are currently working on defining new flats. Since during the last flight series flats have sensibly changed, this will lead to a new reprocessing and data release early next year.
FIFI-LS: Basic Cube Analysis using SOSPEX
 FIFI-LS: Basic Cube Analysis using SOSPEX Date: 1 Oct 2018 Revision: - CONTENTS 1 INTRODUCTION... 1 2 INGREDIENTS... 1 3 INSPECTING THE CUBE... 3 4 COMPARING TO A REFERENCE IMAGE... 5 5 REFERENCE VELOCITY
Data Processing Status
 Data Processing Status William Vacca Assoc. Director, Science Data Systems USRA-SOFIA SOFIA Users Group Meeting #10 November 2016 SOFIA Pipeline Products Defined in the Data Processing Plan for SOFIA SIs
VERY LARGE TELESCOPE 3D Visualization Tool Cookbook
 European Organisation for Astronomical Research in the Southern Hemisphere VERY LARGE TELESCOPE 3D Visualization Tool Cookbook VLT-SPE-ESO-19500-5652 Issue 1.0 10 July 2012 Prepared: Mark Westmoquette
PACS SPECTROMETER SPATIAL CALIBRATION
 PACS SPECTROMETER SPATIAL CALIBRATION A. Contursi Herschel Calibration workshop 18-20 January ESAC Spatial Calibration Observations summary 40x40 chopped raster at chopper position 0 on Neptune, step size
esac PACS Spectrometer: forward model tool for science use
 esac European Space Astronomy Centre (ESAC) P.O. Box, 78 28691 Villanueva de la Cañada, Madrid Spain PACS Spectrometer: forward model tool for science use Prepared by Elena Puga Reference HERSCHEL-HSC-TN-2131
The Italian LBT spectroscopic data reduction pipeline
 LBTO 2017 Users' Meeting The Italian LBT spectroscopic data reduction pipeline Alida Marchetti INAF-IASF Milano Firenze, June 20th-23rd reduction pipeline SOME NUMBERS INAF nights 46 Effective observing
JWST Pipeline & Data Products
 JWST Pipeline & Data Products Stage 1: Ramps-to-Slopes Karl D. Gordon JWST Calibration WG Lead Space Telescope Sci. Inst. Baltimore, MD, USA Stage 2: Calibrated Slopes Stage 3: Ensemble Processing 18 May
PACS Spectrometer Simulation and the Extended to Point Correction
 PACS Spectrometer Simulation and the Extended to Point Correction Jeroen de Jong February 11, 2016 Abstract This technical note describes simulating a PACS observation with a model source and its application
JWST Pipeline & Data Products
 JWST Pipeline & Data Products Stage 1: Ramps-to-Slopes Karl D. Gordon JWST Calibration WG Lead Space Telescope Sci. Inst. Baltimore, MD, USA Stage 2: Calibrated Slopes Stage 3: Ensemble Processing Star
MRO CRISM TRR3 Hyperspectral Data Filtering
 MRO CRISM TRR3 Hyperspectral Data Filtering CRISM Data User's Workshop 03/18/12 F. Seelos, CRISM SOC CRISM PDS-Delivered VNIR TRR3 I/F 3-Panel Plot False Color RGB Composite Composite band distribution
PACS Data Reduction Guide: Spectroscopy. Issue user Version 15.0 March 2017
 PACS Data Reduction Guide: Spectroscopy Issue user Version 15.0 March 2017 PACS Data Reduction Guide: Spectroscopy Table of Contents 1. PACS Spectroscopy Launch Pad I... 1 1.1. Introduction... 1 1.1.1.
Document Number: SC2/FTS/SOF/020
 SCUBA-2 FTS Project Office University of Lethbridge Physics Department 4401 University Drive Lethbridge, Alberta CANADA T1K 3M4 Tel: 1-403-329-2771 Fax: 1-403-329-2057 Email: brad.gom@uleth.ca WWW: http://research.uleth.ca/scuba2/
CanariCam: Polarimetry & Data Reduction
 Acknowledgements CanariCam: Polarimetry & Data Reduction Chris Packham, Charlie Telesco & The CanariCam Team University of Florida Text heavily drawn from Polpack Starlink manual by Berry & Gledhill Longevity
WSDC Subsystem Peer Review
 WSDC Subsystem Peer Review Multiband DETector () Ken Marsh (IPAC/Caltech) 1 Outline Relationship of to other WSDS pipeline modules Why multiband? Theoretical basis Procedure - Steps involved - Allowance
Interactive comment on Quantification and mitigation of the impact of scene inhomogeneity on Sentinel-4 UVN UV-VIS retrievals by S. Noël et al.
 Atmos. Meas. Tech. Discuss., www.atmos-meas-tech-discuss.net/5/c741/2012/ Author(s) 2012. This work is distributed under the Creative Commons Attribute 3.0 License. Atmospheric Measurement Techniques Discussions
Interactive comment on Quantification and mitigation of the impact of scene inhomogeneity on Sentinel-4 UVN UV-VIS retrievals by S. Noël et al.
 Atmos. Meas. Tech. Discuss., 5, C741 C750, 2012 www.atmos-meas-tech-discuss.net/5/c741/2012/ Author(s) 2012. This work is distributed under the Creative Commons Attribute 3.0 License. Atmospheric Measurement
CRISM (Compact Reconnaissance Imaging Spectrometer for Mars) on MRO. Calibration Upgrade, version 2 to 3
 on MRO. Calibration Upgrade, version 2 to 3") CRISM (Compact Reconnaissance Imaging Spectrometer for Mars) on MRO Calibration Upgrade, version 2 to 3 Dave Humm Applied Physics Laboratory, Laurel, MD 20723 18 March 2012 1 Calibration Overview 2 Simplified
CRISM (Compact Reconnaissance Imaging Spectrometer for Mars) on MRO Calibration Upgrade, version 2 to 3 Dave Humm Applied Physics Laboratory, Laurel, MD 20723 18 March 2012 1 Calibration Overview 2 Simplified
Simple Spectrograph. grating. slit. camera lens. collimator. primary
 Simple Spectrograph slit grating camera lens collimator primary Notes: 1) For ease of sketching, this shows a transmissive system (refracting telescope, transmission grating). Most telescopes use a reflecting
Spectroscopy techniques II. Danny Steeghs
 Spectroscopy techniques II Danny Steeghs Conducting long-slit spectroscopy Science goals must come first, what are the resolution and S/N requirements? Is there a restriction on exposure time? Decide on
X shooter pipeline reduc1ons. In 7 (x3) easy steps
 easy steps") X shooter pipeline reduc1ons In 7 (x3) easy steps Cascade X shooter headers, tools Example Run chain(vis) Overview Differences VIS/UVB/NIR chains Examples Outputs Observing strategy : To nod or not to
X shooter pipeline reduc1ons In 7 (x3) easy steps Cascade X shooter headers, tools Example Run chain(vis) Overview Differences VIS/UVB/NIR chains Examples Outputs Observing strategy : To nod or not to
Visualization & the CASA Viewer
 Visualization & the Viewer Juergen Ott & the team Atacama Large Millimeter/submillimeter Array Expanded Very Large Array Robert C. Byrd Green Bank Telescope Very Long Baseline Array Visualization Goals:
PACS Data Reduction Guide. issue: user, Version: 9 Nov 2011
 PACS Data Reduction Guide issue: user, Version: 9 Nov 2011 PACS Data Reduction Guide Table of Contents 1. PACS Launch Pads... 1 1.1. Introduction... 1 1.2. PACS Data Launch Pad... 1 1.2.1. A quick on terminology...
PACS Data Reduction Guide: Spectroscopy. Issue user. Version 13.0 Mar 2015
 PACS Data Reduction Guide: Spectroscopy Issue user. Version 13.0 Mar 2015 PACS Data Reduction Guide: Spectroscopy Table of Contents 1. PACS Spectroscopy Launch Pad I... 1 1.1. Introduction... 1 1.1.1.
Imaging and Deconvolution
 Imaging and Deconvolution Urvashi Rau National Radio Astronomy Observatory, Socorro, NM, USA The van-cittert Zernike theorem Ei E V ij u, v = I l, m e sky j 2 i ul vm dldm 2D Fourier transform : Image
PACS Launchpad: Spectroscopy
 PACS Launchpad: Spectroscopy Katrina Exter HERSCHEL-HSC-DOC-2168 V1.1 27 April 2017 Build 15.0.3262 Chapter 1. PACS Spectroscopy Launch Pad I 1.1. Introduction Welcome to the PACS data reduction guide
zap Documentation Release 1.0.dev86 Kurt Soto
 zap Documentation Release 1.0.dev86 Kurt Soto February 03, 2016 Contents 1 Installation 3 1.1 Requirements............................................... 3 1.2 Steps...................................................
NHSC/PACS Web Tutorials Running PACS spectrometer pipelines
 NHSC/PACS s Running PACS spectrometer pipelines PACS- 302 Level 1 to Level 2 and beyond: From Sliced Cubes to Rebinned and Projected Spectral Line Cubes, and 1- D Spectra Original Tutorial by Philip Appleton
Cosmic Origins Spectrograph: On-Orbit Performance of Target Acquisitions
 The 2010 STScI Calibration Workshop Space Telescope Science Institute, 2010 Susana Deustua and Cristina Oliveira, eds. Cosmic Origins Spectrograph: On-Orbit Performance of Target Acquisitions Steven V.
From multiple images to catalogs
 Lecture 14 From multiple images to catalogs Image reconstruction Optimal co-addition Sampling-reconstruction-resampling Resolving faint galaxies Automated object detection Photometric catalogs Deep CCD
ADC Figure of Merit. Introduction:
 ADC Figure of Merit Introduction: The improved performance LRIS in spectroscopic mode with the ADC (over the no-adc case) has many factors. Concentrating solely on spectral throughput, those factors that
arxiv: v1 [astro-ph.im] 2 May 2018
![arxiv: v1 [astro-ph.im] 2 May 2018](/thumbs/78/78258339.jpg "arxiv: v1 [astro-ph.im] 2 May 2018") Research in Astronomy and Astrophysics manuscript no. (L A TEX: ms-raa-- R.tex; printed on May, ; :) arxiv:.v [astro-ph.im] May Investigating the Efficiency of the Beijing Faint Object Spectrograph and
Research in Astronomy and Astrophysics manuscript no. (L A TEX: ms-raa-- R.tex; printed on May, ; :) arxiv:.v [astro-ph.im] May Investigating the Efficiency of the Beijing Faint Object Spectrograph and
NIFS Data Reduction. Richard McDermid. Gemini Data Reduction Workshop Tucson, July 2010
 NIFS Data Reduction Richard McDermid Gemini Data Reduction Workshop Tucson, July 2010 NIFS Spaxel IFU Techniques: Image Slicer MIRI - JWST Pros: Compact design High throughput Easy cryogenics Cons: Difficult
Spectral Extraction of Extended Sources Using Wavelet Interpolation
 The 2005 HST Calibration Workshop Space Telescope Science Institute, 2005 A. M. Koekemoer, P. Goudfrooij, and L. L. Dressel, eds. Spectral Extraction of Extended Sources Using Wavelet Interpolation Paul
IRAM mm-interferometry School UV Plane Analysis. IRAM Grenoble
 IRAM mm-interferometry School 2004 1 UV Plane Analysis Frédéric Gueth IRAM Grenoble UV Plane analysis 2 UV Plane analysis The data are now calibrated as best as we can Caution: data are calibrated, but
1 Overview. MEMORANDUM November 4, 2015
 MIT Kavli Institute Chandra X-Ray Center MEMORANDUM November 4, 2015 To: File From: David P. Huenemoerder, Glenn E. Allen Subject: Description of enhancements to HETG/ACIS CC-mode processing Revision:
PACS Products Explained
 PACS Products Explained Katrina Exter Zoltan Balog Issue User. Version 1.0 --> Mar 2015 PACS Products Explained Katrina Exter Zoltan Balog Build 13.0.5130 Build 13.0.5130 Table of Contents 1. Introduction...
Overview of Post-BCD Processing
 Overview of Post-BCD Processing Version 1.1 Release Date: January 7, 2004 Issued by the Spitzer Science Center California Institute of Technology Mail Code 314-6 1200 E. California Blvd Pasadena, California
NHSC/PACS Web Tutorials Running PACS spectrometer pipelines
 NHSC/PACS s Running PACS spectrometer pipelines PACS- 302 Level 1 to Level 2 and beyond: From Sliced Cubes to Rebinned and Projected Spectral Line Cubes, and 1- D Spectra Original Tutorial by Philip Appleton
IRAM Memo Introducing Associated Arrays in CLASS
 IRAM Memo 2015-4 Introducing Associated Arrays in CLASS S. Bardeau 1, J. Pety 1,2 1. IRAM (Grenoble) 2. Observatoire de Paris January, 28 th 2016 Version 1.0 Abstract The concept of Associated Arrays is
Summary of Publicly Released CIPS Data Versions.
 Summary of Publicly Released CIPS Data Versions. Last Updated 13 May 2012 V3.11 - Baseline data version, available before July 2008 All CIPS V3.X data versions followed the data processing flow and data
ALMA REMOTE MINING EXPERIMENT ARTEMIX. Yaye Awa Ba, Philippe. Salomé, Michel. Caillat (LERMA) with credits to : L. Loria, N.
 with credits to : L. Loria, N.") ALMA REMOTE MINING EXPERIMENT Yaye Awa Ba, Philippe. Salomé, Michel. Caillat (LERMA) with credits to : L. Loria, N. Kasradze Archive and Data Mining Goals (i) Search by products not by instrumental configuration
ALMA REMOTE MINING EXPERIMENT Yaye Awa Ba, Philippe. Salomé, Michel. Caillat (LERMA) with credits to : L. Loria, N. Kasradze Archive and Data Mining Goals (i) Search by products not by instrumental configuration
Low Resolu+on Op+cal Spectroscopy. Tom Matheson
 Low Resolu+on Op+cal Spectroscopy Tom Matheson How to get from here To here: Why Spectroscopy? Composi+on/abundances Velocity (radial, dispersion, rota+on curves) Temperature Excita+on mechanisms Density/pressure
Introduction to Image Processing and Analysis. Applications Scientist Nanotechnology Measurements Division Materials Science Solutions Unit
 Introduction to Image Processing and Analysis Gilbert Min Ph D Gilbert Min, Ph.D. Applications Scientist Nanotechnology Measurements Division Materials Science Solutions Unit Working with SPM Image Files
PINGSoft 2: an IDL Integral Field Spectroscopy Software
 arxiv:1211.0277v1 [astro-ph.im] 1 Nov 2012 PINGSoft 2: an IDL Integral Field Spectroscopy Software F. Fabián Rosales-Ortega Departamento de Física Teórica, Universidad Autónoma de Madrid, Spain Instituto
Working with M 3 Data. Jeff Nettles M 3 Data Tutorial at AGU December 13, 2010
 Working with M 3 Data Jeff Nettles M 3 Data Tutorial at AGU December 13, 2010 For Reference Slides and example data from today s workshop available at http://m3dataquest.jpl.nasa.gov See Green et al. (2010)
ALMA Memo 386 ALMA+ACA Simulation Tool J. Pety, F. Gueth, S. Guilloteau IRAM, Institut de Radio Astronomie Millimétrique 300 rue de la Piscine, F-3840
 ALMA Memo 386 ALMA+ACA Simulation Tool J. Pety, F. Gueth, S. Guilloteau IRAM, Institut de Radio Astronomie Millimétrique 300 rue de la Piscine, F-38406 Saint Martin d'h eres August 13, 2001 Abstract This
ASKAP Pipeline processing and simulations. Dr Matthew Whiting ASKAP Computing, CSIRO May 5th, 2010
 ASKAP Pipeline processing and simulations Dr Matthew Whiting ASKAP Computing, CSIRO May 5th, 2010 ASKAP Computing Team Members Team members Marsfield: Tim Cornwell, Ben Humphreys, Juan Carlos Guzman, Malte
Diffraction gratings. e.g., CDs and DVDs
 Diffraction gratings e.g., CDs and DVDs Diffraction gratings Constructive interference where: sinθ = m*λ / d (If d > λ) Single-slit diffraction 1.22 * λ / d Grating, plus order-sorting filters on detector
Software tools for ACS: Geometrical Issues and Overall Software Tool Development
 Software tools for ACS: Geometrical Issues and Overall Software Tool Development W.B. Sparks, R. Jedrzejewski, M. Clampin, R.C. Bohlin. June 8, 2000 ABSTRACT We describe the issues relating to internal
Hyperspectral Remote Sensing
 Hyperspectral Remote Sensing Multi-spectral: Several comparatively wide spectral bands Hyperspectral: Many (could be hundreds) very narrow spectral bands GEOG 4110/5100 30 AVIRIS: Airborne Visible/Infrared
Simulation and Auxiliary Data Management
 Simulation and Auxiliary Data Management Paola Sartoretti GEPI Meudon Simulation/Test and Auxiliary data! Test data are the simulated RVS data needed to test the data reduction algorithms. They are produced
Single-epoch Measurement Algorithms Robert Lupton Applications Lead
 Single-epoch Measurement Algorithms Robert Lupton Applications Lead 2013-09-19 CDP FINAL DESIGN REVIEW September 19-20, 2013 Name of Mee)ng Loca)on Date - Change in Slide Master 1 Outline Single-epoch
Spatial Interpolation & Geostatistics
 (Z i Z j ) 2 / 2 Spatial Interpolation & Geostatistics Lag Lag Mean Distance between pairs of points 1 Tobler s Law All places are related, but nearby places are related more than distant places Corollary:
The STScI STIS Pipeline VII: Extraction of 1-D Spectra
 STIS Instrument Science Report 97-02 The STScI STIS Pipeline VII: Extraction of 1-D Spectra Steve Hulbert, Phil Hodge, and Ivo Busko February 1997 ABSTRACT This report discusses the extraction of 1-D spectra
Progress Report. Ian Evans On behalf of the Chandra Source Catalog Project Team. Chandra Users Committee Meeting October 25, 2010
 Progress Report Ian Evans On behalf of the Chandra Source Catalog Project Team Chandra Users Committee Meeting October 25, 2010 Executive Summary Summary Catalog version 1.1 was released on 2010 Aug 10
PERFORMANCE REPORT ESTEC. The spectral calibration of JWST/NIRSpec: accuracy of the instrument model for the ISIM-CV3 test cycle
 ESTEC European Space Research and Technology Centre Keplerlaan 1 2201 AZ Noordwijk The Netherlands www.esa.int PERFORMANCE REPORT The spectral calibration of JWST/NIRSpec: accuracy of the instrument model
Deconvolution and Imaging ASTR 240: In-class activity, April 1, 2013
 Deconvolution and Imaging ASTR 240: In-class activity, April 1, 2013 In this activity, we will use calibrated visibilities from the Submillimeter Array to create an image of a disk around a nearby young
EECS490: Digital Image Processing. Lecture #19
 Lecture #19 Shading and texture analysis using morphology Gray scale reconstruction Basic image segmentation: edges v. regions Point and line locators, edge types and noise Edge operators: LoG, DoG, Canny
PACS Data Reduction Guide: Photometry. Issue user. Version 10 Apr. 2012
 PACS Data Reduction Guide: Photometry Issue user. Version 10 Apr. 2012 PACS Data Reduction Guide: Photometry Table of Contents 1. PACS Launch Pads... 1 1.1. Introduction... 1 1.2. PACS Data Launch Pad...
MEGARA ONLINE ETC (v1.0.0) QUICK START AND REFERENCES GUIDE by Alexandre Y. K. Bouquin (updated June2017)
 QUICK START AND REFERENCES GUIDE by Alexandre Y. K. Bouquin (updated June2017)") MEGARA ONLINE ETC (v1.0.0) QUICK START AND REFERENCES GUIDE by Alexandre Y. K. Bouquin (updated June2017) Table of Contents GETTING STARTED... 2 QUICK START... 3 Very quick start, for the truly impatient...
MEGARA ONLINE ETC (v1.0.0) QUICK START AND REFERENCES GUIDE by Alexandre Y. K. Bouquin (updated June2017) Table of Contents GETTING STARTED... 2 QUICK START... 3 Very quick start, for the truly impatient...
Spectrographs. C. A. Griffith, Class Notes, PTYS 521, 2016 Not for distribution.
 Spectrographs C A Griffith, Class Notes, PTYS 521, 2016 Not for distribution 1 Spectrographs and their characteristics A spectrograph is an instrument that disperses light into a frequency spectrum, which
Getting the most out of your ALMA DATA with ADMIT: The ALMA DATA Mining Toolkit
 Getting the most out of your ALMA DATA with : The ALMA DATA Mining Toolkit Lee Mundy, Leslie Looney, Peter Teuben, Doug Friedel, Marc Pound, Lisa Xu, Kevin Rauch, Robert Harris, Jeff Kern, & team : ALMA
CALIBRATION OF NEON S AIRBORNE IMAGING SPECTROMETERS
 CALIBRATION OF NEON S AIRBORNE IMAGING SPECTROMETERS Nathan Leisso, NEON Joe Boardman, AIG Thomas Kampe, NEON August 25, 2015 Funded by the National Science Foundation to to enable understanding and forecasting
Surface Xplorer. Manual
 Surface Xplorer Manual Table of contents Introduction to Surface Xplorer... 4 3D Surface... 5 Spectrum Panel... 6 Kinetic Panel... 7 File Info... 8 File Menu... 9 Open File... 9 Save File As... 9 Average
FFT-Based Astronomical Image Registration and Stacking using GPU
 M. Aurand 4.21.2010 EE552 FFT-Based Astronomical Image Registration and Stacking using GPU The productive imaging of faint astronomical targets mandates vanishingly low noise due to the small amount of
Correction and Calibration 2. Preprocessing
 Correction and Calibration Reading: Chapter 7, 8. 8.3 ECE/OPTI 53 Image Processing Lab for Remote Sensing Preprocessing Required for certain sensor characteristics and systematic defects Includes: noise
High spatial resolution measurement of volume holographic gratings
 High spatial resolution measurement of volume holographic gratings Gregory J. Steckman, Frank Havermeyer Ondax, Inc., 8 E. Duarte Rd., Monrovia, CA, USA 9116 ABSTRACT The conventional approach for measuring
Diffuse Source Absolute Sensitivity and Point Source Relative Sensitivity as a Function of Extraction Slit Height for STIS First-Order Modes
 Instrument Science Report STIS 98-01 Diffuse Source Absolute Sensitivity and Point Source Relative Sensitivity as a Function of Extraction Slit Height for STIS First-Order Modes Ralph Bohlin, Space Telescope
COS/FUV Wavelength Calibration Cristina Oliveira COS/STIS Team Lead
 COS/FUV Wavelength Calibration Cristina Oliveira COS/STIS Team Lead 11/05/15 STUC - COS/FUV Wavelength Calibration Update 1 COS/FUV Wavelength Calibration Heard STUC concerns about COS/FUV wavelength calibration
TracePro Stray Light Simulation
 TracePro Stray Light Simulation What Is Stray Light? A more descriptive term for stray light is unwanted light. In an optical imaging system, stray light is caused by light from a bright source shining
arxiv: v1 [astro-ph.im] 28 Jan 2014
![arxiv: v1 [astro-ph.im] 28 Jan 2014](/thumbs/91/106570191.jpg "arxiv: v1 [astro-ph.im] 28 Jan 2014") Mon. Not. R. Astron. Soc. 000, 1?? (2014) Printed 29 January 2014 (MN LATEX style file v2.2) A treatment procedure for Gemini North/NIFS data cubes: application to NGC 4151 arxiv:1401.7078v1 [astro-ph.im]
Mon. Not. R. Astron. Soc. 000, 1?? (2014) Printed 29 January 2014 (MN LATEX style file v2.2) A treatment procedure for Gemini North/NIFS data cubes: application to NGC 4151 arxiv:1401.7078v1 [astro-ph.im]
Chapter 24 - The Wave Nature of Light
 Chapter 24 - The Wave Nature of Light Summary Four Consequences of the Wave nature of Light: Diffraction Dispersion Interference Polarization Huygens principle: every point on a wavefront is a source of
RGS data reduction and analysis of point-like sources
 14 th ESAC SAS Workshop 2 nd 6 th June 2014 RGS data reduction and analysis of point-like sources Rosario González-Riestra XMM-Newton SOC ESAC Processing RGS data (I) from... to... FRAME Time CCD, node,
CLASS tutorial: I. Basics
 CLASS tutorial: I. Basics Presentation by Sébastien BARDEAU & Jérôme PETY (IRAM/Grenoble) Current CLASS developers: Sébastien BARDEAU, Jérôme PETY, & Stéphane GUILLOTEAU on behalf of the CLASS developers
Elliptical Reflector Tutorial. 6/16/2000 TracePro Elliptical Reflector Tutorial 1
 Elliptical Reflector Tutorial 6/16/2000 TracePro Elliptical Reflector Tutorial 1 Opening the Elliptical Reflector File Open the File Menu and select the Open option. A Open file dialog box will appear.
Basic Imaging and Self- Calibration (T4 + T7)
") Basic Imaging and Self- Calibration (T4 + T7) John McKean Visibilities Fourier Transform Deconvolution AIM: 1. To make an image by taking the fast Fourier transform of the visibility data. 2. Carry out
Basic Imaging and Self- Calibration (T4 + T7) John McKean Visibilities Fourier Transform Deconvolution AIM: 1. To make an image by taking the fast Fourier transform of the visibility data. 2. Carry out
An Accurate Method for Skew Determination in Document Images
 DICTA00: Digital Image Computing Techniques and Applications, 1 January 00, Melbourne, Australia. An Accurate Method for Skew Determination in Document Images S. Lowther, V. Chandran and S. Sridharan Research
Exercise of data reduction for MOIRCS Multi-Object Spectroscopy
 1D spectrum (Goal for quick workers) Subaru Autumn School 2014, on 24-26 September 2014 Exercise of data reduction for MOIRCS Multi-Object Spectroscopy Schedule on 25 th Sep. (as a guide) 10:10-12:00 (~2
Computer Vision I. Announcements. Fourier Tansform. Efficient Implementation. Edge and Corner Detection. CSE252A Lecture 13.
 Announcements Edge and Corner Detection HW3 assigned CSE252A Lecture 13 Efficient Implementation Both, the Box filter and the Gaussian filter are separable: First convolve each row of input image I with
Data Analysis. I have got some data, so what now? Naomi McClure-Griffiths CSIRO Australia Telescope National Facility 2 Oct 2008
 Data Analysis I have got some data, so what now? Naomi McClure-Griffiths CSIRO Australia Telescope National Facility 2 Oct 2008 1 Outline Non-imaging analysis Parameter estimation Point source fluxes,
Progress Report. Ian Evans On behalf of the Chandra Source Catalog Project Team. Chandra Users Committee Meeting October 22, 2013
 Progress Report Ian Evans On behalf of the Chandra Source Catalog Project Team Chandra Users Committee Meeting October 22, 2013 Current Catalog Release Summary Current catalog version: 1.1; Released: 2010
Continuum error recognition and error analysis
 Continuum error recognition and error analysis Robert Laing (ESO) 1 Outline Error recognition: how do you recognise and diagnose residual errors by looking at images? Image analysis: how do you extract
Spatial Interpolation - Geostatistics 4/3/2018
 Spatial Interpolation - Geostatistics 4/3/201 (Z i Z j ) 2 / 2 Spatial Interpolation & Geostatistics Lag Distance between pairs of points Lag Mean Tobler s Law All places are related, but nearby places
THE EPIC SIMULATOR AND PILE-UP MODELLING. Prashin Jethwa EPIC BOC /3/2012
 THE EPIC SIMULATOR AND PILE-UP MODELLING Prashin Jethwa EPIC BOC 2012 7/3/2012 OUTLINE Introduction to the EPIC simulator What is it? How does it work? Validation Pile-up modelling Flux losses Spectral
Status of PSF Reconstruction at Lick
 Status of PSF Reconstruction at Lick Mike Fitzgerald Workshop on AO PSF Reconstruction May 10-12, 2004 Quick Outline Recap Lick AO system's features Reconstruction approach Implementation issues Calibration
Basic PyRAF. Version 2.0 July Space Telescope Science Institute 3700 San Martin Drive Baltimore, Maryland 21218
 Version 2.0 July 2014 Basic PyRAF Space Telescope Science Institute 3700 San Martin Drive Baltimore, Maryland 21218 Operated by the Association of Universities for Research in Astronomy, Inc., for the
Lecture PowerPoints. Chapter 24 Physics: Principles with Applications, 7 th edition Giancoli
 Lecture PowerPoints Chapter 24 Physics: Principles with Applications, 7 th edition Giancoli This work is protected by United States copyright laws and is provided solely for the use of instructors in teaching
A more generalized coordinate transformation approach for grisms
 Instrument Science Report WFC3 2017-01 A more generalized coordinate transformation approach for grisms Nor Pirzkal, R. Ryan January 5, 2017 ABSTRACT Current HST configuration files for the NICMOS, ACS
Data Preprocessing. D.N. Rutledge, AgroParisTech
 Data Preprocessing D.N. Rutledge, AgroParisTech 12 Rencontres Héliospir / 30 septembre 2011 Outline Zone selection Examining raw data The importance of pre-treatment of data Common pre-treatment methods
CRISM 2012 Data Users Workshop. MTRDR Data Analysis Walk-Through. K. Seelos, D. Buczkowski, F. Seelos, S. Murchie, and the CRISM SOC JHU/APL
 CRISM 2012 Data Users Workshop MTRDR Data Analysis Walk-Through K. Seelos, D. Buczkowski, F. Seelos, S. Murchie, and the CRISM SOC JHU/APL 1 Goals Familiarize CRISM data users with the new MTRDR data set
Introduction to Raman spectroscopy measurement data processing using Igor Pro
 Introduction to Raman spectroscopy measurement data processing using Igor Pro This introduction is intended to minimally guide beginners to processing Raman spectroscopy measurement data, which includes
Linescan System Design for Robust Web Inspection
 Linescan System Design for Robust Web Inspection Vision Systems Design Webinar, December 2011 Engineered Excellence 1 Introduction to PVI Systems Automated Test & Measurement Equipment PC and Real-Time
Spectrographs. Chapter The spectrograph
 Chapter 6 Spectrographs In this chapter, the basic principles of spectrograph design are reviewed. Both low order (low resolution) and high order (high resolution echelle configurations) are presented.
Image Analysis Lecture Segmentation. Idar Dyrdal
 Image Analysis Lecture 9.1 - Segmentation Idar Dyrdal Segmentation Image segmentation is the process of partitioning a digital image into multiple parts The goal is to divide the image into meaningful
TECHNICAL REPORT. Doc #: Date: Rev: Phone:
 When there is a discrepancy between the information in this technical report and information in JDox, assume JDox is correct. TECHNICAL REPORT Title: Simulations of Target Acquisition with MIRI Four-Quadrant
mosaic_mask.pl David Makovoz, 04/30/04 Version 1.2 Table of Contents
 mosaic_mask.pl mosaic_mask.pl David Makovoz, 4/3/4 Version. Table of Contents mosaic_mask.pl... Overview.... Input Image Requirements... Input and Output.... Input Data.... Namelist Configuration file...
GAMMA Interferometric Point Target Analysis Software (IPTA): Users Guide
: Users Guide") GAMMA Interferometric Point Target Analysis Software (IPTA): Users Guide Contents User Handbook Introduction IPTA overview Input data Point list generation SLC point data Differential interferogram point
GAMMA Interferometric Point Target Analysis Software (IPTA): Users Guide Contents User Handbook Introduction IPTA overview Input data Point list generation SLC point data Differential interferogram point
Gamma spectroscopic measurements using the PID350 pixelated CdTe radiation detector
 Gamma spectroscopic measurements using the PID350 pixelated CdTe radiation detector K. Karafasoulis, K. Zachariadou, S. Seferlis, I. Papadakis, D. Loukas, C. Lambropoulos, C. Potiriadis Abstract Spectroscopic
Appendix A Telescope Beam Profiles Calculation
 Appendix A Telescope Beam Profiles Calculation In mathematics, the Hankel transform (Goodman 25; Bracewell and Bracewell 1986) of order zero is an integral transform equivalent to a two-dimensional Fourier
EE795: Computer Vision and Intelligent Systems
 EE795: Computer Vision and Intelligent Systems Spring 2012 TTh 17:30-18:45 WRI C225 Lecture 04 130131 http://www.ee.unlv.edu/~b1morris/ecg795/ 2 Outline Review Histogram Equalization Image Filtering Linear