Esri International User Conference. July San Diego Convention Center. Lidar Solutions. Clayton Crawford
|
|
|
- Amie Kennedy
- 6 years ago
- Views:
Transcription
1 Esri International User Conference July San Diego Convention Center Lidar Solutions Clayton Crawford
2 Outline Data structures, tools, and workflows Assessing lidar point coverage and sample density Creating raster DEMs and DSMs Data area delineation Estimating forest canopy density and height Creating intensity images Reducing noise for contouring and slope analysis Floodplain delineation
3 Big Picture Solutions for GIS end users - Not about lidar data production Operate on clean/classified lidar points Produce useful derivatives Perform analysis Handle large datasets Both file and database oriented solutions


4 Supporting Data structures and Tools Vector features - points - multipoints - lines - polygons Raster TIN Terrain Dataset Point File Information LAS To Multipoint ASCII 3D To Feature Class Point To Raster Terrain To Raster Terrain To TIN Input Function Output Workflow
5 Supporting Data structures and Tools (10.1) LAS dataset - LAS Dataset Statistics - LAS Dataset To Raster - LAS Point Statistics As Raster - LAS Dataset To TIN Mosaic dataset - Extensive collection of raster tools Input Function Output Workflow
6 Recommended presentations: Working with Lidar and Terrain Datasets - Mapping demo theater: Wed 3:00 - Tech workshop: Thu 10:15 Working with LAS Datasets - Tech workshop: Thu 8:30 Serving Lidar Data - Imagery demo theater: Wed 9:30 Managing Elevation Data - Imagery demo theater: Wed: 3:00


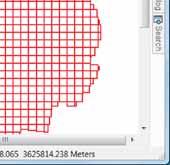
7 Lidar point coverage and sample density Basic QA/QC before loading data into geodatabase Verify xy and z extent Examine point spacing

")
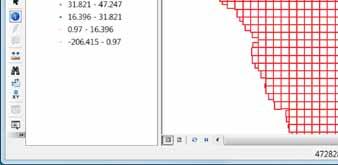
8 LAS Dataset Layer (10.1)

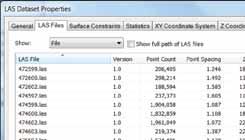
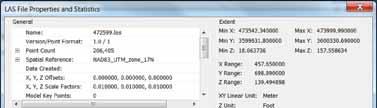

9 LAS Dataset Properties (10.1)

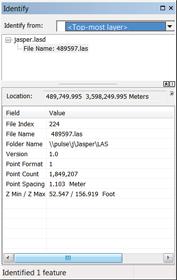
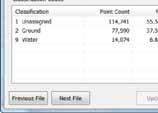
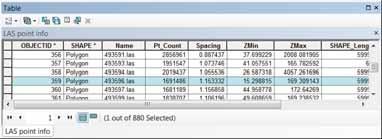
10 Point File Information Tool Inputs files (LAS and ASCII) and folders of files and outputs a polygon feature class. Each output record includes - Polygon of file s data extent - Source filename - Point count - Point spacing estimate - Z min - Z max

11 Point File Information Tool
12 LAS Point Statistics As Raster Tool (10.1) Pulse/sample density

13 Point To Raster Tool Pulse/sample density

14 Loading Data into GDB: LAS To Multipoint Tool LAS = industry standard file format for lidar Multipoints used for efficiency Filter options - By class - By return
 rather summary of entire file.")
15 Point to Raster Tool Used after points are loaded into geodatabase More detailed assessment than Point File Information Based on actual points loaded (i.e., filtered by class code or return) rather summary of entire file.
16 Demo


17 Creating Raster DEMs and DSMs Digital Elevation Model Digital Surface Model Bare earth surface made using only ground hits. Includes ground, trees, and buildings made using first returns.
 Binning - Fast - Reasonable for DSMs")


18 LAS Dataset To Raster (10.1) Binning - Fast - Reasonable for DSMs - Void filling options - Honors replace and clip constraint types Triangulation - True interpolation - Always fills voids - Appropriate for DEMs - Honors all constraint types
19 Point to Raster Tool Fast Rasterize based on multipoint vertex z Not true interpolation Doesn t support breaklines Data gaps Arguably works best with 1 st return data because there are fewer and smaller data voids to deal with.

,")
, FocalMean([pt2ras],")
20 Point to Raster Post-process: Void Filling Point To Raster Raster Calculator Con(IsNull("pt2ras"), FocalStatistics( pt2ras", NbrRectangle(3, 3, "CELL"), "MEAN", "DATA"), "pt2ras") 10.0 Con(IsNull([pt2ras]), FocalMean([pt2ras], Rectangle, 3, 3, DATA), [pt2ras]) 9.3
21 Don t Abuse Con Introduces anomalies if used repeatedly Hilltop Steeper slope Valley bottom Nodata cells

22 Terrain to Raster Quality Supports ancillary data (breaklines, water bodies, etc.) True interpolation Can handle large datasets

23 Comparison Interpolation Binning


24 Data Area Delineation Dense collection of source measurement points (green). Triangulation of those points without a boundary constraint. Constraint applied.
25 Workflow to Calculate a Data Area Polygon (10.1) Input LAS dataset LAS Point Statistics As Raster Con Expand Shrink Raster to Polygon Output polygon feature class Eliminate Polygon Part
26 Workflow to Calculate a Data Area Polygon Input multipoint feature class Point to Raster Con Expand Shrink Raster to Polygon Output polygon feature class Eliminate Polygon Part
27 Demo


28 Estimating Forest Canopy Density and Height
29 Canopy Density and Height Density is the ratio of vegetation hits to total hits within a unit area (i.e., raster cell). - LAS to Multipoint to make two feature classes: ground and non-ground. - Point to Raster to make count grids. - Add ground and non-ground to make a total grid. - Use Divide to get the ratio between non-ground and total. Height is the difference between DSM and DEM - Use Point to Raster or Terrain to Raster followed by Minus.

30 Creating Intensity Images
 Input LAS dataset Intensity Image LAS")
31 Intensity Image Workflow (10.1) Input LAS dataset Intensity Image LAS Dataset To Raster GP Tool


32 Intensity Image Workflow Input LAS files Output multipoint feature class LAS To Multipoint GP Tool Point To Raster GP Tool Intensity Image


33 BLOB Based Storage of Intensity BLOBs are used, in the context of lidar, to store multiple numeric values together in one thing. Each BLOB contains as many values as there are vertices in the corresponding multipoint.


34 Reducing Noise for Contouring and Slope Analysis
35 Lidar Is Noisy Lidar has measurement error Typically 12-15cm vertical accuracy Horizontal sample density is often 1m or less This results in high frequency noise - Extremely messy contours - Average slope skewed to be very high Goal is to reduce noise without degrading the accuracy
36 Point Thinning, Interpolation, and Rasterization Use only those points necessary Some applications refer to points selected for use in making contours as model key points Terrain pyramids - Original points filtered into different levels of detail - Can specify which pyramid level to use when interpolating to raster or extracting TIN Natural neighbors - Conservatively smooth
37 Point Thinning, Interpolation, and Rasterization Input lidar Create Terrain GP Tool Terrain To Raster GP Tool Contour GP Tool Slope GP Tool Workflow
38 Floodplain Delineation

39 Surface Difference Tool Subtract lidar based ground surface from modeled (e.g., HEC-RAS) water surface Output polygons used to delineate floodplain Optional output of depth surface(s)
40 Demo

41 For those wanting models:

42 Thank you for attending Have fun at UC2012 Open for Questions Please fill out the evaluation: Offering ID: 632

43 Steps to evaluate UC sessions My UC Homepage > Evaluate Sessions Choose session from planner OR Search for session Offering ID: 632


44
Lidar and GIS: Applications and Examples. Dan Hedges Clayton Crawford
 Lidar and GIS: Applications and Examples Dan Hedges Clayton Crawford Outline Data structures, tools, and workflows Assessing lidar point coverage and sample density Creating raster DEMs and DSMs Data area
Creating raster DEMs and DSMs from large lidar point collections. Summary. Coming up with a plan. Using the Point To Raster geoprocessing tool
 Page 1 of 5 Creating raster DEMs and DSMs from large lidar point collections ArcGIS 10 Summary Raster, or gridded, elevation models are one of the most common GIS data types. They can be used in many ways
Surface Creation & Analysis with 3D Analyst
 Esri International User Conference July 23 27 San Diego Convention Center Surface Creation & Analysis with 3D Analyst Khalid Duri Surface Basics Defining the surface Representation of any continuous measurement
An Introduction to Using Lidar with ArcGIS and 3D Analyst
 FedGIS Conference February 24 25, 2016 Washington, DC An Introduction to Using Lidar with ArcGIS and 3D Analyst Jim Michel Outline Lidar Intro Lidar Management Las files Laz, zlas, conversion tools Las
Surface Analysis with 3D Analyst
 2013 Esri International User Conference July 8 12, 2013 San Diego, California Technical Workshop Surface Analysis with 3D Analyst Khalid H. Duri Esri UC2013. Technical Workshop. Why use 3D GIS? Because
Esri International User Conference. San Diego, California. Technical Workshops. July Creating Surfaces. Steve Kopp and Steve Lynch
 Esri International User Conference San Diego, California Technical Workshops July 2011 Creating Surfaces Steve Kopp and Steve Lynch Overview Learn the types of surfaces and the data structures used to
Reality Check: Processing LiDAR Data. A story of data, more data and some more data
 Reality Check: Processing LiDAR Data A story of data, more data and some more data Red River of the North Red River of the North Red River of the North Red River of the North Introduction and Background
Alaska Department of Transportation Roads to Resources Project LiDAR & Imagery Quality Assurance Report Juneau Access South Corridor
 Alaska Department of Transportation Roads to Resources Project LiDAR & Imagery Quality Assurance Report Juneau Access South Corridor Written by Rick Guritz Alaska Satellite Facility Nov. 24, 2015 Contents
Lidar Working with LAS Datasets
 2013 Esri International User Conference July 8 12, 2013 San Diego, California Technical Workshop Lidar Working with LAS Datasets Raghav Vemula (3D Team) Esri UC2013. Technical Workshop. Agenda Las Dataset
N.J.P.L.S. An Introduction to LiDAR Concepts and Applications
 N.J.P.L.S. An Introduction to LiDAR Concepts and Applications Presentation Outline LIDAR Data Capture Advantages of Lidar Technology Basics Intensity and Multiple Returns Lidar Accuracy Airborne Laser
MODULE 1 BASIC LIDAR TECHNIQUES
 MODULE SCENARIO One of the first tasks a geographic information systems (GIS) department using lidar data should perform is to check the quality of the data delivered by the data provider. The department
Your Prioritized List. Priority 1 Faulted gridding and contouring. Priority 2 Geoprocessing. Priority 3 Raster format
 Your Prioritized List Priority 1 Faulted gridding and contouring Priority 2 Geoprocessing Priority 3 Raster format Priority 4 Raster Catalogs and SDE Priority 5 Expanded 3D Functionality Priority 1 Faulted
Image Services for Elevation Data
 Image Services for Elevation Data Peter Becker Need for Elevation Using Image Services for Elevation Data sources Creating Elevation Service Requirement: GIS and Imagery, Integrated and Accessible Field
Managing Lidar and Photogrammetric Point Clouds. Lindsay Weitz Cody Benkelman
 and Photogrammetric Point Clouds Lindsay Weitz Cody Benkelman Presentation Context What is lidar, and how does it work? Not this presentation! What can you do with lidar in ArcGIS? What does Esri recommend
WMS 9.1 Tutorial Hydraulics and Floodplain Modeling Floodplain Delineation Learn how to us the WMS floodplain delineation tools
 v. 9.1 WMS 9.1 Tutorial Hydraulics and Floodplain Modeling Floodplain Delineation Learn how to us the WMS floodplain delineation tools Objectives Experiment with the various floodplain delineation options
An Introduction to Lidar & Forestry May 2013
 An Introduction to Lidar & Forestry May 2013 Introduction to Lidar & Forestry Lidar technology Derivatives from point clouds Applied to forestry Publish & Share Futures Lidar Light Detection And Ranging
The Reference Library Generating Low Confidence Polygons
 GeoCue Support Team In the new ASPRS Positional Accuracy Standards for Digital Geospatial Data, low confidence areas within LIDAR data are defined to be where the bare earth model might not meet the overall
Contents of Lecture. Surface (Terrain) Data Models. Terrain Surface Representation. Sampling in Surface Model DEM
 Data Models. Terrain Surface Representation. Sampling in Surface Model DEM") Lecture 13: Advanced Data Models: Terrain mapping and Analysis Contents of Lecture Surface Data Models DEM GRID Model TIN Model Visibility Analysis Geography 373 Spring, 2006 Changjoo Kim 11/29/2006 1
Lecture 13: Advanced Data Models: Terrain mapping and Analysis Contents of Lecture Surface Data Models DEM GRID Model TIN Model Visibility Analysis Geography 373 Spring, 2006 Changjoo Kim 11/29/2006 1
Designing and Using Cached Map Services
 Esri International User Conference San Diego, California Technical Workshops July 2012 Designing and Using Cached Map Services Sterling Quinn Eric Rodenberg What we will cover Session Topics - Map cache
UNDERSTAND HOW TO SET UP AND RUN A HYDRAULIC MODEL IN HEC-RAS CREATE A FLOOD INUNDATION MAP IN ARCGIS.
 CE 412/512, Spring 2017 HW9: Introduction to HEC-RAS and Floodplain Mapping Due: end of class, print and hand in. HEC-RAS is a Hydrologic Modeling System that is designed to describe the physical properties
Masking Lidar Cliff-Edge Artifacts
 Masking Lidar Cliff-Edge Artifacts Methods 6/12/2014 Authors: Abigail Schaaf is a Remote Sensing Specialist at RedCastle Resources, Inc., working on site at the Remote Sensing Applications Center in Salt
Tools, Tips, and Workflows Exporting Final Product LP360
 LP360 Support Revision 1.0 l Final products can be exported from LIDAR data using either LP360 command line executables or the LP360 Export Wizard. Some export functions and resulting products include,
Using Imagery for Intelligence Analysis
 2013 Esri International User Conference July 8 12, 2013 San Diego, California Technical Workshop Using Imagery for Intelligence Analysis Renee Bernstein Natalie Campos Esri UC2013. Technical Workshop.
2010 LiDAR Project. GIS User Group Meeting June 30, 2010
 2010 LiDAR Project GIS User Group Meeting June 30, 2010 LiDAR = Light Detection and Ranging Technology that utilizes lasers to determine the distance to an object or surface Measures the time delay between
GIS-Generated Street Tree Inventory Pilot Study
 GIS-Generated Street Tree Inventory Pilot Study Prepared for: MSGIC Meeting Prepared by: Beth Schrayshuen, PE Marla Johnson, GISP 21 July 2017 Agenda 2 Purpose of Street Tree Inventory Pilot Study Evaluation
BRIEF EXAMPLES OF PRACTICAL USES OF LIDAR
 BRIEF EXAMPLES OF PRACTICAL USES OF LIDAR PURDUE ROAD SCHOOL - 3/9/2016 CHRIS MORSE USDA-NRCS, STATE GIS COORDINATOR LIDAR/DEM SOURCE DATES LiDAR and its derivatives (DEMs) have a collection date for data
The 3D Analyst extension extends ArcGIS to support surface modeling and 3- dimensional visualization. 3D Shape Files
 NRM 435 Spring 2016 ArcGIS 3D Analyst Page#1 of 9 0B3D Analyst Extension The 3D Analyst extension extends ArcGIS to support surface modeling and 3- dimensional visualization. 3D Shape Files Analogous to
Steps for Modeling a Proposed New Reservoir in GIS
 Steps for Modeling a Proposed New Reservoir in GIS Requirements: ArcGIS ArcMap, ArcScene, Spatial Analyst, and 3D Analyst There s a new reservoir proposed for Right Hand Fork in Logan Canyon. I wanted
Overview. 1. Aerial LiDAR in Wisconsin (20 minutes) 2. Demonstration of data in CAD (30 minutes) 3. High Density LiDAR (20 minutes)
 2. Demonstration of data in CAD (30 minutes) 3. High Density LiDAR (20 minutes)") Overview 1. Aerial LiDAR in Wisconsin (20 minutes) 2. Demonstration of data in CAD (30 minutes) 3. High Density LiDAR (20 minutes) 4. Aerial lidar technology advancements (15 minutes) 5. Q & A 1. Aerial
Overview 1. Aerial LiDAR in Wisconsin (20 minutes) 2. Demonstration of data in CAD (30 minutes) 3. High Density LiDAR (20 minutes) 4. Aerial lidar technology advancements (15 minutes) 5. Q & A 1. Aerial
3D Analyst Visualization with ArcGlobe. Brady Hoak, ESRI DC
 3D Analyst Visualization with ArcGlobe Brady Hoak, ESRI DC 3D GIS Viewing geospatial data in 3D leads to new insights 2D 3D Sometimes you need to edit your data in 3D 2D 3D Some problems can only be solved
Getting Started with Spatial Analyst. Steve Kopp Elizabeth Graham
 Getting Started with Spatial Analyst Steve Kopp Elizabeth Graham Workshop Overview Fundamentals of using Spatial Analyst What analysis capabilities exist and where to find them How to build a simple site
Municipal Projects in Cambridge Using a LiDAR Dataset. NEURISA Day 2012 Sturbridge, MA
 Municipal Projects in Cambridge Using a LiDAR Dataset NEURISA Day 2012 Sturbridge, MA October 15, 2012 Jeff Amero, GIS Manager, City of Cambridge Presentation Overview Background on the LiDAR dataset Solar
Converting Lidar Data to Shapefile and Raster File Format for Analysis and Viewing
 Converting Lidar Data to Shapefile and Raster File Format for Analysis and Viewing 1. Create a File Based Geodatabase Open ArcCatolog and right click under contents and click New and File Geodatabase where
GEOGRAPHIC INFORMATION SYSTEMS Lecture 25: 3D Analyst
 GEOGRAPHIC INFORMATION SYSTEMS Lecture 25: 3D Analyst 3D Analyst - 3D Analyst is an ArcGIS extension designed to work with TIN data (triangulated irregular network) - many of the tools in 3D Analyst also
Getting Started with Spatial Analyst. Steve Kopp Elizabeth Graham
 Getting Started with Spatial Analyst Steve Kopp Elizabeth Graham Spatial Analyst Overview Over 100 geoprocessing tools plus raster functions Raster and vector analysis Construct workflows with ModelBuilder,
Light Detection and Ranging (LiDAR)
") Light Detection and Ranging (LiDAR) http://code.google.com/creative/radiohead/ Types of aerial sensors passive active 1 Active sensors for mapping terrain Radar transmits microwaves in pulses determines
Light Detection and Ranging (LiDAR) http://code.google.com/creative/radiohead/ Types of aerial sensors passive active 1 Active sensors for mapping terrain Radar transmits microwaves in pulses determines
Making the Most of Raster Analysis with Living Atlas Data. Aileen Buckley, PhD, Research Cartographer Esri - Redlands
 Making the Most of Raster Analysis with Living Atlas Data Aileen Buckley, PhD, Research Cartographer Esri - Redlands Spatial Analysis with Online Data Your Desktop Web Device Never scrounge for or download
Publishing image services in ArcGIS
 Esri International User Conference San Diego, California Technical Workshops July 26, 2012 Publishing image services in ArcGIS Wenxue Ju & Melanie Harlow What is an image service? A way to make image and
SMS v D Summary Table. SRH-2D Tutorial. Prerequisites. Requirements. Time. Objectives
 SMS v. 12.3 SRH-2D Tutorial Objectives Learn the process of making a summary table to compare the 2D hydraulic model results with 1D hydraulic model results. This tutorial introduces a method of presenting
APPENDIX E2. Vernal Pool Watershed Mapping
 APPENDIX E2 Vernal Pool Watershed Mapping MEMORANDUM To: U.S. Fish and Wildlife Service From: Tyler Friesen, Dudek Subject: SSHCP Vernal Pool Watershed Analysis Using LIDAR Data Date: February 6, 2014
LORI COLLINS, RESEARCH ASSOCIATE PROFESSOR CONTRIBUTIONS BY: RICHARD MCKENZIE AND GARRETT SPEED, DHHC USF L IBRARIES
 LORI COLLINS, RESEARCH ASSOCIATE PROFESSOR CONTRIBUTIONS BY: RICHARD MCKENZIE AND GARRETT SPEED, DHHC USF L IBRARIES AERIAL AND TERRESTRIAL SURVEY WORKFLOWS Workflow from project planning applications
Creating Surfaces. Steve Kopp Steve Lynch
 Steve Kopp Steve Lynch Overview Learn the types of surfaces and the data structures used to store them Emphasis on surface interpolation Learn the interpolation workflow Understand how interpolators work
FOR 274: Surfaces from Lidar. Lidar DEMs: Understanding the Returns. Lidar DEMs: Understanding the Returns
 FOR 274: Surfaces from Lidar LiDAR for DEMs The Main Principal Common Methods Limitations Readings: See Website Lidar DEMs: Understanding the Returns The laser pulse travel can travel through trees before
Lidar Technical Report
 Lidar Technical Report Oregon Department of Forestry Sites Presented to: Oregon Department of Forestry 2600 State Street, Building E Salem, OR 97310 Submitted by: 3410 West 11st Ave. Eugene, OR 97402 April
Managing Imagery and Raster Data Using Mosaic Datasets
 2013 Esri International User Conference July 8 12, 2013 San Diego, California Technical Workshop Managing Imagery and Raster Data Using Mosaic Datasets Hong Xu, Prashant Mangtani Esri UC2013. Technical
Learn how to delineate a watershed using the hydrologic modeling wizard
 v. 11.0 WMS 11.0 Tutorial Learn how to delineate a watershed using the hydrologic modeling wizard Objectives Import a digital elevation model, compute flow directions, and delineate a watershed and sub-basins
Esri Production Mapping An Introduction
 Esri International User Conference San Diego, California Technical Workshops July 25, 2012 Esri Production Mapping An Introduction Lana Tylka Amber Bethell Workshop Overview Part I - Industry challenges
George Mason University Department of Civil, Environmental and Infrastructure Engineering. Dr. Celso Ferreira
 George Mason University Department of Civil, Environmental and Infrastructure Engineering Dr. Celso Ferreira Exercise Topic: HEC GeoRAS Post-Processing Objectives: This tutorial is designed to walk you
Feature Extraction from Imagery & Lidar. Kurt Schwoppe, Esri Mark Romero, Esri Gregory Bacon, Fairfax County
 Feature Extraction from & Lidar Kurt Schwoppe, Esri Mark Romero, Esri Gregory Bacon, Fairfax County Today s Speakers Image Processing Experts and Good Colleagues Kurt Schwoppe Industry Lead Esri Mark Romero
Field-Scale Watershed Analysis
 Conservation Applications of LiDAR Field-Scale Watershed Analysis A Supplemental Exercise for the Hydrologic Applications Module Andy Jenks, University of Minnesota Department of Forest Resources 2013
Review of Cartographic Data Types and Data Models
 Review of Cartographic Data Types and Data Models GIS Data Models Raster Versus Vector in GIS Analysis Fundamental element used to represent spatial features: Raster: pixel or grid cell. Vector: x,y coordinate
Algorithms for GIS csci3225
 Algorithms for GIS csci3225 Laura Toma Bowdoin College LiDAR data in GIS LiDAR (Light Detection and Ranging) Each point records: its geographic location x,y its height z the number of returns in its pulse
LiDAR QA/QC - Quantitative and Qualitative Assessment report -
 LiDAR QA/QC - Quantitative and Qualitative Assessment report - CT T0009_LiDAR September 14, 2007 Submitted to: Roald Haested Inc. Prepared by: Fairfax, VA EXECUTIVE SUMMARY This LiDAR project covered approximately
Workflows for Managing and Serving Elevation (and Lidar) Data. Cody Benkelman
 Data. Cody Benkelman") Workflows for Managing and Serving Elevation (and Lidar) Data Cody Benkelman Outline Usage Modes Data Management - Architecture - Workflow Automation for Repeatability & Scalability A few options re: Cloud,
Workflows for Managing and Serving Elevation (and Lidar) Data Cody Benkelman Outline Usage Modes Data Management - Architecture - Workflow Automation for Repeatability & Scalability A few options re: Cloud,
WMS 9.1 Tutorial Watershed Modeling DEM Delineation Learn how to delineate a watershed using the hydrologic modeling wizard
 v. 9.1 WMS 9.1 Tutorial Learn how to delineate a watershed using the hydrologic modeling wizard Objectives Read a digital elevation model, compute flow directions, and delineate a watershed and sub-basins
Caching Imagery Using ArcGIS
 2013 Esri International User Conference July 8 12, 2013 San Diego, California Technical Workshop Caching Imagery Using ArcGIS Hong Xu, Hua Wei Esri UC2013. Technical Workshop. Presentation Goals Publish
Basics of Using LiDAR Data
 Conservation Applications of LiDAR Basics of Using LiDAR Data Exercise #2: Raster Processing 2013 Joel Nelson, University of Minnesota Department of Soil, Water, and Climate This exercise was developed
QA/QC Functionality in MARS version 2017.x
 QA/QC Functionality in MARS version 2017.x 1. Check Point Report a. Inputs section b. Statistics and Standards sections c. Other Functions 2. LAS Statistics a. Created During Tile Scheme Generation b.
LiDAR Data Processing:
 LiDAR Data Processing: Concepts and Methods for LEFI Production Gordon W. Frazer GWF LiDAR Analytics Outline of Presentation Data pre-processing Data quality checking and options for repair Data post-processing
Learn how to delineate a watershed using the hydrologic modeling wizard
 v. 10.1 WMS 10.1 Tutorial Learn how to delineate a watershed using the hydrologic modeling wizard Objectives Import a digital elevation model, compute flow directions, and delineate a watershed and sub-basins
PROJECT REPORT. Allegany County Acquisition and Classification for FEMA Region 3 FY 12 VA LiDAR. USGS Contract: G12PD00040.
 PROJECT REPORT For the Allegany County Acquisition and Classification for FEMA Region 3 FY 12 VA LiDAR USGS Contract: G12PD00040 Prepared for: United States Geological Survey & Federal Emergency Management
I. Project Title Light Detection and Ranging (LIDAR) Processing
 Processing") I. Project Title Light Detection and Ranging (LIDAR) Processing II. Lead Investigator Ryan P. Lanclos Research Specialist 107 Stewart Hall Department of Geography University of Missouri Columbia Columbia,
I. Project Title Light Detection and Ranging (LIDAR) Processing II. Lead Investigator Ryan P. Lanclos Research Specialist 107 Stewart Hall Department of Geography University of Missouri Columbia Columbia,
Tutorial (Intermediate level): Dense Cloud Classification and DTM generation with Agisoft PhotoScan Pro 1.1
: Dense Cloud Classification and DTM generation with Agisoft PhotoScan Pro 1.1") Tutorial (Intermediate level): Dense Cloud Classification and DTM generation with Agisoft PhotoScan Pro 1.1 This tutorial illustrates how to perform dense point cloud classification in manual and automatic
Tutorial (Intermediate level): Dense Cloud Classification and DTM generation with Agisoft PhotoScan Pro 1.1 This tutorial illustrates how to perform dense point cloud classification in manual and automatic
Drone2Map for ArcGIS: Bring Drone Imagery into ArcGIS. Will
 Drone2Map for ArcGIS: Bring Drone Imagery into ArcGIS Will Meyers @MeyersMaps A New Window on the World Personal Mapping for Micro-Geographies Accurate High Quality Simple Low-Cost Drone2Map for ArcGIS
Topology in the Geodatabase an Introduction. Erik Hoel Doug Morgenthaler
 Topology in the Geodatabase an Introduction Erik Hoel Doug Morgenthaler ESRI Super Secret Topology Laboratory, May 2012 Agenda ArcGIS Topology defined Validating a topology Editing a topology Geoprocessing
COMPONENTS. The web interface includes user administration tools, which allow companies to efficiently distribute data to internal or external users.
 COMPONENTS LASERDATA LIS is a software suite for LiDAR data (TLS / MLS / ALS) management and analysis. The software is built on top of a GIS and supports both point and raster data. The following software
WMS 8.4 Tutorial Hydraulics and Floodplain Modeling Simplified Dam Break Learn how to run a dam break simulation and delineate its floodplain
 v. 8.4 WMS 8.4 Tutorial Hydraulics and Floodplain Modeling Simplified Dam Break Learn how to run a dam break simulation and delineate its floodplain Objectives Setup a conceptual model of stream centerlines
WMS 10.1 Tutorial Hydraulics and Floodplain Modeling Simplified Dam Break Learn how to run a dam break simulation and delineate its floodplain
 v. 10.1 WMS 10.1 Tutorial Hydraulics and Floodplain Modeling Simplified Dam Break Learn how to run a dam break simulation and delineate its floodplain Objectives Setup a conceptual model of stream centerlines
Copyright The McGraw-Hill Companies, Inc. Permission required for reproduction or display.
 Chapter 13. TERRAIN MAPPING AND ANALYSIS 13.1 Data for Terrain Mapping and Analysis 13.1.1 DEM 13.1.2 TIN Box 13.1 Terrain Data Format 13.2 Terrain Mapping 13.2.1 Contouring 13.2.2 Vertical Profiling 13.2.3
A COMPARISON OF LIDAR TERRAIN DATA WITH AUTOCORRELATED DSM EXTRACTED FROM DIGITALLY ACQUIRED HIGH OVERLAP PHOTOGRAPHY BACKGROUND
 A COMPARISON OF LIDAR TERRAIN DATA WITH AUTOCORRELATED DSM EXTRACTED FROM DIGITALLY ACQUIRED HIGH OVERLAP PHOTOGRAPHY Devin Kelley, Project Manager, Certified Photogrammetrist (ASPRS) Thomas Loecherbach,
Lab 12: Sampling and Interpolation
 Lab 12: Sampling and Interpolation What You ll Learn: -Systematic and random sampling -Majority filtering -Stratified sampling -A few basic interpolation methods Videos that show how to copy/paste data
Using LiDAR (Light Distancing And Ranging) data to more accurately describe avalanche terrain
 data to more accurately describe avalanche terrain") International Snow Science Workshop, Davos 009, Proceedings Using LiDAR (Light Distancing And Ranging) data to more accurately describe avalanche terrain Christopher M. McCollister, and Robert H. Comey,
International Snow Science Workshop, Davos 009, Proceedings Using LiDAR (Light Distancing And Ranging) data to more accurately describe avalanche terrain Christopher M. McCollister, and Robert H. Comey,
Managing and Serving Elevation and Lidar Data. Cody Benkelman UC 2018
 Managing and Serving Elevation and Lidar Data Cody Benkelman UC 2018 Outline Usage Modes Data Management - Architecture - Workflow Automation for Repeatability & Scalability A few options Usage Modes of
Title: Improving Your InRoads DTM. Mats Dahlberg Consultant Civil
 Title: Improving Your InRoads DTM Mats Dahlberg Consultant Civil Improving Your InRoads Digital Terrain Model (DTM) Digital Terrain Model A digital representation of a surface topography or terrain composed
National Science Foundation Engineering Research Center. Bingcai Zhang BAE Systems San Diego, CA
 Bingcai Zhang BAE Systems San Diego, CA 92127 Bingcai.zhang@BAESystems.com Introduction It is a trivial task for a five-year-old child to recognize and name an object such as a car, house or building.
2. POINT CLOUD DATA PROCESSING
 Point Cloud Generation from suas-mounted iphone Imagery: Performance Analysis A. D. Ladai, J. Miller Towill, Inc., 2300 Clayton Road, Suite 1200, Concord, CA 94520-2176, USA - (andras.ladai, jeffrey.miller)@towill.com
RASTER ANALYSIS GIS Analysis Winter 2016
 RASTER ANALYSIS GIS Analysis Winter 2016 Raster Data The Basics Raster Data Format Matrix of cells (pixels) organized into rows and columns (grid); each cell contains a value representing information.
Assimilation of Break line and LiDAR Data within ESRI s Terrain Data Structure (TDS) for creating a Multi-Resolution Terrain Model
 for creating a Multi-Resolution Terrain Model") Assimilation of Break line and LiDAR Data within ESRI s Terrain Data Structure (TDS) for creating a Multi-Resolution Terrain Model Tarig A. Ali Department of Civil Engineering American University of Sharjah,
Assimilation of Break line and LiDAR Data within ESRI s Terrain Data Structure (TDS) for creating a Multi-Resolution Terrain Model Tarig A. Ali Department of Civil Engineering American University of Sharjah,
Terrain Modeling and Mapping for Telecom Network Installation Using Scanning Technology. Maziana Muhamad
 Terrain Modeling and Mapping for Telecom Network Installation Using Scanning Technology Maziana Muhamad Summarising LiDAR (Airborne Laser Scanning) LiDAR is a reliable survey technique, capable of: acquiring
LiDAR Technical Report NE Washington LiDAR Production 2017
 LiDAR Technical Report NE Washington LiDAR Production 2017 Presented to: Washington DNR 1111 Washington Street SE Olympia, Washington 98504 Submitted by: 860 McKinley St Eugene, OR 97402 July 26, 2017
Improved Applications with SAMB Derived 3 meter DTMs
 Improved Applications with SAMB Derived 3 meter DTMs Evan J Fedorko West Virginia GIS Technical Center 20 April 2005 This report sums up the processes used to create several products from the Lorado 7
Automated Feature Extraction from Aerial Imagery for Forestry Projects
 Automated Feature Extraction from Aerial Imagery for Forestry Projects Esri UC 2015 UC706 Tuesday July 21 Bart Matthews - Photogrammetrist US Forest Service Southwestern Region Brad Weigle Sr. Program
Applied Cartography and Introduction to GIS GEOG 2017 EL. Lecture-7 Chapters 13 and 14
 Applied Cartography and Introduction to GIS GEOG 2017 EL Lecture-7 Chapters 13 and 14 Data for Terrain Mapping and Analysis DEM (digital elevation model) and TIN (triangulated irregular network) are two
Objectives Learn how GMS uses rasters to support all kinds of digital elevation models and how rasters can be used for interpolation in GMS.
 v. 9.1 GMS 9.1 Tutorial Using rasters for interpolation and visualization in GMS Objectives Learn how GMS uses rasters to support all kinds of digital elevation models and how rasters can be used for interpolation
Digital Raster Acquisition Project Eastern Ontario (DRAPE) 2014 Digital Surface Model and Digital Terrain Model
 2014 Digital Surface Model and Digital Terrain Model") Digital Raster Acquisition Project Eastern Ontario (DRAPE) 2014 Digital Surface Model and Digital Terrain Model User Guide Provincial Mapping Unit Mapping and Information Resources Branch Corporate Management
Digital Raster Acquisition Project Eastern Ontario (DRAPE) 2014 Digital Surface Model and Digital Terrain Model User Guide Provincial Mapping Unit Mapping and Information Resources Branch Corporate Management
FOR 474: Forest Inventory. Plot Level Metrics: Getting at Canopy Heights. Plot Level Metrics: What is the Point Cloud Anyway?
 FOR 474: Forest Inventory Plot Level Metrics from Lidar Heights Other Plot Measures Sources of Error Readings: See Website Plot Level Metrics: Getting at Canopy Heights Heights are an Implicit Output of
Lecture 21 - Chapter 8 (Raster Analysis, part2)
") GEOL 452/552 - GIS for Geoscientists I Lecture 21 - Chapter 8 (Raster Analysis, part2) Today: Digital Elevation Models (DEMs), Topographic functions (surface analysis): slope, aspect hillshade, viewshed,
GEOL 452/552 - GIS for Geoscientists I Lecture 21 - Chapter 8 (Raster Analysis, part2) Today: Digital Elevation Models (DEMs), Topographic functions (surface analysis): slope, aspect hillshade, viewshed,
Exercise 5. Height above Nearest Drainage Flood Inundation Analysis
 Exercise 5. Height above Nearest Drainage Flood Inundation Analysis GIS in Water Resources, Fall 2018 Prepared by David G Tarboton Purpose The purpose of this exercise is to learn how to calculation the
RASTER ANALYSIS S H A W N L. P E N M A N E A R T H D A T A A N A LY S I S C E N T E R U N I V E R S I T Y O F N E W M E X I C O
 RASTER ANALYSIS S H A W N L. P E N M A N E A R T H D A T A A N A LY S I S C E N T E R U N I V E R S I T Y O F N E W M E X I C O TOPICS COVERED Spatial Analyst basics Raster / Vector conversion Raster data
DEM creation using 3D vectors Geomatica 2014 tutorial
 The following tutorial demonstrates how to create a raster digital elevation model (DEM) by interpolating elevation values from millions of points and 3-D structure lines commonly referred to as breaklines.
RASTER ANALYSIS GIS Analysis Fall 2013
 RASTER ANALYSIS GIS Analysis Fall 2013 Raster Data The Basics Raster Data Format Matrix of cells (pixels) organized into rows and columns (grid); each cell contains a value representing information. What
Generate Digital Elevation Models Using Laser Altimetry (LIDAR) Data. Christopher Weed
 Data. Christopher Weed") Generate Digital Elevation Models Using Laser Altimetry (LIDAR) Data Christopher Weed Final Report EE 381K Multidimensional Digital Signal Processing December 11, 2000 Abstract A Laser Altimetry (LIDAR)
Generate Digital Elevation Models Using Laser Altimetry (LIDAR) Data Christopher Weed Final Report EE 381K Multidimensional Digital Signal Processing December 11, 2000 Abstract A Laser Altimetry (LIDAR)
Introduction to 3D Analysis. Jinwu Ma Jie Chang Khalid Duri
 Introduction to 3D Analysis Jinwu Ma Jie Chang Khalid Duri Area & Volume 3D Analyst Features Detect Change Determine Cut/Fill Calculate Surface Area & Volume Data Management Data Creation Data Conversion
MARS v Release Notes Revised: December 20, 2018 (Builds )
") MARS v2019.0 Release Notes Revised: December 20, 2018 (Builds 8399.00 8400.00) Contents New Features:... 2 Enhancements:... 2 List of Bug Fixes... 7 1 STATEMENT OF KNOWN ISSUE: The following Albers coordinate
MARS v2019.0 Release Notes Revised: December 20, 2018 (Builds 8399.00 8400.00) Contents New Features:... 2 Enhancements:... 2 List of Bug Fixes... 7 1 STATEMENT OF KNOWN ISSUE: The following Albers coordinate
Introduction to GIS 2011
 Introduction to GIS 2011 Digital Elevation Models CREATING A TIN SURFACE FROM CONTOUR LINES 1. Start ArcCatalog from either Desktop or Start Menu. 2. In ArcCatalog, create a new folder dem under your c:\introgis_2011
Potential Applications of the new InfoWorks ICM Mesh level Zones
 Introduction Potential Applications of the new InfoWorks ICM Mesh level Zones Exciting new functionality has been added to InfoWorks ICM version 5.5 to allow improved editing of the 2D mesh. The new functionality
GEON Points2Grid Utility Instructions By: Christopher Crosby OpenTopography Facility, San Diego Supercomputer Center
 GEON Points2Grid Utility Instructions By: Christopher Crosby (ccrosby@sdsc.edu) OpenTopography Facility, San Diego Supercomputer Center (Formerly: GEON / Active Tectonics Research Group School of Earth
High Resolution Digital Elevation Model (HRDEM) CanElevation Series Product Specifications. Edition
 CanElevation Series Product Specifications. Edition") High Resolution Digital Elevation Model (HRDEM) CanElevation Series Product Specifications Edition 1.1 2017-08-17 Government of Canada Natural Resources Canada Telephone: +01-819-564-4857 / 1-800-661-2638
High Resolution Digital Elevation Model (HRDEM) CanElevation Series Product Specifications Edition 1.1 2017-08-17 Government of Canada Natural Resources Canada Telephone: +01-819-564-4857 / 1-800-661-2638
Files Used in this Tutorial
 Generate Point Clouds and DSM Tutorial This tutorial shows how to generate point clouds and a digital surface model (DSM) from IKONOS satellite stereo imagery. You will view the resulting point clouds
Lecture 4: Digital Elevation Models
 Lecture 4: Digital Elevation Models GEOG413/613 Dr. Anthony Jjumba 1 Digital Terrain Modeling Terms: DEM, DTM, DTEM, DSM, DHM not synonyms. The concepts they illustrate are different Digital Terrain Modeling