Data Mining Chapter 3: Visualizing and Exploring Data Fall 2011 Ming Li Department of Computer Science and Technology Nanjing University
|
|
|
- Godwin Webster
- 6 years ago
- Views:
Transcription
1 Data Mining Chapter 3: Visualizing and Exploring Data Fall 2011 Ming Li Department of Computer Science and Technology Nanjing University
2 Exploratory data analysis tasks Examine the data, in search of structures that may indicate deeper relationships between instances or attributes A data-driven hypothesis generation process Key point: how to properly describe the data to reveal the characteristics? Data description method: Summarizing data with some statistics Portraying the distribution information of the data set
3 Summarizing data: Location Mean: The average value of a collection of values Median: The value that produces equal number of data points above it and below it Quartile The n-th quatile is the value that is greater than n quarter(s ) of the data points. (n = 1, 2, 3) Percentile The n-th percentile is the value that is greater than n% of the data points (n = 1,, 99)
 The average of the squared differences between the mean and the")
 Does a distribution have a single")
4 Summarizing data: other properties Mode (quantity) The most common values Variance (dispersion) The average of the squared differences between the mean and the individual values Interquartile range (dispersion) The difference between the 1st quartile and the 3rd quartile Skewness (shape) Does a distribution have a single long tail
5 Data visualization: a first step toward data mining Data visualization is an important way for identifying deep relationship Pros straight-forward usually interactive ideal for sifting through data to find unexpected relation Cons requires special people to read the results to find unexpected relation might not be good for large data sets, too many details may shade the interesting patterns
6 Widely used methods for visualization Displaying single attribute Displaying the relationships between two attributes Displaying the relationships between multiple attributes Displaying important structure of data in a reduced number of dimensions


7 Tools for displaying single attribute (I) Histogram The number of different values of a nominal attribute The number of values of an numerical attribute lie in consecutive intervals Random fluctuations and alternative choices for ends may affect the diagram if the data set is small
8 Tools for displaying single attribute (II) Kernel estimates (Density estimation) Spread the contribution of each observed data point into the whole range, K(.) is called kernel function. K(.) is usually a smooth unimodal function with a peak at 0 e.g., The most commonly used form is the Gaussian kernel: The quality depends more on h than the shape of K
9 Tools for displaying single attribute (III) Box plots graphically depicting groups of numerical data through their five-number summaries Five number summary: (Min, Q1, Median, Q3, Max) Max Q3 median Q1 1.5*(Q3-Q1) Functionality : identifying possible outliers Min

 The bimodality (0-1) representation ignores the frequency of certain")
10 Tools for displaying pair of attributes (I) Scatterplot It is a bimodality plot, where each pair of values belonging to the same instance is treated as a 2-d coordinate Functionality: revealing certain the correlation of the two variables Might not be useful especially for large data set (with long-tailed distribution) The bimodality (0-1) representation ignores the frequency of certain coordinate appears.
11 Tools for displaying pair of attributes (II) Contour plot It plots a 2-d density contour with respect to the concerned two variables, where the density is estimated from the observed data points. Functionality: revealing the correlation of two variables in terms of the joint distribution
12 Tools for displaying pair of attributes (III) Loess curve Loess curve is a local regression of the points on scatter plot Functionality: Providing better perception of the pattern of dependence.
 Aligning scatterplots for every pair of")

13 Tools for displaying multiple attributes (I) Scatterplot matrix (pseudo-multivariate) Aligning scatterplots for every pair of attributes Functionality: Revealing certain correlation of any two attributes A pseudo-multivariate tool: since it is multiple bivariate solutions
14 Tools for displaying multiple attributes (II) Trellis plot Fixing a particular pair of attributes that is to be displayed produces a series of scatterplots conditioned on levels of one or more other attributes Functionality: Revealing certain correlation of any two attributes with consideration of other attributes values Considers multivariate to some extent Any type of graph can be used besides scatter plots
15 Tools for displaying multiple attributes (III) Icons plots It represents each instance as a multidimensional symbol Functionality: Providing a selection of instances by revealing its multivariate correlation More difficult to read. Failing to apply to large data set Revealing individual characteristics instead of global distributional information
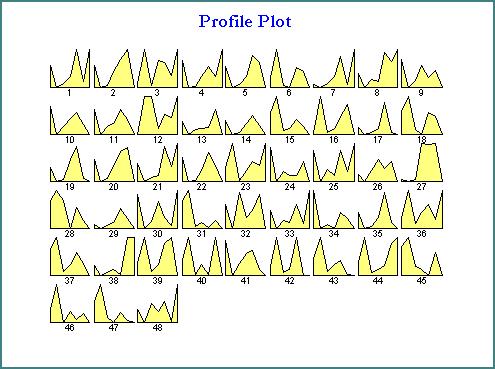
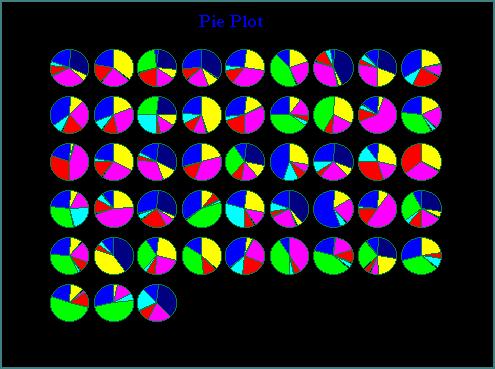
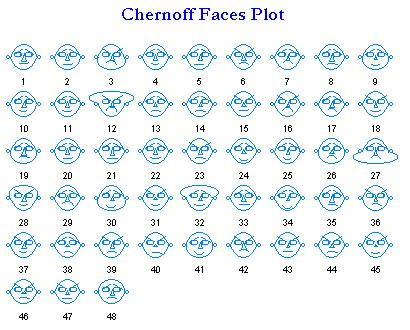
16 Tools for displaying multiple attributes (III) Icons plots

17 Tools for displaying multiple attributes (VI) Parallel coordinates plot It represents each instance as a piecewise linear plot connecting the measured values for that instance Functionality: Providing a selection of instances by revealing its multivariate correlation More difficult to read. Failing to apply to large data set Revealing individual characteristics instead of global distributional information

18 Discovering important structures from data Problems with multivariate plot Difficult to read Failing to capture the global distributional information Failing to scale to large data set Too many details are represented, which shade out the interesting patterns in the data That s it! Find the interesting structures from the data while eliminating unnecessary details
19 Dimensionality reduction Reduce the number of dimensions (attributes) of the data while preserving the intrinsic characteristics of the data Try to identify some hidden aspects that determines the characteristics of the data Linear Method Principal component analysis (PCA) Linear discriminate analysis (LDA) Factor analysis Non-linear method KPCA, KLDA Multidimensional scaling Manifold learning methods
20 Principal component analysis (PCA) What hidden is the interesting aspect that structure control the of data? the data Principal component The spreading tendency
21 Principal component analysis (PCA) Principal component analysis seeks a space of lower dimensionality, in which the variance of the projected data are maximized. try to model how data are spread by maximizing the variance of the projected data find d orthogonal vectors that represent the spread tendency of the data (d << D) the d vectors will be used as the bases of the new space
22 Principal component analysis (PCA) Data representations where, x D n, Projection of a data point Projection of the data set
23 Principal component analysis (PCA) Variance in projected space (The score function) Maximization max w s.t. Solution: (1) by introducing Lagrange multiplier (2) Solve the equation by Eigen decomposition
24 Principal component analysis (PCA) Find d orthogonal principal components It can be shown that the d orthogonal principle components correspond to the d eigen vectors with d largest eigen values Intuitions: Eigen value is the variance of the data projected to the corresponding eigen vector Eigen vectors are essentially orthogonal Determine d What to discard: the eigen vectors with small eigen values Limit the loss of information within an acceptable interval (usually 5%)
25 Principal component analysis (PCA) Conducting PCA 1. Shifting data set to have zeros mean 2. Compute the covariance matrix S 3. Conduct eigen decomposition on S, and rank the eigen vectors according to their eigen values 4. Determine the number of dimensions d of the new space 5. Select the first d eigen vectors with d largest eigen values as the basis of the new space


26 Applications of PCA Visualizing the projected data Data are projected in to 2D or 3D subspace using PCA Visualize the projected data for domain experts For subsequent data mining algorithms E.g. face recognition Eigen face
 plus some random noise The solution is not unique.")
27 Factor analysis It seeks some latent (unobserved) factors that can recover the observed variables with their linear combination. It assumes that the data are determined by these factors (through linear combination) plus some random noise The solution is not unique. Additional constraints should be imposed to obtain unique solution e.g., a widely used constraints forces the elements of Λ to be close to 1or 0, which enables to group attributes
28 Multidimensional scaling It seeks the coordinates in low dimensional space (usually 2D or 3D) by preserving the similarity relationships between data points. Start with a similarity (distance) matrix instead of data points Minimize some pre-defined difference between the similarity in original space and that in the new space The new space can be solved by mathematical projection or direct optimization over the coordinates Remarks Pros: More freedom to make non-linear mapping Cons: limited non-linear since it tries to preserve the similarity relationships between an instance to all other instances


29 Isometric feature mapping (ISOMAP) It seeks a low dimensional embedding of data such that the distance in the new space roughly equals the geodesic distances constructed through neighborhoods of instances Key step: Find the shortest path between any two points on a neighborhood graph

30 Let s move to Chapter 4
Dimension Reduction CS534
 Dimension Reduction CS534 Why dimension reduction? High dimensionality large number of features E.g., documents represented by thousands of words, millions of bigrams Images represented by thousands of
Visualizing and Exploring Data
 Visualizing and Exploring Data Sargur University at Buffalo The State University of New York Visual Methods for finding structures in data Power of human eye/brain to detect structures Product of eons
Lecture 3 Questions that we should be able to answer by the end of this lecture:
 Lecture 3 Questions that we should be able to answer by the end of this lecture: Which is the better exam score? 67 on an exam with mean 50 and SD 10 or 62 on an exam with mean 40 and SD 12 Is it fair
Lecture 3 Questions that we should be able to answer by the end of this lecture:
 Lecture 3 Questions that we should be able to answer by the end of this lecture: Which is the better exam score? 67 on an exam with mean 50 and SD 10 or 62 on an exam with mean 40 and SD 12 Is it fair
CSE 6242 A / CX 4242 DVA. March 6, Dimension Reduction. Guest Lecturer: Jaegul Choo
 CSE 6242 A / CX 4242 DVA March 6, 2014 Dimension Reduction Guest Lecturer: Jaegul Choo Data is Too Big To Analyze! Limited memory size! Data may not be fitted to the memory of your machine! Slow computation!
Chapter 1. Looking at Data-Distribution
 Chapter 1. Looking at Data-Distribution Statistics is the scientific discipline that provides methods to draw right conclusions: 1)Collecting the data 2)Describing the data 3)Drawing the conclusions Raw
Data Mining. CS57300 Purdue University. Bruno Ribeiro. February 1st, 2018
 Data Mining CS57300 Purdue University Bruno Ribeiro February 1st, 2018 1 Exploratory Data Analysis & Feature Construction How to explore a dataset Understanding the variables (values, ranges, and empirical
Acquisition Description Exploration Examination Understanding what data is collected. Characterizing properties of data.
 Summary Statistics Acquisition Description Exploration Examination what data is collected Characterizing properties of data. Exploring the data distribution(s). Identifying data quality problems. Selecting
Measures of Central Tendency. A measure of central tendency is a value used to represent the typical or average value in a data set.
 Measures of Central Tendency A measure of central tendency is a value used to represent the typical or average value in a data set. The Mean the sum of all data values divided by the number of values in
CSE 6242 A / CS 4803 DVA. Feb 12, Dimension Reduction. Guest Lecturer: Jaegul Choo
 CSE 6242 A / CS 4803 DVA Feb 12, 2013 Dimension Reduction Guest Lecturer: Jaegul Choo CSE 6242 A / CS 4803 DVA Feb 12, 2013 Dimension Reduction Guest Lecturer: Jaegul Choo Data is Too Big To Do Something..
Further Maths Notes. Common Mistakes. Read the bold words in the exam! Always check data entry. Write equations in terms of variables
 Further Maths Notes Common Mistakes Read the bold words in the exam! Always check data entry Remember to interpret data with the multipliers specified (e.g. in thousands) Write equations in terms of variables
Part I, Chapters 4 & 5. Data Tables and Data Analysis Statistics and Figures
 Part I, Chapters 4 & 5 Data Tables and Data Analysis Statistics and Figures Descriptive Statistics 1 Are data points clumped? (order variable / exp. variable) Concentrated around one value? Concentrated
Vocabulary. 5-number summary Rule. Area principle. Bar chart. Boxplot. Categorical data condition. Categorical variable.
 5-number summary 68-95-99.7 Rule Area principle Bar chart Bimodal Boxplot Case Categorical data Categorical variable Center Changing center and spread Conditional distribution Context Contingency table
Measures of Central Tendency
 Page of 6 Measures of Central Tendency A measure of central tendency is a value used to represent the typical or average value in a data set. The Mean The sum of all data values divided by the number of
Table of Contents (As covered from textbook)
") Table of Contents (As covered from textbook) Ch 1 Data and Decisions Ch 2 Displaying and Describing Categorical Data Ch 3 Displaying and Describing Quantitative Data Ch 4 Correlation and Linear Regression
Table of Contents (As covered from textbook) Ch 1 Data and Decisions Ch 2 Displaying and Describing Categorical Data Ch 3 Displaying and Describing Quantitative Data Ch 4 Correlation and Linear Regression
Density Curve (p52) Density curve is a curve that - is always on or above the horizontal axis.
 Density curve is a curve that - is always on or above the horizontal axis.") 1.3 Density curves p50 Some times the overall pattern of a large number of observations is so regular that we can describe it by a smooth curve. It is easier to work with a smooth curve, because the histogram
1.3 Density curves p50 Some times the overall pattern of a large number of observations is so regular that we can describe it by a smooth curve. It is easier to work with a smooth curve, because the histogram
Frequency Distributions
 Displaying Data Frequency Distributions After collecting data, the first task for a researcher is to organize and summarize the data so that it is possible to get a general overview of the results. Remember,
CSE 6242 / CX October 9, Dimension Reduction. Guest Lecturer: Jaegul Choo
 CSE 6242 / CX 4242 October 9, 2014 Dimension Reduction Guest Lecturer: Jaegul Choo Volume Variety Big Data Era 2 Velocity Veracity 3 Big Data are High-Dimensional Examples of High-Dimensional Data Image
CHAPTER-13. Mining Class Comparisons: Discrimination between DifferentClasses: 13.4 Class Description: Presentation of Both Characterization and
 CHAPTER-13 Mining Class Comparisons: Discrimination between DifferentClasses: 13.1 Introduction 13.2 Class Comparison Methods and Implementation 13.3 Presentation of Class Comparison Descriptions 13.4
Learner Expectations UNIT 1: GRAPICAL AND NUMERIC REPRESENTATIONS OF DATA. Sept. Fathom Lab: Distributions and Best Methods of Display
 CURRICULUM MAP TEMPLATE Priority Standards = Approximately 70% Supporting Standards = Approximately 20% Additional Standards = Approximately 10% HONORS PROBABILITY AND STATISTICS Essential Questions &
Data Preprocessing. S1 Teknik Informatika Fakultas Teknologi Informasi Universitas Kristen Maranatha
 Data Preprocessing S1 Teknik Informatika Fakultas Teknologi Informasi Universitas Kristen Maranatha 1 Why Data Preprocessing? Data in the real world is dirty incomplete: lacking attribute values, lacking
ECLT 5810 Data Preprocessing. Prof. Wai Lam
 ECLT 5810 Data Preprocessing Prof. Wai Lam Why Data Preprocessing? Data in the real world is imperfect incomplete: lacking attribute values, lacking certain attributes of interest, or containing only aggregate
Modelling and Visualization of High Dimensional Data. Sample Examination Paper
 Duration not specified UNIVERSITY OF MANCHESTER SCHOOL OF COMPUTER SCIENCE Modelling and Visualization of High Dimensional Data Sample Examination Paper Examination date not specified Time: Examination
Averages and Variation
 Averages and Variation 3 Copyright Cengage Learning. All rights reserved. 3.1-1 Section 3.1 Measures of Central Tendency: Mode, Median, and Mean Copyright Cengage Learning. All rights reserved. 3.1-2 Focus
STA Module 2B Organizing Data and Comparing Distributions (Part II)
") STA 2023 Module 2B Organizing Data and Comparing Distributions (Part II) Learning Objectives Upon completing this module, you should be able to 1 Explain the purpose of a measure of center 2 Obtain and
STA 2023 Module 2B Organizing Data and Comparing Distributions (Part II) Learning Objectives Upon completing this module, you should be able to 1 Explain the purpose of a measure of center 2 Obtain and
STA Learning Objectives. Learning Objectives (cont.) Module 2B Organizing Data and Comparing Distributions (Part II)
 Module 2B Organizing Data and Comparing Distributions (Part II)") STA 2023 Module 2B Organizing Data and Comparing Distributions (Part II) Learning Objectives Upon completing this module, you should be able to 1 Explain the purpose of a measure of center 2 Obtain and
STA 2023 Module 2B Organizing Data and Comparing Distributions (Part II) Learning Objectives Upon completing this module, you should be able to 1 Explain the purpose of a measure of center 2 Obtain and
CIE L*a*b* color model
 CIE L*a*b* color model To further strengthen the correlation between the color model and human perception, we apply the following non-linear transformation: with where (X n,y n,z n ) are the tristimulus
Visual Analytics. Visualizing multivariate data:
 Visual Analytics 1 Visualizing multivariate data: High density time-series plots Scatterplot matrices Parallel coordinate plots Temporal and spectral correlation plots Box plots Wavelets Radar and /or
CHAPTER 3: Data Description
 CHAPTER 3: Data Description You ve tabulated and made pretty pictures. Now what numbers do you use to summarize your data? Ch3: Data Description Santorico Page 68 You ll find a link on our website to a
Chapter 3 - Displaying and Summarizing Quantitative Data
 Chapter 3 - Displaying and Summarizing Quantitative Data 3.1 Graphs for Quantitative Data (LABEL GRAPHS) August 25, 2014 Histogram (p. 44) - Graph that uses bars to represent different frequencies or relative
Exploratory Data Analysis EDA
 Exploratory Data Analysis EDA Luc Anselin http://spatial.uchicago.edu 1 from EDA to ESDA dynamic graphics primer on multivariate EDA interpretation and limitations 2 From EDA to ESDA 3 Exploratory Data
STA Rev. F Learning Objectives. Learning Objectives (Cont.) Module 3 Descriptive Measures
 Module 3 Descriptive Measures") STA 2023 Module 3 Descriptive Measures Learning Objectives Upon completing this module, you should be able to: 1. Explain the purpose of a measure of center. 2. Obtain and interpret the mean, median, and
STA 2023 Module 3 Descriptive Measures Learning Objectives Upon completing this module, you should be able to: 1. Explain the purpose of a measure of center. 2. Obtain and interpret the mean, median, and
Data Preprocessing. Javier Béjar. URL - Spring 2018 CS - MAI 1/78 BY: $\
 Data Preprocessing Javier Béjar BY: $\ URL - Spring 2018 C CS - MAI 1/78 Introduction Data representation Unstructured datasets: Examples described by a flat set of attributes: attribute-value matrix Structured
Data Mining and Analytics. Introduction
 Data Mining and Analytics Introduction Data Mining Data mining refers to extracting or mining knowledge from large amounts of data It is also termed as Knowledge Discovery from Data (KDD) Mostly, data
1.3 Graphical Summaries of Data
 Arkansas Tech University MATH 3513: Applied Statistics I Dr. Marcel B. Finan 1.3 Graphical Summaries of Data In the previous section we discussed numerical summaries of either a sample or a data. In this
Exploring and Understanding Data Using R.
 Exploring and Understanding Data Using R. Loading the data into an R data frame: variable
Chapter 5: The standard deviation as a ruler and the normal model p131
 Chapter 5: The standard deviation as a ruler and the normal model p131 Which is the better exam score? 67 on an exam with mean 50 and SD 10 62 on an exam with mean 40 and SD 12? Is it fair to say: 67 is
Chapter 2 Modeling Distributions of Data
 Chapter 2 Modeling Distributions of Data Section 2.1 Describing Location in a Distribution Describing Location in a Distribution Learning Objectives After this section, you should be able to: FIND and
Chapter 2 Describing, Exploring, and Comparing Data
 Slide 1 Chapter 2 Describing, Exploring, and Comparing Data Slide 2 2-1 Overview 2-2 Frequency Distributions 2-3 Visualizing Data 2-4 Measures of Center 2-5 Measures of Variation 2-6 Measures of Relative
Statistical Analysis of Metabolomics Data. Xiuxia Du Department of Bioinformatics & Genomics University of North Carolina at Charlotte
 Statistical Analysis of Metabolomics Data Xiuxia Du Department of Bioinformatics & Genomics University of North Carolina at Charlotte Outline Introduction Data pre-treatment 1. Normalization 2. Centering,
Preprocessing and Visualization. Jonathan Diehl
 RWTH Aachen University Chair of Computer Science VI Prof. Dr.-Ing. Hermann Ney Seminar Data Mining WS 2003/2004 Preprocessing and Visualization Jonathan Diehl January 19, 2004 onathan Diehl Preprocessing
Discriminate Analysis
 Discriminate Analysis Outline Introduction Linear Discriminant Analysis Examples 1 Introduction What is Discriminant Analysis? Statistical technique to classify objects into mutually exclusive and exhaustive
Network Traffic Measurements and Analysis
 DEIB - Politecnico di Milano Fall, 2017 Introduction Often, we have only a set of features x = x 1, x 2,, x n, but no associated response y. Therefore we are not interested in prediction nor classification,
10.4 Measures of Central Tendency and Variation
 10.4 Measures of Central Tendency and Variation Mode-->The number that occurs most frequently; there can be more than one mode ; if each number appears equally often, then there is no mode at all. (mode
10.4 Measures of Central Tendency and Variation
 10.4 Measures of Central Tendency and Variation Mode-->The number that occurs most frequently; there can be more than one mode ; if each number appears equally often, then there is no mode at all. (mode
The first few questions on this worksheet will deal with measures of central tendency. These data types tell us where the center of the data set lies.
 Instructions: You are given the following data below these instructions. Your client (Courtney) wants you to statistically analyze the data to help her reach conclusions about how well she is teaching.
Resting state network estimation in individual subjects
 Resting state network estimation in individual subjects Data 3T NIL(21,17,10), Havard-MGH(692) Young adult fmri BOLD Method Machine learning algorithm MLP DR LDA Network image Correlation Spatial Temporal
Dimension Reduction of Image Manifolds
 Dimension Reduction of Image Manifolds Arian Maleki Department of Electrical Engineering Stanford University Stanford, CA, 9435, USA E-mail: arianm@stanford.edu I. INTRODUCTION Dimension reduction of datasets
Data Preprocessing. Javier Béjar AMLT /2017 CS - MAI. (CS - MAI) Data Preprocessing AMLT / / 71 BY: $\
 Data Preprocessing AMLT / / 71 BY: $\") Data Preprocessing S - MAI AMLT - 2016/2017 (S - MAI) Data Preprocessing AMLT - 2016/2017 1 / 71 Outline 1 Introduction Data Representation 2 Data Preprocessing Outliers Missing Values Normalization Discretization
Data Preprocessing S - MAI AMLT - 2016/2017 (S - MAI) Data Preprocessing AMLT - 2016/2017 1 / 71 Outline 1 Introduction Data Representation 2 Data Preprocessing Outliers Missing Values Normalization Discretization
Math 120 Introduction to Statistics Mr. Toner s Lecture Notes 3.1 Measures of Central Tendency
 Math 1 Introduction to Statistics Mr. Toner s Lecture Notes 3.1 Measures of Central Tendency lowest value + highest value midrange The word average: is very ambiguous and can actually refer to the mean,
Preprocessing and Visualization. Jonathan Diehl
 RWTH Aachen University Chair of Computer Science VI Prof.Dr.-Ing.HermannNey Seminar Data Mining in WS 2003 / 2004 Preprocessing and Visualization Jonathan Diehl Matrikelnummer 235087 January 19, 2004 Tutor:
Clustering and Visualisation of Data
 Clustering and Visualisation of Data Hiroshi Shimodaira January-March 28 Cluster analysis aims to partition a data set into meaningful or useful groups, based on distances between data points. In some
Chapter 6: DESCRIPTIVE STATISTICS
 Chapter 6: DESCRIPTIVE STATISTICS Random Sampling Numerical Summaries Stem-n-Leaf plots Histograms, and Box plots Time Sequence Plots Normal Probability Plots Sections 6-1 to 6-5, and 6-7 Random Sampling
Measures of Dispersion
 Measures of Dispersion 6-3 I Will... Find measures of dispersion of sets of data. Find standard deviation and analyze normal distribution. Day 1: Dispersion Vocabulary Measures of Variation (Dispersion
Non-linear dimension reduction
 Sta306b May 23, 2011 Dimension Reduction: 1 Non-linear dimension reduction ISOMAP: Tenenbaum, de Silva & Langford (2000) Local linear embedding: Roweis & Saul (2000) Local MDS: Chen (2006) all three methods
CPSC 340: Machine Learning and Data Mining. Multi-Dimensional Scaling Fall 2017
 CPSC 340: Machine Learning and Data Mining Multi-Dimensional Scaling Fall 2017 Assignment 4: Admin 1 late day for tonight, 2 late days for Wednesday. Assignment 5: Due Monday of next week. Final: Details
Using the DATAMINE Program
 6 Using the DATAMINE Program 304 Using the DATAMINE Program This chapter serves as a user s manual for the DATAMINE program, which demonstrates the algorithms presented in this book. Each menu selection
CS6220: DATA MINING TECHNIQUES
 CS6220: DATA MINING TECHNIQUES 2: Data Pre-Processing Instructor: Yizhou Sun yzsun@ccs.neu.edu September 10, 2013 2: Data Pre-Processing Getting to know your data Basic Statistical Descriptions of Data
Last time... Bias-Variance decomposition. This week
 Machine learning, pattern recognition and statistical data modelling Lecture 4. Going nonlinear: basis expansions and splines Last time... Coryn Bailer-Jones linear regression methods for high dimensional
Week 7 Picturing Network. Vahe and Bethany
 Week 7 Picturing Network Vahe and Bethany Freeman (2005) - Graphic Techniques for Exploring Social Network Data The two main goals of analyzing social network data are identification of cohesive groups
( ) =cov X Y = W PRINCIPAL COMPONENT ANALYSIS. Eigenvectors of the covariance matrix are the principal components
 =cov X Y = W PRINCIPAL COMPONENT ANALYSIS. Eigenvectors of the covariance matrix are the principal components") Review Lecture 14 ! PRINCIPAL COMPONENT ANALYSIS Eigenvectors of the covariance matrix are the principal components 1. =cov X Top K principal components are the eigenvectors with K largest eigenvalues
Review Lecture 14 ! PRINCIPAL COMPONENT ANALYSIS Eigenvectors of the covariance matrix are the principal components 1. =cov X Top K principal components are the eigenvectors with K largest eigenvalues
CHAPTER 1. Introduction. Statistics: Statistics is the science of collecting, organizing, analyzing, presenting and interpreting data.
 1 CHAPTER 1 Introduction Statistics: Statistics is the science of collecting, organizing, analyzing, presenting and interpreting data. Variable: Any characteristic of a person or thing that can be expressed
IT 403 Practice Problems (1-2) Answers
 Answers") IT 403 Practice Problems (1-2) Answers #1. Using Tukey's Hinges method ('Inclusionary'), what is Q3 for this dataset? 2 3 5 7 11 13 17 a. 7 b. 11 c. 12 d. 15 c (12) #2. How do quartiles and percentiles
IT 403 Practice Problems (1-2) Answers #1. Using Tukey's Hinges method ('Inclusionary'), what is Q3 for this dataset? 2 3 5 7 11 13 17 a. 7 b. 11 c. 12 d. 15 c (12) #2. How do quartiles and percentiles
CREATING THE DISTRIBUTION ANALYSIS
 Chapter 12 Examining Distributions Chapter Table of Contents CREATING THE DISTRIBUTION ANALYSIS...176 BoxPlot...178 Histogram...180 Moments and Quantiles Tables...... 183 ADDING DENSITY ESTIMATES...184
8: Statistics. Populations and Samples. Histograms and Frequency Polygons. Page 1 of 10
 8: Statistics Statistics: Method of collecting, organizing, analyzing, and interpreting data, as well as drawing conclusions based on the data. Methodology is divided into two main areas. Descriptive Statistics:
CPSC 340: Machine Learning and Data Mining. Principal Component Analysis Fall 2016
 CPSC 340: Machine Learning and Data Mining Principal Component Analysis Fall 2016 A2/Midterm: Admin Grades/solutions will be posted after class. Assignment 4: Posted, due November 14. Extra office hours:
Lecture Topic Projects
 Lecture Topic Projects 1 Intro, schedule, and logistics 2 Applications of visual analytics, basic tasks, data types 3 Introduction to D3, basic vis techniques for non-spatial data Project #1 out 4 Data
Road Map. Data types Measuring data Data cleaning Data integration Data transformation Data reduction Data discretization Summary
 2. Data preprocessing Road Map Data types Measuring data Data cleaning Data integration Data transformation Data reduction Data discretization Summary 2 Data types Categorical vs. Numerical Scale types
/4 Directions: Graph the functions, then answer the following question.
 1.) Graph y = x. Label the graph. Standard: F-BF.3 Identify the effect on the graph of replacing f(x) by f(x) +k, k f(x), f(kx), and f(x+k), for specific values of k; find the value of k given the graphs.
Chapter 5. Normal. Normal Curve. the Normal. Curve Examples. Standard Units Standard Units Examples. for Data
 curve Approximation Part II Descriptive Statistics The Approximation Approximation The famous normal curve can often be used as an 'ideal' histogram, to which histograms for data can be compared. Its equation
M7D1.a: Formulate questions and collect data from a census of at least 30 objects and from samples of varying sizes.
 M7D1.a: Formulate questions and collect data from a census of at least 30 objects and from samples of varying sizes. Population: Census: Biased: Sample: The entire group of objects or individuals considered
AP Statistics Summer Assignment:
 AP Statistics Summer Assignment: Read the following and use the information to help answer your summer assignment questions. You will be responsible for knowing all of the information contained in this
Part I. Graphical exploratory data analysis. Graphical summaries of data. Graphical summaries of data
 Week 3 Based in part on slides from textbook, slides of Susan Holmes Part I Graphical exploratory data analysis October 10, 2012 1 / 1 2 / 1 Graphical summaries of data Graphical summaries of data Exploratory
Lecture Notes 3: Data summarization
 Lecture Notes 3: Data summarization Highlights: Average Median Quartiles 5-number summary (and relation to boxplots) Outliers Range & IQR Variance and standard deviation Determining shape using mean &
The Role of Manifold Learning in Human Motion Analysis
 The Role of Manifold Learning in Human Motion Analysis Ahmed Elgammal and Chan Su Lee Department of Computer Science, Rutgers University, Piscataway, NJ, USA {elgammal,chansu}@cs.rutgers.edu Abstract.
Regression III: Advanced Methods
 Lecture 3: Distributions Regression III: Advanced Methods William G. Jacoby Michigan State University Goals of the lecture Examine data in graphical form Graphs for looking at univariate distributions
Data Mining: Concepts and Techniques
 Data Mining: Concepts and Techniques Chapter 2 Original Slides: Jiawei Han and Micheline Kamber Modification: Li Xiong Data Mining: Concepts and Techniques 1 Chapter 2: Data Preprocessing Why preprocess
Applied Regression Modeling: A Business Approach
 i Applied Regression Modeling: A Business Approach Computer software help: SAS SAS (originally Statistical Analysis Software ) is a commercial statistical software package based on a powerful programming
Courtesy of Prof. Shixia University
 Courtesy of Prof. Shixia Liu @Tsinghua University Outline Introduction Classification of Techniques Table Scatter Plot Matrices Projections Parallel Coordinates Summary Motivation Real world data contain
Ex.1 constructing tables. a) find the joint relative frequency of males who have a bachelors degree.
 find the joint relative frequency of males who have a bachelors degree.") Two-way Frequency Tables two way frequency table- a table that divides responses into categories. Joint relative frequency- the number of times a specific response is given divided by the sample. Marginal
Two-way Frequency Tables two way frequency table- a table that divides responses into categories. Joint relative frequency- the number of times a specific response is given divided by the sample. Marginal
Applications. Foreground / background segmentation Finding skin-colored regions. Finding the moving objects. Intelligent scissors
 Segmentation I Goal Separate image into coherent regions Berkeley segmentation database: http://www.eecs.berkeley.edu/research/projects/cs/vision/grouping/segbench/ Slide by L. Lazebnik Applications Intelligent
Scaling Techniques in Political Science
 Scaling Techniques in Political Science Eric Guntermann March 14th, 2014 Eric Guntermann Scaling Techniques in Political Science March 14th, 2014 1 / 19 What you need R RStudio R code file Datasets You
Grundlagen der Künstlichen Intelligenz
 Grundlagen der Künstlichen Intelligenz Unsupervised learning Daniel Hennes 29.01.2018 (WS 2017/18) University Stuttgart - IPVS - Machine Learning & Robotics 1 Today Supervised learning Regression (linear
Points Lines Connected points X-Y Scatter. X-Y Matrix Star Plot Histogram Box Plot. Bar Group Bar Stacked H-Bar Grouped H-Bar Stacked
 Plotting Menu: QCExpert Plotting Module graphs offers various tools for visualization of uni- and multivariate data. Settings and options in different types of graphs allow for modifications and customizations
FMA901F: Machine Learning Lecture 3: Linear Models for Regression. Cristian Sminchisescu
 FMA901F: Machine Learning Lecture 3: Linear Models for Regression Cristian Sminchisescu Machine Learning: Frequentist vs. Bayesian In the frequentist setting, we seek a fixed parameter (vector), with value(s)
MULTIVARIATE TEXTURE DISCRIMINATION USING A PRINCIPAL GEODESIC CLASSIFIER
 MULTIVARIATE TEXTURE DISCRIMINATION USING A PRINCIPAL GEODESIC CLASSIFIER A.Shabbir 1, 2 and G.Verdoolaege 1, 3 1 Department of Applied Physics, Ghent University, B-9000 Ghent, Belgium 2 Max Planck Institute
Page 1. Graphical and Numerical Statistics
 TOPIC: Description Statistics In this tutorial, we show how to use MINITAB to produce descriptive statistics, both graphical and numerical, for an existing MINITAB dataset. The example data come from Exercise
STA Module 4 The Normal Distribution
 STA 2023 Module 4 The Normal Distribution Learning Objectives Upon completing this module, you should be able to 1. Explain what it means for a variable to be normally distributed or approximately normally
STA /25/12. Module 4 The Normal Distribution. Learning Objectives. Let s Look at Some Examples of Normal Curves
 STA 2023 Module 4 The Normal Distribution Learning Objectives Upon completing this module, you should be able to 1. Explain what it means for a variable to be normally distributed or approximately normally
MHPE 494: Data Analysis. Welcome! The Analytic Process
 MHPE 494: Data Analysis Alan Schwartz, PhD Department of Medical Education Memoona Hasnain,, MD, PhD, MHPE Department of Family Medicine College of Medicine University of Illinois at Chicago Welcome! Your
Understanding Clustering Supervising the unsupervised
 Understanding Clustering Supervising the unsupervised Janu Verma IBM T.J. Watson Research Center, New York http://jverma.github.io/ jverma@us.ibm.com @januverma Clustering Grouping together similar data
Data Mining Chapter 9: Descriptive Modeling Fall 2011 Ming Li Department of Computer Science and Technology Nanjing University
 Data Mining Chapter 9: Descriptive Modeling Fall 2011 Ming Li Department of Computer Science and Technology Nanjing University Descriptive model A descriptive model presents the main features of the data
UNIT 2 Data Preprocessing
 UNIT 2 Data Preprocessing Lecture Topic ********************************************** Lecture 13 Why preprocess the data? Lecture 14 Lecture 15 Lecture 16 Lecture 17 Data cleaning Data integration and
15 Wyner Statistics Fall 2013
 15 Wyner Statistics Fall 2013 CHAPTER THREE: CENTRAL TENDENCY AND VARIATION Summary, Terms, and Objectives The two most important aspects of a numerical data set are its central tendencies and its variation.
CS 521 Data Mining Techniques Instructor: Abdullah Mueen
 CS 521 Data Mining Techniques Instructor: Abdullah Mueen LECTURE 2: DATA TRANSFORMATION AND DIMENSIONALITY REDUCTION Chapter 3: Data Preprocessing Data Preprocessing: An Overview Data Quality Major Tasks
3. Data Preprocessing. 3.1 Introduction
 3. Data Preprocessing Contents of this Chapter 3.1 Introduction 3.2 Data cleaning 3.3 Data integration 3.4 Data transformation 3.5 Data reduction SFU, CMPT 740, 03-3, Martin Ester 84 3.1 Introduction Motivation
LAB 1 INSTRUCTIONS DESCRIBING AND DISPLAYING DATA
 LAB 1 INSTRUCTIONS DESCRIBING AND DISPLAYING DATA This lab will assist you in learning how to summarize and display categorical and quantitative data in StatCrunch. In particular, you will learn how to
Name: Date: Period: Chapter 2. Section 1: Describing Location in a Distribution
 Name: Date: Period: Chapter 2 Section 1: Describing Location in a Distribution Suppose you earned an 86 on a statistics quiz. The question is: should you be satisfied with this score? What if it is the
2. Data Preprocessing
 2. Data Preprocessing Contents of this Chapter 2.1 Introduction 2.2 Data cleaning 2.3 Data integration 2.4 Data transformation 2.5 Data reduction Reference: [Han and Kamber 2006, Chapter 2] SFU, CMPT 459
Unsupervised Learning
 Unsupervised Learning Learning without Class Labels (or correct outputs) Density Estimation Learn P(X) given training data for X Clustering Partition data into clusters Dimensionality Reduction Discover