Engineering Geology. Engineering Geology is backbone of civil engineering. Topographic Maps. Eng. Iqbal Marie
|
|
|
- Evangeline Alexander
- 6 years ago
- Views:
Transcription

1 Engineering Geology Engineering Geology is backbone of civil engineering Topographic Maps Eng. Iqbal Marie
2 Maps: are a two dimensional representation, of an area or region. There are many types of maps, each with a specific function. As an example: Bathymetric maps, illustrate the topography of the ocean floor topographic maps show the topography of the earth s surface above sea level. Street maps show the locations of streets, highways and roads. Demographic maps: used to show statistical changes in a population (age, race, education, etc) for a specific region. geologic maps: shows the distribution of various types of bedrock in an area maps may vary in content, scale, and size, they all have several things in common: publishing information (title, the author of the map, year printed), the contour interval, the scale of the map, a North indicator, and a legend stating what each of the symbols and lines on the map represent.
3 A geologic map involves three levels of information: 1. The information that any map needs to function as a scale model of the world, including A scale : compares distances on the map with distances on earth. An indication of the location in the real world that it represents. Representations of roads, bodies of water, buildings, etc. 2. Information about the surface topography of the mapped region: Topographic counter lines 3. Information about the bedrock: The identity of the rocks The orientation of strata The presence of structures such as faults, folds, domes, and basins. 4. Outcrops: are those places where a geologic formation is exposed at the Earth s surface.


4 contour map: consists of lines. Each of these lines, called contour line, which is a line along which some quantity (temperature, for example) is everywhere the same. Contour lines bear more specific names depending on what quantity the contour map shows: isolines Each contour line has a value associated with it and is usually labeled with that value. Contour maps show contour lines with values at regular intervals, including some standard reference value. The contour interval is arbitrary but should be chosen so that the contour map shows enough contours to reveal the pattern clearly without being crowded with too many contour lines contour map should always include a title or caption that identifies the quantity shown and the contour interval used.

5 What is a geological map used for? a geological map is to indicate the nature of the near-surface bedrock. This is of great importance to : civil engineers who, for example, have to advise on the excavation of road cuttings or geographers studying the use of land and companies exploiting minerals.


.")
6 A topographic map: known as a contour map, It shows the shape of the land using contour line,that connect points of equal elevation; The dip is the slope of a geological surface. There are two aspects to the dip of a plane: the direction of dip, which is the compass direction towards which the plane slopes; and the angle of dip, which is the angle that the plane makes with a horizontal plane contour interval: The vertical distance between contour lines and is an even number such as 10, 50, or 100 feet (or meters). * a contour interval is not the distance between the two lines to get the distance you need to use the map scale.

7 Contour lines are generally drawn as black or brown lines on a map. Usually, every 5th contour is printed with heavier print than the others and is labeled with the elevation of the contour above sea level it is called an index contour line. Elevations of single points that have been accurately surveyed to the nearest foot are also shown. These points, called a bench mark or B.M., have been surveyed by a survey crew and are usually set on the Earth s surface in the field with an approximately 3 inch diameter brass marker set in concrete. Bench marks are stamped with the date of construction and survey, as well as the elevation of a mark on the brass plate.
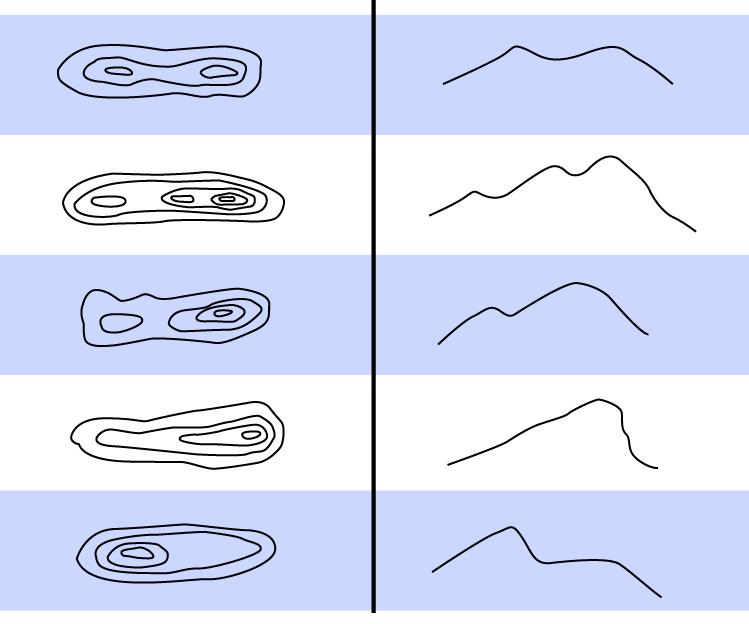
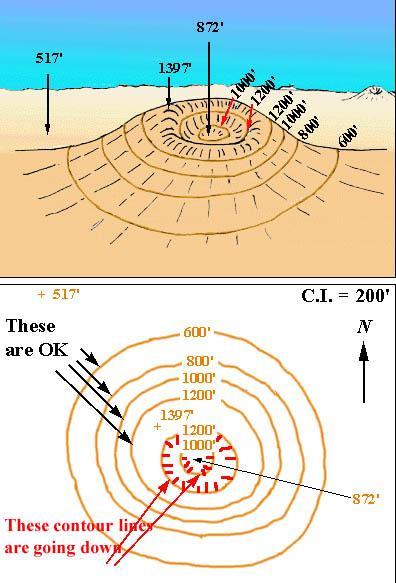
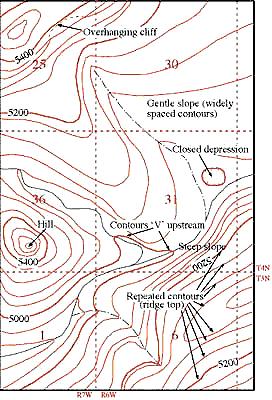
8 Characteristics of contour lines 1. Contour lines are continuous. 2. A series of V-shape indicates a valley and the V s point to higher elevation. 3. A series U shape indicates a ridge. The U shapes will point to lower elevation. 4. Evenly spaced lines indicate an area of uniform slope. 5. A series of closed contours with increasing elevation indicates a hill and a series of closed contours with decreasing elevation indicates a depression. 6. Closed contours may be identified with a +, hill, or -, depression. 7. Closed contours may include hachure marks. Hachures are short lines perpendicular to the contour line. They point to lower elevation. 8. Common practice is to identify the major elevations lines, or every fifth line, with a bolder, wider, line. index contour line 9. When contour lines overlap, the lower elevation contour should be dashed for the duration of the overlap. 10. If the contour lines are close together, then that indicates that area has a steep slope


9 The rule of V's: sharp-pointed vees usually are in stream valleys, with the drainage channel passing through the point of the vee, with the vee pointing upstream. This is a consequence of erosion.
10 Elevation from Contours Elevations of points between contours can be determined by interpolation. Elevation = x = = or 169 ft 0.75 x
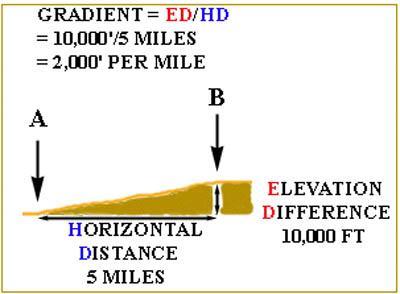
11 Slope from Contours The percent slope can be determined from the contour lines on a topographic map as: Rise % slope = Run x 100 Eg. Rise = = 50 ft Run = in x 1,000 ft/in 200 ft -150 ft % slope = x ft = 1.9 %
12
13 Interpolation by Calculation and measurement
14

15 Geologic cross sections The cross section represents a plane perpendicular to horizontal. It's location is indicated by a line A A' on the geologic map to which it refers. If more than one cross section is indicated on the map, the second might be B to B', etc.

16 Topographic Profile A topographic profile shows the intersection of the land surface with a vertical plane. Such views of the land surface can be seen in road-cuts, quarries,
17
18 Colors indications on contour maps. Water is shown in blue. Densely populated areas are shown in gray or pink. Wooded areas are in green and open areas in white. Individual buildings are solid black shapes.
19
20
21

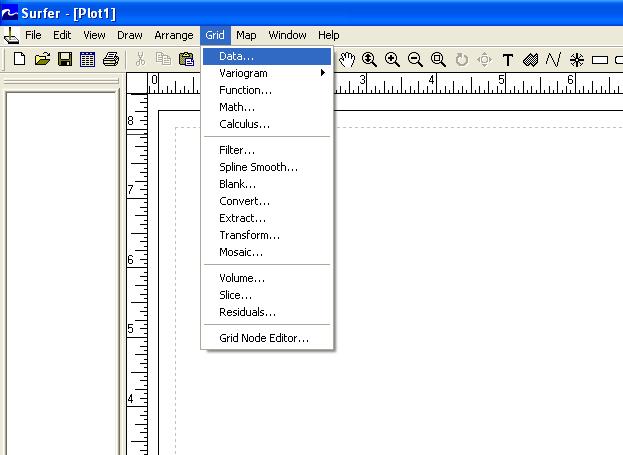
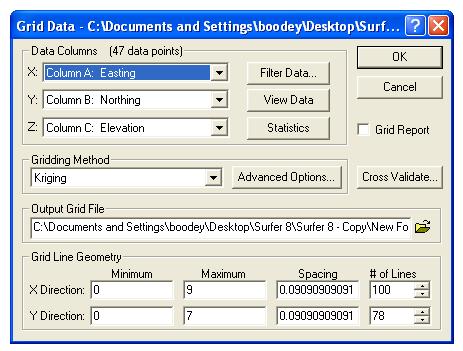
22 Surfer Software Surfer s outstanding gridding and contouring capabilities have made Surfer the software of choice for working with XYZ data.
23 File Types: four basic file types: data, grid, boundary, and Surfer.SRF files.


24 Exporting 3D Contours When you have completed a contour map in the plot window, you can export the contour lines with associated Z values to an AutoCAD DXF file. Choose Map Contour Map Export Contours

25 Surfer s outstanding gridding and contouring capabilities have made Surfer the software of choice for working with XYZ data. File Types: four basic file types: data, grid, boundary, and Surfer.SRF files.
26
 is represented by lines of equal value.")
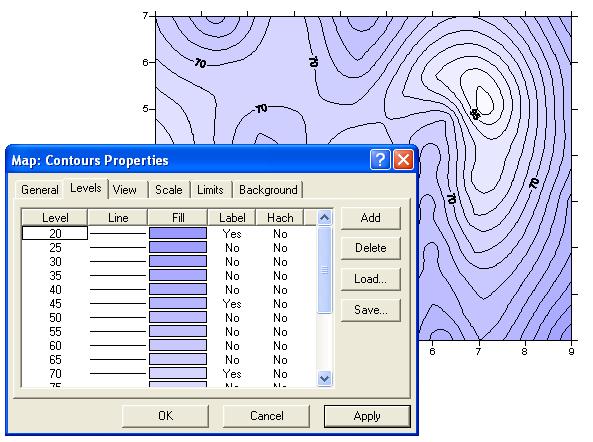
27 Creating a Contour Map is a two-dimensional representation of three-dimensional data. The first two dimensions are the XY coordinates, and the third dimension (Z) is represented by lines of equal value. Choose the Map Contour Map New Contour Map command, or Then select the created grid file Click the Open button to create a contour map.. After creating a map, you can change the map properties so double click inside the limits of the contour map
28
29

30 Modifying an Axis Every contour map is created with four axes: the bottom, right, top, and left axes. You can control the display of each axis independently of the other axes on the map double click on each axis and make the changes


31 Overlaying Maps Click Edit Select All to select both maps. Choose the Map Overlay Maps command to combine the two maps into a single composite map.

32 Creating a Wireframe 1. Select the File New command, or click the button. 2. Select Plot Document, in the New dialog and click OK. A new empty plot window is displayed. 3. Select the Map Wireframe command or click the button. 4. Choose the grid file
33 Creating a Surface 1. Select the File New command, 2. Select Plot Document, in the New dialog and click OK. A new empty plot window is displayed. 3. Select the Map Surface command or click the
34 Creating a Data File with Digitize plot window, the Map Digitize command can be used to create a data file from map XY coordinates. The Digitize command is used to collect coordinates from the map, and create a [.BNA] or [.BLN] file To digitize points from a map: 1. Select a map. 2. Select Map Digitize. 3. The arrow pointer changes into a cross hair pointer. 4. Digitize points by clicking with the left mouse button on the map. You can zoom in on the map for greater precision in digitizing. 5. The digitized points appear as temporary small red crosses in the window. The digitized point coordinates appear as text in a report window. 6. Save the contents of the report window to save the digitized points.
35 Breaklines and Faults Breaklines and faults are a means to show discontinuities in the surface. Select gridding methods support breaklines and/or faults. Breaklines and faults are defined with blanking files. If your grid is not dense enough, the breakline or fault will not show very well in the map. If you cannot see any indication of the breakline or fault (i.e. contours do not bend properly), regrid the data with a denser grid. To include the breakline or fault as a line on your map, use Map Base Map and choose your blanking file. Select all maps and use Map Overlay Maps to position the line correctly. Contour maps have a Fault Line Properties button, so you do not need to use a base map to show faults on contour maps.

36 Boundary Files Boundary files contain XY location data such as state boundaries, rivers, or point locations. Boundary files can be used to create layers overlaid on other map types, or to specify the boundary limits for blanking, faults, breaklines, or slice calculations. Boundary files can be created from a wide variety of vector formats. Breaklines Breaklines are used when gridding to show discontinuity in the grid. A breakline is a threedimensional.bln boundary file that defines a line with X, Y, and Z values at each vertex. Faults Faults are used to show discontinuity when gridding, similar to breaklines. A fault is a two-dimensional boundary file in.bln format that defines a line with X and Y values at each vertex. Faults do not contain Z values. And, unlike a breakline, faults are barriers to information flow. Data on one side of a fault is not used when calculating grid node values on the other side of the fault.
37

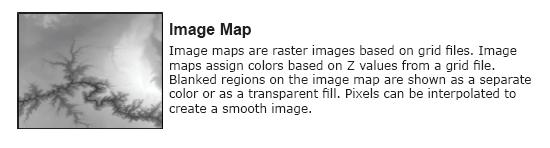
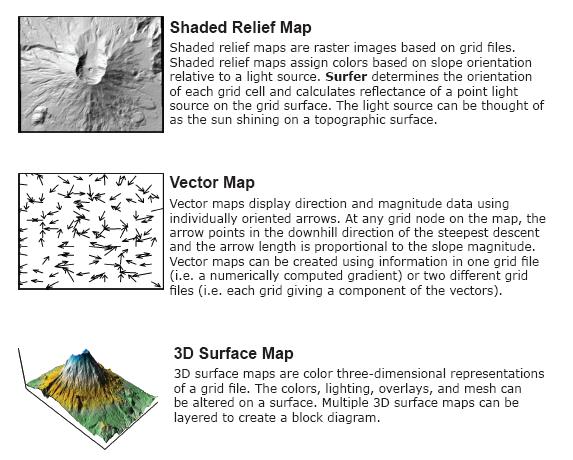
38 Map Types Several different map types can be created, modified, and displayed with Surfer. These map types include base, contour, post, classed post, image, shaded relief, vector, 3D surface, and 3D wireframe maps. A description and example of each map is listed below.
39
Chapter 2 Surfer Tutorial
 Chapter 2 Surfer Tutorial Overview This tutorial introduces you to some of Surfer s features and shows you the steps to take to produce maps. In addition, the tutorial will help previous Surfer users learn
What is a Topographic Map?
 Topographic Maps Topography From Greek topos, place and grapho, write the study of surface shape and features of the Earth and other planetary bodies. Depiction in maps. Person whom makes maps is called
Topographic Survey. Topographic Survey. Topographic Survey. Topographic Survey. CIVL 1101 Surveying - Introduction to Topographic Mapping 1/7
 IVL 1101 Surveying - Introduction to Topographic Mapping 1/7 Introduction Topography - defined as the shape or configuration or relief or three dimensional quality of a surface Topography maps are very
Using Grid Math in Surfer to Create Geological Models
 Using Grid Math in Surfer to Create Geological Models When gridding data in Surfer, the grid file created is based on the input data provided. However, the data provided may not be complete, or may not
2. AREAL PHOTOGRAPHS, SATELLITE IMAGES, & TOPOGRAPHIC MAPS
 LAST NAME (ALL IN CAPS): FIRST NAME: 2. AREAL PHOTOGRAPHS, SATELLITE IMAGES, & TOPOGRAPHIC MAPS Instructions: Refer to Exercise 3 in your Lab Manual on pages 47-64 to answer the questions in this work
Lecture 21 - Chapter 8 (Raster Analysis, part2)
") GEOL 452/552 - GIS for Geoscientists I Lecture 21 - Chapter 8 (Raster Analysis, part2) Today: Digital Elevation Models (DEMs), Topographic functions (surface analysis): slope, aspect hillshade, viewshed,
GEOL 452/552 - GIS for Geoscientists I Lecture 21 - Chapter 8 (Raster Analysis, part2) Today: Digital Elevation Models (DEMs), Topographic functions (surface analysis): slope, aspect hillshade, viewshed,
Topic 2B Topographic Maps
 Name Period Topic 2B Topographic Maps Isolines: Contour lines: Contour Interval: Index Contour: The elevation when starting at the OCEAN must be. The contour interval on this map is feet. 2 0 50 E The
Understanding Topographic Maps
 Understanding Topographic Maps 1. Every point on a contour line represents the exact same elevation (remember the glass inserted into the mountain). As a result of this every contour line must eventually
A Case Study of Coal Resource Evaluation in the Canadian Rockies Using Digital Terrain Models
 A Case Study of Coal Resource Evaluation in the Canadian Rockies Using Digital Terrain Models By C.M. Gold and W.E. Kilby BACKGROUND DESCRIPTION The Problem The purpose of this study was to evaluate the
PASS Sample Size Software
 Chapter 941 Introduction In PASS, it is easy to study power and sample size calculations for a range of possible parameter values. When at least 2 input parameters vary, you can create stunning 3D power
Contents of Lecture. Surface (Terrain) Data Models. Terrain Surface Representation. Sampling in Surface Model DEM
 Data Models. Terrain Surface Representation. Sampling in Surface Model DEM") Lecture 13: Advanced Data Models: Terrain mapping and Analysis Contents of Lecture Surface Data Models DEM GRID Model TIN Model Visibility Analysis Geography 373 Spring, 2006 Changjoo Kim 11/29/2006 1
Lecture 13: Advanced Data Models: Terrain mapping and Analysis Contents of Lecture Surface Data Models DEM GRID Model TIN Model Visibility Analysis Geography 373 Spring, 2006 Changjoo Kim 11/29/2006 1
Applied Cartography and Introduction to GIS GEOG 2017 EL. Lecture-7 Chapters 13 and 14
 Applied Cartography and Introduction to GIS GEOG 2017 EL Lecture-7 Chapters 13 and 14 Data for Terrain Mapping and Analysis DEM (digital elevation model) and TIN (triangulated irregular network) are two
Target Lithology Voxels
 Target Lithology Voxels The Target Lithology Voxels tool enables you to create a 3D grid (voxel) based on data contained in a string channel within a from-to drillhole database. A lithology voxel can be
Final project: Lecture 21 - Chapter 8 (Raster Analysis, part2) GEOL 452/552 - GIS for Geoscientists I
 GEOL 452/552 - GIS for Geoscientists I") GEOL 452/552 - GIS for Geoscientists I Lecture 21 - Chapter 8 (Raster Analysis, part2) Talk about class project (copy follow_along_data\ch8a_class_ex into U:\ArcGIS\ if needed) Catch up with lecture 20
GEOL 452/552 - GIS for Geoscientists I Lecture 21 - Chapter 8 (Raster Analysis, part2) Talk about class project (copy follow_along_data\ch8a_class_ex into U:\ArcGIS\ if needed) Catch up with lecture 20
3GSM GmbH. Plüddemanngasse 77 A-8010 Graz, Austria Tel Fax:
 White Paper Graz, April 2014 3GSM GmbH Plüddemanngasse 77 A-8010 Graz, Austria Tel. +43-316-464744 Fax: +43-316-464744-11 office@3gsm.at www.3gsm.at Measurement and assessment of rock and terrain surfaces
Question: What are the origins of the forces of magnetism (how are they produced/ generated)?
?") This is an additional material to the one in the internet and may help you to develop interest with the method. You should try to integrate some of the discussions here while you are trying to answer the
This is an additional material to the one in the internet and may help you to develop interest with the method. You should try to integrate some of the discussions here while you are trying to answer the
Civil 3D Introduction
 Civil 3D Introduction Points Overview Points are data collected by surveyors which represent existing site conditions (elevations, boundaries, utilities, etc.). Each point is numbered (or named) and has
GY461 GIS 1: Environmental Campus Topography Project with ArcGIS 9.x
 I. Introduction GY461 GIS 1: Environmental In this project you will use data from a topographic survey of the USA campus to generate 2 separate maps: 1. A color-coded 2-dimensional topographic contour
GY461/GEO461 Computer Mapping & GIS Technology Merging of DEM and Geology Raster Images
 Introduction In this exercise you will merge the geology color fills created for the quadrangle geologic map, with a hill-shade image produced from a digital elevation model (DEM) of the quadrangle. This
Displaying Strike and Dip Measurements on Your Map in Surfer
 Displaying Strike and Dip Measurements on Your Map in Surfer Measuring strike and dip is a fundamental part of geological mapping, and displaying strike and dip information on a map is an effective way
Should Contours Be Generated from Lidar Data, and Are Breaklines Required? Lidar data provides the most
 Should Contours Be Generated from Lidar Data, and Are Breaklines Required? Lidar data provides the most accurate and reliable representation of the topography of the earth. As lidar technology advances
 Cabrillo College Engineering 1A - Surveying LABORATORY NO. 4 --- THEODOLITE: ANGLE ABOUT A POINT Objectives: To measure the angles about a point by repetition using a theodolite. Equipment: Theodolite,
Make a TOPOGRAPHIC MAP
 How can you make a topographic map, and what information can you get from it? Activity Overview To build the Panama Canal, engineers dammed the Chagres River. In the process, new lakes were formed, a valley
Print a Map to Scale
 Exercise 5: Print a Map to Scale There are two ways to print a map to scale from a MapPlace map. One is to use the print features provided by MapPlace. The other is to copy and paste to an external software
WMS 9.1 Tutorial Hydraulics and Floodplain Modeling Floodplain Delineation Learn how to us the WMS floodplain delineation tools
 v. 9.1 WMS 9.1 Tutorial Hydraulics and Floodplain Modeling Floodplain Delineation Learn how to us the WMS floodplain delineation tools Objectives Experiment with the various floodplain delineation options
Surfer Self-Paced Training Guide
 Surfer Self-Paced Training Guide I. Introduction to Surfer 1 What Surfer can do Setting options II. Preparing a Base and Post Map 2 Importing a base map Adding drawing objects to a base map Calculate area
Surfer 8 Overview. Which Surfer Features Would You Like to Learn About? Contour Maps
 Surfer 8 Overview Surfer is a contouring and 3D surface mapping program that runs under Microsoft Windows. It quickly and easily converts your data into outstanding contour, surface, wireframe, vector,
FOUNDATION IN OVERCONSOLIDATED CLAY
 1 FOUNDATION IN OVERCONSOLIDATED CLAY In this chapter a first application of PLAXIS 3D is considered, namely the settlement of a foundation in clay. This is the first step in becoming familiar with the
Making Topographic Maps
 T O P O Applications N Making Topographic Maps M A P S Making Topographic Maps with TNTmips page 1 Before Getting Started TNTmips provides a variety of tools for working with map data and making topographic
Purpose: To explore the raster grid and vector map element concepts in GIS.
 GIS INTRODUCTION TO RASTER GRIDS AND VECTOR MAP ELEMENTS c:wou:nssi:vecrasex.wpd Purpose: To explore the raster grid and vector map element concepts in GIS. PART A. RASTER GRID NETWORKS Task A- Examine
PHY120 LAB 4 Maps, Landforms, and Google Earth
 PHY120 LAB 4 Maps, Landforms, and Google Earth Sources: en.wikipedia.org Holcombe_conv_and_meas.pdf mrdata.usgs.gov/geology/state/ www.state.nj.us/dep/njgs/geodata/fmsdoc/fmsuser.htm www.geo.utexas.edu/courses/420k/pdf_files/brunton_compass_09.pdf
1. Which diagram best represents the location of the isolines for the elevation field of this landscape? (1) (2) (3) (4)
 (2) (3) (4)") Base your answers to questions 1 through 5 on your knowledge of earth science and on the diagram below which represents the elevation data for a certain landscape region. Points A, B, C, and D are specific
Base your answers to questions 1 through 5 on your knowledge of earth science and on the diagram below which represents the elevation data for a certain landscape region. Points A, B, C, and D are specific
PROFILE EXTRACTOR 6.0 USER GUIDE Extracts a cross section profile from TIN or GRID theme.
 PROFILE EXTRACTOR 6.0 USER GUIDE Extracts a cross section profile from TIN or GRID theme. INDEX: SYSTEM REQUIREMENTS INSTALLATION SET-UP MAIN DIALOG 1. GRID PANEL 2. SETTINGS PANEL 3. EXTRACT FROM PANEL
v SMS 11.1 Tutorial Scatter Data - TINs Requirements Scatter Module Map Module Time minutes Prerequisites None Objectives
 v. 11.1 SMS 11.1 Tutorial Scatter Data - TINs Objectives This workshop covers the basics of working with TINs (triangulated irregular networks) using the scatter module of SMS. We will cover importing
THE NEW UPGRADED INTERFACE OF SCADA PRO... 3 II. DETAILED DESCRIPTION OF THE NEW INTERFACE...
 CONTENTS I. THE NEW UPGRADED INTERFACE OF SCADA PRO... 3 II. DETAILED DESCRIPTION OF THE NEW INTERFACE... 4 VIEW... 4 1.1 ZOOM... 4 1.2 PAN... 4 1.3 DYNAMIC ROTATION... 4 2. DISPLAY... 5 2.1 REDRAW...
Surveying Prof. Bharat Lohani Indian Institute of Technology, Kanpur. Lecture - 1 Module - 6 Triangulation and Trilateration
 Surveying Prof. Bharat Lohani Indian Institute of Technology, Kanpur Lecture - 1 Module - 6 Triangulation and Trilateration (Refer Slide Time: 00:21) Welcome to this another lecture on basic surveying.
Reconnaissance and Surveillance Leader s Course Map Reading self study worksheet (Tenino, Washington Map)
") Reconnaissance and Surveillance Leader s Course Map Reading self study worksheet (Tenino, Washington Map) General Knowledge 1. Name the five Basic Colors on a map and what they represent? 1. 2. 3. 4. 5.
Reconnaissance and Surveillance Leader s Course Map Reading self study worksheet (Tenino, Washington Map) General Knowledge 1. Name the five Basic Colors on a map and what they represent? 1. 2. 3. 4. 5.
MODULE 1 BASIC LIDAR TECHNIQUES
 MODULE SCENARIO One of the first tasks a geographic information systems (GIS) department using lidar data should perform is to check the quality of the data delivered by the data provider. The department
v Scatter Data TINs SMS 12.3 Tutorial Requirements Scatter Module Map Module Time minutes Prerequisites None Objectives
 v. 12.3 SMS 12.3 Tutorial Objectives This tutorial covers the basics of working with TINs (triangulated irregular networks) using the scatter module of SMS, including: importing TIN data, editing and filtering
v TUFLOW-2D Hydrodynamics SMS Tutorials Time minutes Prerequisites Overview Tutorial
 v. 12.2 SMS 12.2 Tutorial TUFLOW-2D Hydrodynamics Objectives This tutorial describes the generation of a TUFLOW project using the SMS interface. This project utilizes only the two dimensional flow calculation
CONTOUR PROCESSING AND 3-D IMAGE PROCESSING OF SEA BEAM BATHYMETRIC DATA
 International Hydrographie Review, Monaco, L X V (l), January 1988 CONTOUR PROCESSING AND 3-D IMAGE PROCESSING OF SEA BEAM BATHYMETRIC DATA by Akira A S A D A (*) Abstract The Sea Beam system was installed
3. Map Overlay and Digitizing
 3. Map Overlay and Digitizing 3.1 Opening Map Files NavviewW/SprayView supports digital map files in ShapeFile format from ArcView, DXF format from AutoCAD, MRK format from AG-NAV, Bitmap and JPEG formats
Copyright The McGraw-Hill Companies, Inc. Permission required for reproduction or display.
 Chapter 13. TERRAIN MAPPING AND ANALYSIS 13.1 Data for Terrain Mapping and Analysis 13.1.1 DEM 13.1.2 TIN Box 13.1 Terrain Data Format 13.2 Terrain Mapping 13.2.1 Contouring 13.2.2 Vertical Profiling 13.2.3
Lab Practical - Finite Element Stress & Deformation Analysis
 Lab Practical - Finite Element Stress & Deformation Analysis Part A The Basics In this example, some of the basic features of a finite element analysis will be demonstrated through the modelling of a simple
Converting AutoCAD Map 2002 Projects to ArcGIS
 Introduction This document outlines the procedures necessary for converting an AutoCAD Map drawing containing topologies to ArcGIS version 9.x and higher. This includes the export of polygon and network
Kinematic Analysis dialog
 Dips version 6.0 has arrived, a major new upgrade to our popular stereonet analysis program. New features in Dips 6.0 include a comprehensive kinematic analysis toolkit for planar, wedge and toppling analysis;
GIS LAB 8. Raster Data Applications Watershed Delineation
 GIS LAB 8 Raster Data Applications Watershed Delineation This lab will require you to further your familiarity with raster data structures and the Spatial Analyst. The data for this lab are drawn from
I. An Intro to ArcMap Version 9.3 and 10. 1) Arc Map is basically a build your own Google map
 Arc Map is basically a build your own Google map") I. An Intro to ArcMap Version 9.3 and 10 What is Arc Map? 1) Arc Map is basically a build your own Google map a. Display and manage geo-spatial data (maps, images, points that have a geographic location)
I. An Intro to ArcMap Version 9.3 and 10 What is Arc Map? 1) Arc Map is basically a build your own Google map a. Display and manage geo-spatial data (maps, images, points that have a geographic location)
Creating and Displaying Multi-Layered Cross Sections in Surfer 11
 Creating and Displaying Multi-Layered Cross Sections in Surfer 11 The ability to create a profile in Surfer has always been a powerful tool that many users take advantage of. The ability to combine profiles
NaysEddy ver 1.0. Example MANUAL. By: Mohamed Nabi, Ph.D. Copyright 2014 iric Project. All Rights Reserved.
 NaysEddy ver 1.0 Example MANUAL By: Mohamed Nabi, Ph.D. Copyright 2014 iric Project. All Rights Reserved. Contents Introduction... 3 Getting started... 4 Simulation of flow over dunes... 6 1. Purpose of
Objectives This tutorial shows how to build a Sedimentation and River Hydraulics Two-Dimensional (SRH-2D) simulation.
 simulation.") v. 12.1 SMS 12.1 Tutorial Objectives This tutorial shows how to build a Sedimentation and River Hydraulics Two-Dimensional () simulation. Prerequisites SMS Overview tutorial Requirements Model Map Module
v. 12.1 SMS 12.1 Tutorial Objectives This tutorial shows how to build a Sedimentation and River Hydraulics Two-Dimensional () simulation. Prerequisites SMS Overview tutorial Requirements Model Map Module
Hydraulics and Floodplain Modeling Modeling with the Hydraulic Toolbox
 v. 9.1 WMS 9.1 Tutorial Hydraulics and Floodplain Modeling Modeling with the Hydraulic Toolbox Learn how to design inlet grates, detention basins, channels, and riprap using the FHWA Hydraulic Toolbox
AUTOMATIC EXTRACTION OF TERRAIN SKELETON LINES FROM DIGITAL ELEVATION MODELS
 AUTOMATIC EXTRACTION OF TERRAIN SKELETON LINES FROM DIGITAL ELEVATION MODELS F. Gülgen, T. Gökgöz Yildiz Technical University, Department of Geodetic and Photogrammetric Engineering, 34349 Besiktas Istanbul,
v. 9.1 WMS 9.1 Tutorial Watershed Modeling HEC-1 Interface Learn how to setup a basic HEC-1 model using WMS
 v. 9.1 WMS 9.1 Tutorial Learn how to setup a basic HEC-1 model using WMS Objectives Build a basic HEC-1 model from scratch using a DEM, land use, and soil data. Compute the geometric and hydrologic parameters
Spring 2011 Workshop ESSENTIALS OF 3D MODELING IN RHINOCEROS February 10 th 2011 S.R. Crown Hall Lower Core Computer Lab
 [1] Open Rhinoceros. PART 1 INTRODUCTION [4] Click and hold on the Boundary Lines in where they form a crossing and Drag from TOP RIGHT to BOTTOM LEFT to enable only the PERSPECTIVE VIEW. [2] When the
Ilham Marsudi Universitas Negeri Yogyakarta Yogyakarta, Indonesia
 1st International Conference on Technology and Vocational Teachers (ICTVT 2017) Making a Digital Contour Map Ilham Marsudi Universitas Negeri Yogyakarta Yogyakarta, Indonesia ilham@uny.ac.id Abstract---
Introduction to Google SketchUp
 Introduction to Google SketchUp When initially opening SketchUp, it will be useful to select the Google Earth Modelling Meters option from the initial menu. If this menu doesn t appear, the same option
Overview. Profile 2/27/2018. CE 371 Surveying PROFILE LEVELING & Trigonometric LEVELING
 Lec 10 + Lec 11 CE 371 Surveying PROFILE LEVELING & Trigonometric LEVELING Dr. Ragab Khalil Department of Landscape Architecture Faculty of Environmental Design King AbdulAziz University Room LIE15 Overview
Objectives Learn how to work with projections in SMS, and how to combine data from different coordinate systems into the same SMS project.
 v. 12.3 SMS 12.3 Tutorial Working with map projections in SMS Objectives Learn how to work with projections in SMS, and how to combine data from different coordinate systems into the same SMS project.
GY301 Geomorphology Lab 5 Topographic Map: Final GIS Map Construction
 GY301 Geomorphology Lab 5 Topographic Map: Final GIS Map Construction Introduction This document describes how to take the data collected with the total station for the campus topographic map project and
fraction of Nyquist
 differentiator 4 2.1.2.3.4.5.6.7.8.9 1 1 1/integrator 5.1.2.3.4.5.6.7.8.9 1 1 gain.5.1.2.3.4.5.6.7.8.9 1 fraction of Nyquist Figure 1. (top) Transfer functions of differential operators (dotted ideal derivative,
PARCC Geometry Practice Test Released April,
 Non-Calculator Part 1. The figure shows with side lengths as indicated. Enter your answer in the box. 2. The figure shows two perpendicular lines s and r intersecting at point P in the interior of a trapezoid.
Getting Started. What is SAS/SPECTRAVIEW Software? CHAPTER 1
 3 CHAPTER 1 Getting Started What is SAS/SPECTRAVIEW Software? 3 Using SAS/SPECTRAVIEW Software 5 Data Set Requirements 5 How the Software Displays Data 6 Spatial Data 6 Non-Spatial Data 7 Summary of Software
Import, view, edit, convert, and digitize triangulated irregular networks
 v. 10.1 WMS 10.1 Tutorial Import, view, edit, convert, and digitize triangulated irregular networks Objectives Import survey data in an XYZ format. Digitize elevation points using contour imagery. Edit
PS User Guide Series Velocity (Vs) Display (2-D Cross Section)
 Display (2-D Cross Section)") PS User Guide Series 2015 Velocity (Vs) Display (2-D Cross Section) Prepared By Choon B. Park, Ph.D. January 2015 Table of Contents Page 1. Overview 2 2. Files 4 3. View 5 4. Edit 7 5. Process 9 6. Chart
PS User Guide Series 2015 Velocity (Vs) Display (2-D Cross Section) Prepared By Choon B. Park, Ph.D. January 2015 Table of Contents Page 1. Overview 2 2. Files 4 3. View 5 4. Edit 7 5. Process 9 6. Chart
Objectives Learn how to work with projections in GMS, and how to combine data from different coordinate systems into the same GMS project.
 v. 10.2 GMS 10.2 Tutorial Working with map projections in GMS Objectives Learn how to work with projections in GMS, and how to combine data from different coordinate systems into the same GMS project.
v SMS Tutorials SRH-2D Prerequisites Requirements SRH-2D Model Map Module Mesh Module Data files Time
 v. 11.2 SMS 11.2 Tutorial Objectives This tutorial shows how to build a Sedimentation and River Hydraulics Two-Dimensional () simulation using SMS version 11.2 or later. Prerequisites SMS Overview tutorial
WMS 10.0 Tutorial Watershed Modeling MODRAT Interface Schematic Build a MODRAT model by defining a hydrologic schematic
 v. 10.0 WMS 10.0 Tutorial Watershed Modeling MODRAT Interface Schematic Build a MODRAT model by defining a hydrologic schematic Objectives This tutorial shows users how to define a basic MODRAT model using
A New Dimension to Land Development and Subdivision Design: Application of AutoCAD Civil 3D
 A New Dimension to Land Development and Subdivision Design: Application of AutoCAD Civil 3D Tarig Ali College of Engineering and Computer Science University of Central Florida Orlando, Florida taali@mail.ucf.edu
Basic Modeling 1 Tekla Structures 12.0 Basic Training September 19, 2006
 Tekla Structures 12.0 Basic Training September 19, 2006 Copyright 2006 Tekla Corporation Contents Contents 3 1 5 1.1 Start Tekla Structures 6 1.2 Create a New Model BasicModel1 7 1.3 Create Grids 10 1.4
GIS OPERATION MANUAL
 GIS OPERATION MANUAL 1. Computer System Description Hardware Make Compaq Presario 5004 CPU AMD Athlon 1.1 Ghz Main Memory 640MB CD-ROM 52 X CD-RW 8 X HD 57GB Monitor 19 inch Video Adapter 16 Mb Nvidia
3D Terrain Modelling of the Amyntaio Ptolemais Basin
 2nd International Workshop in Geoenvironment and 1 3D Terrain Modelling of the Amyntaio Ptolemais Basin G. Argyris, I. Kapageridis and A. Triantafyllou Department of Geotechnology and Environmental Engineering,
Digital Terrain Model V 6.5
 TCP MDT Digital Terrain Model V 6.5 Professional Version Introduction The Professional Version is designed to assist users in all the phases of carrying out a Surveying or Civil Engineering project. Its
Target 3D Geology Surfaces
 Target 3D Geology Surfaces The Target 3D Geology Surfaces (Contact Surface from Geology Grids) tool enables you to create subsurface topography grids, where the "Z" values correspond to the elevation of
Exploiting Composite Features in Robot Navigation
 EXPLOITING COMPOSITE FEATURES IN ROBOT NAVIGATION 69 Exploiting Composite Features in Robot Navigation Jennifer Davison, Kelly Hasler Faculty Sponsor: Karen T. Sutherland, Department of Computer Science
Objectives Learn how to work with projections in GMS, and how to combine data from different coordinate systems into the same GMS project.
 v. 10.4 GMS 10.4 Tutorial Working with map projections in GMS Objectives Learn how to work with projections in GMS, and how to combine data from different coordinate systems into the same GMS project.
3D Surface Plots with Groups
 Chapter 942 3D Surface Plots with Groups Introduction In PASS, it is easy to study power and sample size calculations for a range of possible parameter values. When at least 3 input parameters vary, you
The Industry Standard in Mapping Solutions. Contouring and 3D Surface Mapping for Scientists and Engineers
 The Industry Standard in Mapping Solutions Only $599! Contouring and 3D Surface Mapping for Scientists and Engineers w w w. g o l d e n s o f t w a r e. c o m The software of choice for creating contour
SURFACE WATER MODELING SYSTEM. This tutorial requires that you have Google Earth installed on your computer.
 SURFACE WATER MODELING SYSTEM Google Earth Files This lesson is designed to help you understand how to save SMS data to a *.kmz file format. Files of this type are Google Earth files and will allow you
Click here to be a Dips 7.0 Beta Tester! 3D Stereosphere. Contour Arbitrary Data on Stereonet. Curved Boreholes. Intersection Calculator
 DIPS7.0 It s been 3 years since the release of Dips 6.0, so it s time for an upgrade! The latest version of our popular stereonet program - Dips 7.0 - is scheduled for release in early 2016. If you would
Systems Space Reservation
 Systems Space Reservation Preface Using This Guide What's New? Getting Started Enter the Workbench Create an Equipment Reservation Set Correct Working Units and Grid Changing the Current Axis Saving Documents
Watershed Modeling Advanced DEM Delineation
 v. 10.1 WMS 10.1 Tutorial Watershed Modeling Advanced DEM Delineation Techniques Model manmade and natural drainage features Objectives Learn to manipulate the default watershed boundaries by assigning
Algebra II Notes Unit Two: Linear Equations and Functions
 Syllabus Objectives:.1 The student will differentiate between a relation and a function.. The student will identify the domain and range of a relation or function.. The student will derive a function rule
3DReshaper Help DReshaper Beginner's Guide. Surveying
 3DReshaper Beginner's Guide Surveying 1 of 29 Cross sections Exercise: Tunnel analysis Surface analysis Exercise: Complete analysis of a concrete floor Surveying extraction Exercise: Automatic extraction
Forward and Inverse Modeling of Gravity Data: Locating buried glacial channels and evaluating the results of published analysis
 GRAVITY COMPUTER LAB Forward and Inverse Modeling of Gravity Data: Locating buried glacial channels and evaluating the results of published analysis During this lab your task will be to evaluate the accuracy
Terrain Analysis. Using QGIS and SAGA
 Terrain Analysis Using QGIS and SAGA Tutorial ID: IGET_RS_010 This tutorial has been developed by BVIEER as part of the IGET web portal intended to provide easy access to geospatial education. This tutorial
A Practical Guide to Using QGIS
 A Practical Guide to Using QGIS 1.1 INTRODUCTION Quantum GIS (QGIS) is a useful mapping software that enables the compilation and displaying of spatial data in the form of a map. Gaining experience in
ArchiCAD 11 manual Chapter 1
 ArchiCAD 11 manual Chapter 1 1/16 ArchiCAD ArchiCAD is an architectural BIM (Building Information Modeling) CAD software for Macintosh and Windows developed by the Hungarian company Graphisoft. Development
Ducks on the Pond: Stormwater Management Basin Analysis Using AutoCAD Civil 3D and Autodesk SSA
 Ducks on the Pond: Stormwater Management Basin Analysis Using AutoCAD Civil 3D and Autodesk Josh Kehs, P.E. Autodesk, Inc. CI4541 Learning Objectives At the end of this class, you will be able to: Model
Introduction to GIS A Journey Through Gale Crater
 Introduction to GIS A Journey Through Gale Crater In this lab you will be learning how to use ArcMap, one of the most common commercial software packages for GIS (Geographic Information System). Throughout
AEC Logic. AEC Terrain. A program to manage earth works in a construction project. Yudhishtirudu Gaddipati 29-Jun-13
 AEC Logic AEC Terrain A program to manage earth works in a construction project Yudhishtirudu Gaddipati 29-Jun-13 Contents 1 Introduction:... 5 2 Program Launch... 5 2.1 How to Launch Program... 5 2.2
Tutorial 7. Water Table and Bedrock Surface
 Tutorial 7 Water Table and Bedrock Surface Table of Contents Objective. 1 Step-by-Step Procedure... 2 Section 1 Data Input. 2 Step 1: Open Adaptive Groundwater Input (.agw) File. 2 Step 2: Assign Material
Surfer. Powerful contouring, gridding & surface mapping system. Quick Start Guide
 Surfer Powerful contouring, gridding & surface mapping system Quick Start Guide Surfer Registration Information Your Surfer product key is located in the download instructions email and in your account
v Overview SMS Tutorials Prerequisites Requirements Time Objectives
 v. 12.2 SMS 12.2 Tutorial Overview Objectives This tutorial describes the major components of the SMS interface and gives a brief introduction to the different SMS modules. Ideally, this tutorial should
MODFLOW Conceptual Model Approach I Build a basic MODFLOW model using the conceptual model approach
 v. 10.1 GMS 10.1 Tutorial Build a basic MODFLOW model using the conceptual model approach Objectives The conceptual model approach involves using the GIS tools in the Map module to develop a conceptual
Statistical surfaces and interpolation. This is lecture ten
 Statistical surfaces and interpolation This is lecture ten Data models for representation of surfaces So far have considered field and object data models (represented by raster and vector data structures).
GMS 10.0 Tutorial MODFLOW Conceptual Model Approach I Build a basic MODFLOW model using the conceptual model approach
 v. 10.0 GMS 10.0 Tutorial Build a basic MODFLOW model using the conceptual model approach Objectives The conceptual model approach involves using the GIS tools in the Map module to develop a conceptual
Working with Charts Stratum.Viewer 6
 Working with Charts Stratum.Viewer 6 Getting Started Tasks Additional Information Access to Charts Introduction to Charts Overview of Chart Types Quick Start - Adding a Chart to a View Create a Chart with
SURFACE WATER MODELING SYSTEM. 2. Change to the Data Files Folder and open the file poway1.xyz.
 SURFACE WATER MODELING SYSTEM Mesh Editing This tutorial lesson teaches manual finite element mesh generation techniques that can be performed using SMS. It gives a brief introduction to tools in SMS that
Lab 7: Bedrock rivers and the relief structure of mountain ranges
 Lab 7: Bedrock rivers and the relief structure of mountain ranges Objectives In this lab, you will analyze the relief structure of the San Gabriel Mountains in southern California and how it relates to