Lab 11: Terrain Analysis
|
|
|
- Cory Shields
- 6 years ago
- Views:
Transcription
1 Lab 11: Terrain Analysis What You ll Learn: Basic terrain analysis functions, including watershed, viewshed, and profile processing. You should read chapter 11 in the GIS Fundamentals textbook before performing this lab. Special for this Lab: You will use QGIS to produce the final maps (PDF s) but will use Whitebox GAT for the analysis. This is because Whitebox GAT is currently much better than QGIS for terrain and watershed analysis functions. There is a broader range functions, clearer documentation, and the functions more often return the intended result. Whitebox is free and open source, and although many of the functions are available in QGIS, many are works in progress, and somewhat problematic in application. Please make sure you update your Java to Version 8 Update 25. Then download and unzip the Whitebox GAT software. From the unzipped folder \Whitebox_3_2_1 double click on WhiteboxGIS.jar. Whitebox is installed on the first two rows in Skok 35, but you may still need to install the specific Java version. Data are located in the \L11 subdirectory, all in NAD83 UTM zone 15 coordinates, meters, including Qdrift, a GeoTiff elevation, 3m cell size, Z units in meters, and Qdrift30, a GeoTiff elevation grid, 30m cell size, Z units in meters. There are also Whitebox GAT versions of both Qdrift and Qdrift30 in the \L11 subdirectory. Shape files included in the lab are viewspot.shp, targetspot.shp and sight.shp. What You ll Produce: Various hydrologic surfaces, a watershed map, a viewshed map, and profiles. Background Elevation data, also known as terrain data, are import for many kinds of analysis, and are available in many forms, from many sources and resolutions. In the U.S. there have long been available nearly nationwide data at 30 m resolution. Since the early 2000 s these have largely been replaced by 10 m resolution DEMs, and now many parts of the country are developing higher resolution DEMs, and 1 to 3 meters, based on LiDAR data collections. Although the most common use of DEMs is as shaded relief background for maps, we often are interested in working with terrain data calculating slopes, aspects, steepness or slope along profiles, viewsheds, as well as watershed and 1

2 other hydrologic functions. The readings and lectures describe some of these applications, and this set of exercises introduces them. Our first project will use the a LiDAR DEM to explore profile and viewshed tools. Our second project focuses on watershed processing, using the Whitebox hydrology tools. Project 1: Raster Surfaces, Profiles, and Viewsheds Start Whitebox GAT, by clicking on WhiteboxGIS.jar, indicated during download (your install) or by the instructor (lab install) Use the add data cursor at the top left of the main window to add the Whitebox compatible DEM, Qdrift.dep. 2

3 Calculate the hillshade for Qdrift by Tools Terrain Analysis Surface Derivatives Hillshade, Specify 315 for the Azimuth, 25 for the Altitude, and model shadows. Name the output file something like hs_drift. 3

 or lower layer (right)")

4 Make the hillshade semi-transparent by clicking on Layers at the top of the TOC, then right clicking on the hillshade layer in the TOC, then Layers Layer Display Properties Opacity, then drag the alpha slider to something near 120 (figure at right, then below). If the hillshade layer is not on top, raise it or lower the others with the raise (left) or lower layer (right) tools at the top left of the main Whitebox frame Click on Layers at the top of the TOC, then Layer right click on the DEM, then Display Properties Properties Palette, click on the button to the right of the Palette entry, and select one of the spectrum palettes, e.g., Green-Yellow-Red-White 4


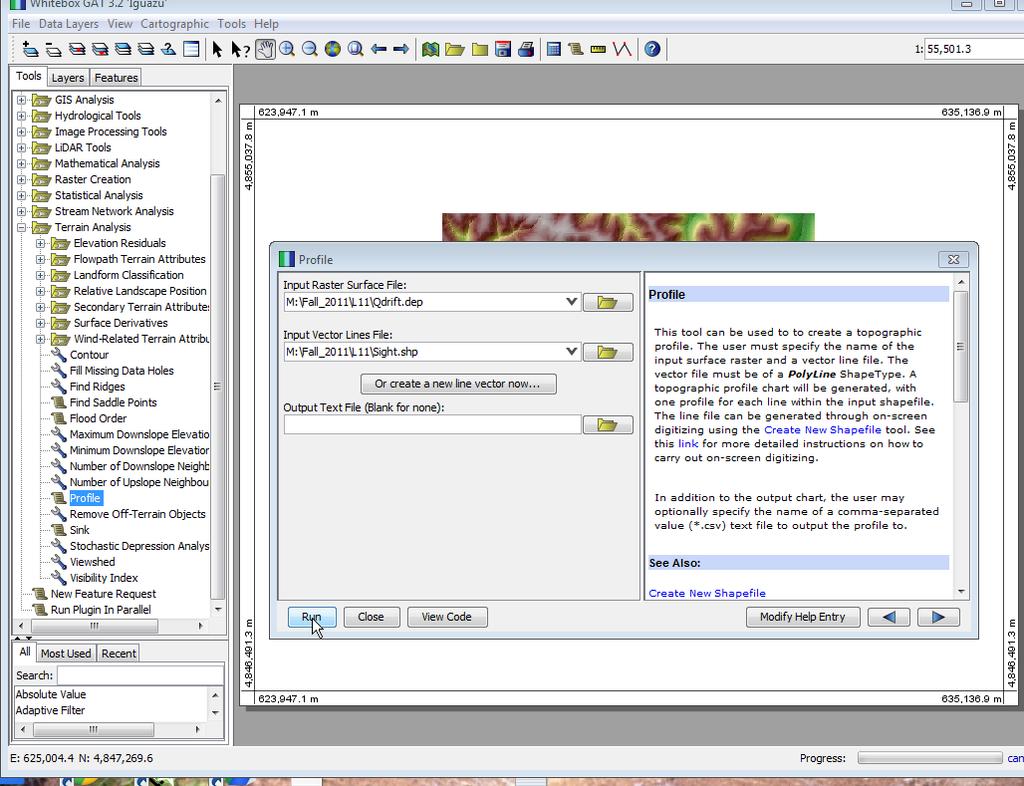
5 Select a palette by moving the slider on the right side of the menu up or down, clicking on a palette, then clicking on OK You should get a display that looks approximately like the figure below. We ll now explore the Viewshed and Profile View options. First, add the viewspot.shp and the sight.shp shapefiles. This displays our view locations, a single point in the bottom left portion of the Qdrift DEM. This also identifies a line of sight, defined from the sight.shp file. Select the TOC Layers tab, right click on the sight.shp file, then click on Layer Display Properties to display a point properties menu. Change the point marker size to 12 or more, and change the colors if you wish Now, to create a terrain profile plot: Select Tools Tab in the TOC, then Terrain Analysis Profile to set the Qdrift as the Input DEM and sight.shp as the Input Vector (see the figure below). 5

6 6

7 This gives you a Profile of the elevation change along the line of sight. If the vector layer was a trail this would provide an elevation profile of the trail. Right click in the Profile box and Save As Sight_Profile.PNG Close the Profile box, click on the Tools tab of the TOC, select Terrain Analysis Viewshed. 7
.")

8 Specify Qdrift as the Input DEM, viewspot as the Input Viewing Station and name the output Q_View. Set the station units to 1.8 (this is the height of the viewer in meters, about 5 10 ). Set the display properties for the output viewshed, but: Here, change the colors to reversed Black/White Palette and set the Opacity near 120. Change the order of the display as shown at right. The shaded areas are the landscape that is visible from the viewer location. 8


9 Now use the Cartographic Tool bar, found at the top center of the main Whitebox frame, to add a Title, North Arrow, Legend and Scale Bar. Use the Insert Image to add the previously saved Profile graph. To resize the Profile graph: Double left click on the image, then change the Width to 300 and the Height to 150 in the Map Properties window that pops up New, Open, Close, Save, Print Select Cartographic Print Map and send the Print to Adobe PDF (in the Print Service Name). Project 2: Watershed Functions 9

10 Save and close your map above, if you haven t done so already. Then, open a new map and add the Qdrift.dep DEM. Again we ll be using Whitebox GAT for this new project, but be forewarned these tools are buggy. You are best bet is to start early, follow the instructions carefully, save often, and if it doesn t work, close Whitebox GAT and restart from the beginning (meaning create a new map, and repeat the steps). If this doesn t work, please contact one of the instructors for help no sense in banging your head against a wall. (See Video: Watershed). Open Tools Hydrological Tools DEM Pre-processing. This should display the tools shown at the right. The yellow highlighted at right are the tools we will use. We ll be applying them in the following order: Fill Depressions D8 Flow Pointer D8 and Rho8 Flow Accumulation (also extracts streams) Snap Pour Points (on a point feature we ll create) Watershed We use the fill command to fill and pits in the DEM, ass described in chapter 11 of GIS Fundamentals. The simplest of watershed processing routines begins by simply filling the pits. More sophisticated ones may fill the pits, and burn in a stream line, along which the DEM is lowered after filling to maintain a downstream flow. Apply the Fill Depressions tool from the Tools panel. Specify the Qdrift DEM as input, and something like filled_dem for the output name. Leave the Flat Increment Value as is and click on Run. 10
.")
, and Display the output layer. Change the palette on the output file to Black/White with Palette, setting the Nonlinearity at 20.")
11 After a minute, the filled data set should be automatically added to your view, if not, find and load it. Open the raster calculator by clicking on the Tools label along the top of the main Whitebox Frame (see the figure below note this is NOT the tools tab in the TOC). This should open the raster calculator tool. You build an expression by selecting and typing into the Expression window, adding layers, numbers, and operators. Subtract the Qdrift DEM from your filled_dem (see figure), and Display the output layer. Change the palette on the output file to Black/White with Palette, setting the Nonlinearity at 20. Notice the location and range of the fills; it should look something like shown on the right, if not, troubleshoot and fix your work. Now remove the difference layer to reduce clutter. 11


12 Now, apply the D8 flow Pointer, found in the TOC Tools tab, under Hydrologic Tools Flow Pointers. Use the filled DEM as your input, and specifying a flow direction output data layer; name the output something like f_direction. As noted in the textbook, this flow direction layer will contain a set of numbers that define the cardinal and sub-cardinal direction. Your output from the flow direction tool should look something like the figure below, and the symbols should show 8 values from 1 to 128, corresponding to flow direction. Now apply the D8 and Rho8 Flow Accumulation in the TOC tools, found in the Hydrological Tools Flow Accumulation folder. This finds the highest points, and accumulates the area (or number of cells) downhill, according to the flow direction. Specify the input as f_direction, name the output raster as f_accum and select number of upslope grid cells as the Output Type. 12

13 This should generate a display similar to the graphic at right. If you look closely, you will see some narrow, perhaps intermittent white lines in a dark background. Notice the maximum and minimum value for the data layer, they will be something like 1.63 * 10^6 and 1.These numbers are the cells that drain to any given cell. Since these cells are 3 m by 3 m, each cell counts for 9 square meters, and there are about 111,000 cells per square kilometer. We may use this flow accumulation grid to approximate where streams will be found on the surface, and to determine outlet points for watersheds. In any given small region and geology, there is usually a rough correspondence between drainage area, here measured with flow accumulation, and stream occurence. For example, in this region, once a drainage area of 0.45 square kilometers is reached, a stream is usually fond. This would be 0.45 km2 * 1,000,000 m 2 /km 2 / 9 m 2 /cell, or about 50,000 cells. So if we symbolize the flow accumulation layer so all cells above 50,000 are blue, and all equal or below this count are no data or no color, we will get an approximate idea of where the streams will be found (this threshold is made up for this exercise, but is probably not too far off). You may apply the symbolization by reclassifying the flow accumulation layer into two classes, and setting the middle threshold to 50,000, the upper threshold to the maximum value. Use TOC Tools, GIS Analysis Reclass Tools Reclass, to reclass your flow accumulation layer into cells likely in streams, and those not. Select the f_accum as the input and d_streams as the output file. 13

14 Enter the table values as show below If you get out of memory errors, save work, reboot computer, only start Whitebox GAT and try again. If you still have problems use Tools Stream Network Analysis Extract Streams. Your d_streams should appear as shown to the right. Dark cells have drain more than 50,000 cells, and likely show streams. We do this reclassification to assist in locating the outlet point. We need to ensure that the outlet point is directly on a stream cell. 14

.")
15 We must create a pourpoint, the location on a stream at the base of a watershed. Start by creating an empty point shapefile: Use the TOC Tools tab, then File Utilities Create New Shapefile to make a new, empty shapefile. Name the file outlet.shp. Arrange the d_streams layer in the TOC until it is visible and just below the outlet.shp layer Zoom to the lower southwest quadrant of the screen and find the area shown in the image at right (there will be no green dot, navigate by the stream shapes). This figure is zoomed to about ¼ of the DEM extent. You ll want to zoom in much closer to digitize the point, so you can place it near the center of one of the stream cells. Zoom further to something like the figure to the right: You must digitize a watershed outlet point (near the green point shown). Make the outlet.shp active (select it in the Layers TOC) and Click the main Whitebox frame Tools, then from the dropdown select On Screen Digitizing Digitize New Feature (see right). 15
16 This adds new tools at the top of the main window to Edit Features, Digitize New Features, and Delete Features. Digitize New Feature Edit Feature Enter new FID value Delete Feature When editing is activated, clicking on the Digitize new Feature icon will open a window to record the feature ID (FID) for a new point (see figure above-right). Typing in a value and then clicking on OK activates the cursor for digitizing. Clicking on the displayed canvas adds a point to the outlet.shp layer. Digitize your outlet. To do this, zoom in to the desired location for an outlet on the DEM/thresholded flow accumulation layer, close enough so you can identify individual cells, and add an outlet point at the location described above. Give it a positive FID. Toggle editing off, then right-click on outlets.shp in the TOC, left click on View Attribute Table, and verify the outlet point has been added. Open the Tools tab in the TOC, and then select Hydrological Tools Watershed Tools->Snap Pour Points. Specify Outlet as your Input Outlets File, The flow accumulation as the raster you created earlier, f_accum A new output raster to contain your raster pour point, name it r_pour_pt An appropriate snap distance, something like 3 to 9 (about 1 to 3 cells). Select Run This should create a raster with a single cell for a value, near your digitized outlet. Now, from the TOC Tools tab, 16
, and picking an appropriate name for your output watershed.")

17 run Hydrological Tools Watershed Tools Watershed, with the appropriate D8 flow Pointer Raster (f_direction), the raster pour point layer you just created, (r_pour_pt), and picking an appropriate name for your output watershed. This should create a watershed layer something like that to the right. Change the color, and made the watershed raster 50% transparent. Now convert the d_streams from a raster to a shapefile: Use the TOC Tools, Conversion Tools Raster/Vector Conversions Raster Streams to Vector. 17

18 Name the output something like Derived_Streams. Create a layout displaying the Qdrift DEM, Watershed, Outlet and Derived_Streams with all the usual elements. Print as a.pdf. TURN IN: 1) Profile/Viewshed map 2) Watershed map 18
19 19
Lab 11: Terrain Analyses
 Lab 11: Terrain Analyses What You ll Learn: Basic terrain analysis functions, including watershed, viewshed, and profile processing. There is a mix of old and new functions used in this lab. We ll explain
Lab 11: Terrain Analyses
 Lab 11: Terrain Analyses What You ll Learn: Basic terrain analysis functions, including watershed, viewshed, and profile processing. There is a mix of old and new functions used in this lab. We ll explain
Field-Scale Watershed Analysis
 Conservation Applications of LiDAR Field-Scale Watershed Analysis A Supplemental Exercise for the Hydrologic Applications Module Andy Jenks, University of Minnesota Department of Forest Resources 2013
Lab 12: Sampling and Interpolation
 Lab 12: Sampling and Interpolation What You ll Learn: -Systematic and random sampling -Majority filtering -Stratified sampling -A few basic interpolation methods Data for the exercise are in the L12 subdirectory.
Lab 10: Raster Analyses
 Lab 10: Raster Analyses What You ll Learn: Spatial analysis and modeling with raster data. You will estimate the access costs for all points on a landscape, based on slope and distance to roads. You ll
Lab 10: Raster Analyses
 Lab 10: Raster Analyses What You ll Learn: Spatial analysis and modeling with raster data. You will estimate the access costs for all points on a landscape, based on slope and distance to roads. You ll
Lab 10: Raster Analyses
 Lab 10: Raster Analyses What You ll Learn: Spatial analysis and modeling with raster data. You will estimate the access costs for all points on a landscape, based on slope and distance to roads. You ll
Lab 12: Sampling and Interpolation
 Lab 12: Sampling and Interpolation What You ll Learn: -Systematic and random sampling -Majority filtering -Stratified sampling -A few basic interpolation methods Videos that show how to copy/paste data
GIS Fundamentals: Supplementary Lessons with ArcGIS Pro
 Station Analysis (parts 1 & 2) What You ll Learn: - Practice various skills using ArcMap. - Combining parcels, land use, impervious surface, and elevation data to calculate suitabilities for various uses
Improved Applications with SAMB Derived 3 meter DTMs
 Improved Applications with SAMB Derived 3 meter DTMs Evan J Fedorko West Virginia GIS Technical Center 20 April 2005 This report sums up the processes used to create several products from the Lorado 7
Delineating the Stream Network and Watersheds of the Guadalupe Basin
 Delineating the Stream Network and Watersheds of the Guadalupe Basin Francisco Olivera Department of Civil Engineering Texas A&M University Srikanth Koka Department of Civil Engineering Texas A&M University
Applied Cartography and Introduction to GIS GEOG 2017 EL. Lecture-7 Chapters 13 and 14
 Applied Cartography and Introduction to GIS GEOG 2017 EL Lecture-7 Chapters 13 and 14 Data for Terrain Mapping and Analysis DEM (digital elevation model) and TIN (triangulated irregular network) are two
STUDENT PAGES GIS Tutorial Treasure in the Treasure State
 STUDENT PAGES GIS Tutorial Treasure in the Treasure State Copyright 2015 Bear Trust International GIS Tutorial 1 Exercise 1: Make a Hand Drawn Map of the School Yard and Playground Your teacher will provide
GEO 465/565 Lab 6: Modeling Landslide Susceptibility
 1 GEO 465/565 Lab 6: Modeling Landslide Susceptibility This lab will give you more practice in understanding and building a GIS analysis model. Recall from class lecture that a GIS analysis model is a
v Introduction to WMS WMS 11.0 Tutorial Become familiar with the WMS interface Prerequisite Tutorials None Required Components Data Map
 s v. 11.0 WMS 11.0 Tutorial Become familiar with the WMS interface Objectives Import files into WMS and change modules and display options to become familiar with the WMS interface. Prerequisite Tutorials
Watershed Modeling Advanced DEM Delineation
 v. 10.1 WMS 10.1 Tutorial Watershed Modeling Advanced DEM Delineation Techniques Model manmade and natural drainage features Objectives Learn to manipulate the default watershed boundaries by assigning
GEO 465/565 - Lab 7 Working with GTOPO30 Data in ArcGIS 9
 GEO 465/565 - Lab 7 Working with GTOPO30 Data in ArcGIS 9 This lab explains how work with a Global 30-Arc-Second (GTOPO30) digital elevation model (DEM) from the U.S. Geological Survey. This dataset can
GY301 Geomorphology Lab 5 Topographic Map: Final GIS Map Construction
 GY301 Geomorphology Lab 5 Topographic Map: Final GIS Map Construction Introduction This document describes how to take the data collected with the total station for the campus topographic map project and
Workshop Exercises for Digital Terrain Analysis with LiDAR for Clean Water Implementation
 Workshop Exercises for Digital Terrain Analysis with LiDAR for Clean Water Implementation This manual is designed to accompany lecture and handout materials provided at a series of workshops offered in
Lab 12: Sampling and Interpolation
 Lab 12: Sampling and Interpolation What You ll Learn: -Systematic and random sampling -Majority filtering -Stratified sampling -A few basic interpolation methods Data for the exercise are found in the
Import, view, edit, convert, and digitize triangulated irregular networks
 v. 10.1 WMS 10.1 Tutorial Import, view, edit, convert, and digitize triangulated irregular networks Objectives Import survey data in an XYZ format. Digitize elevation points using contour imagery. Edit
All data is in Universal Transverse Mercator (UTM) Zone 6 projection, and WGS 84 datum.
 Zone 6 projection, and WGS 84 datum.") 111 Mulford Hall, College of Natural Resources, UC Berkeley (510) 643-4539 EXPLORING MOOREA DATA WITH QUANTUM GIS In this exercise, you will be using an open-source FREE GIS software, called Quantum GIS,
111 Mulford Hall, College of Natural Resources, UC Berkeley (510) 643-4539 EXPLORING MOOREA DATA WITH QUANTUM GIS In this exercise, you will be using an open-source FREE GIS software, called Quantum GIS,
Stream Network and Watershed Delineation using Spatial Analyst Hydrology Tools
 Stream Network and Watershed Delineation using Spatial Analyst Hydrology Tools Prepared by Venkatesh Merwade School of Civil Engineering, Purdue University vmerwade@purdue.edu January 2018 Objective The
Watershed Delineation
 Watershed Delineation Using SAGA GIS Tutorial ID: IGET_SA_003 This tutorial has been developed by BVIEER as part of the IGET web portal intended to provide easy access to geospatial education. This tutorial
Terrain Analysis. Using QGIS and SAGA
 Terrain Analysis Using QGIS and SAGA Tutorial ID: IGET_RS_010 This tutorial has been developed by BVIEER as part of the IGET web portal intended to provide easy access to geospatial education. This tutorial
WMS 9.1 Tutorial Watershed Modeling DEM Delineation Learn how to delineate a watershed using the hydrologic modeling wizard
 v. 9.1 WMS 9.1 Tutorial Learn how to delineate a watershed using the hydrologic modeling wizard Objectives Read a digital elevation model, compute flow directions, and delineate a watershed and sub-basins
Conservation Applications of LiDAR. Terrain Analysis. Workshop Exercises
 Conservation Applications of LiDAR Terrain Analysis Workshop Exercises 2012 These exercises are part of the Conservation Applications of LiDAR project a series of hands on workshops designed to help Minnesota
CRC Website and Online Book Materials Page 1 of 16
 Page 1 of 16 Appendix 2.3 Terrain Analysis with USGS DEMs OBJECTIVES The objectives of this exercise are to teach readers to: Calculate terrain attributes and create hillshade maps and contour maps. use,
Geographical Information Systems Institute. Center for Geographic Analysis, Harvard University. LAB EXERCISE 1: Basic Mapping in ArcMap
 Harvard University Introduction to ArcMap Geographical Information Systems Institute Center for Geographic Analysis, Harvard University LAB EXERCISE 1: Basic Mapping in ArcMap Individual files (lab instructions,
Spatial Analysis with Raster Datasets
 Spatial Analysis with Raster Datasets Francisco Olivera, Ph.D., P.E. Srikanth Koka Lauren Walker Aishwarya Vijaykumar Keri Clary Department of Civil Engineering April 21, 2014 Contents Brief Overview of
City of La Crosse Online Mapping Website Help Document
 City of La Crosse Online Mapping Website Help Document This document was created to assist in using the new City of La Crosse online mapping sites. When the website is first opened, a map showing the City
Learn how to delineate a watershed using the hydrologic modeling wizard
 v. 11.0 WMS 11.0 Tutorial Learn how to delineate a watershed using the hydrologic modeling wizard Objectives Import a digital elevation model, compute flow directions, and delineate a watershed and sub-basins
I CALCULATIONS WITHIN AN ATTRIBUTE TABLE
 Geology & Geophysics REU GPS/GIS 1-day workshop handout #4: Working with data in ArcGIS You will create a raster DEM by interpolating contour data, create a shaded relief image, and pull data out of the
Lab 3: Digitizing in ArcMap
 Lab 3: Digitizing in ArcMap What You ll Learn: In this Lab you ll be introduced to basic digitizing techniques using ArcMap. You should read Chapter 4 in the GIS Fundamentals textbook before starting this
WMS 10.1 Tutorial GSSHA WMS Basics Watershed Delineation using DEMs and 2D Grid Generation Delineate a watershed and create a GSSHA model from a DEM
 v. 10.1 WMS 10.1 Tutorial GSSHA WMS Basics Watershed Delineation using DEMs and 2D Grid Generation Delineate a watershed and create a GSSHA model from a DEM Objectives Learn how to delineate a watershed
Geography 281 Mapmaking with GIS Project One: Exploring the ArcMap Environment
 Geography 281 Mapmaking with GIS Project One: Exploring the ArcMap Environment This activity is designed to introduce you to the Geography Lab and to the ArcMap software within the lab environment. Before
Learn how to delineate a watershed using the hydrologic modeling wizard
 v. 10.1 WMS 10.1 Tutorial Learn how to delineate a watershed using the hydrologic modeling wizard Objectives Import a digital elevation model, compute flow directions, and delineate a watershed and sub-basins
INTRODUCTION TO GIS WORKSHOP EXERCISE
 111 Mulford Hall, College of Natural Resources, UC Berkeley (510) 643-4539 INTRODUCTION TO GIS WORKSHOP EXERCISE This exercise is a survey of some GIS and spatial analysis tools for ecological and natural
Lab 18c: Spatial Analysis III: Clip a raster file using a Polygon Shapefile
 Environmental GIS Prepared by Dr. Zhi Wang, CSUF EES Department Lab 18c: Spatial Analysis III: Clip a raster file using a Polygon Shapefile These instructions enable you to clip a raster layer in ArcMap
Developing an Interactive GIS Tool for Stream Classification in Northeast Puerto Rico
 Developing an Interactive GIS Tool for Stream Classification in Northeast Puerto Rico Lauren Stachowiak Advanced Topics in GIS Spring 2012 1 Table of Contents: Project Introduction-------------------------------------
GIS LAB 8. Raster Data Applications Watershed Delineation
 GIS LAB 8 Raster Data Applications Watershed Delineation This lab will require you to further your familiarity with raster data structures and the Spatial Analyst. The data for this lab are drawn from
WMS 9.1 Tutorial GSSHA WMS Basics Watershed Delineation using DEMs and 2D Grid Generation Delineate a watershed and create a GSSHA model from a DEM
 v. 9.1 WMS 9.1 Tutorial GSSHA WMS Basics Watershed Delineation using DEMs and 2D Grid Generation Delineate a watershed and create a GSSHA model from a DEM Objectives Learn how to delineate a watershed
Lab 3: Digitizing in ArcGIS Pro
 Lab 3: Digitizing in ArcGIS Pro What You ll Learn: In this Lab you ll be introduced to basic digitizing techniques using ArcGIS Pro. You should read Chapter 4 in the GIS Fundamentals textbook before starting
Introduction to GIS A Journey Through Gale Crater
 Introduction to GIS A Journey Through Gale Crater In this lab you will be learning how to use ArcMap, one of the most common commercial software packages for GIS (Geographic Information System). Throughout
WMS 9.1 Tutorial GSSHA Modeling Basics Stream Flow Integrate stream flow with your GSSHA overland flow model
 v. 9.1 WMS 9.1 Tutorial Integrate stream flow with your GSSHA overland flow model Objectives Learn how to add hydraulic channel routing to your GSSHA model and how to define channel properties. Learn how
v Prerequisite Tutorials GSSHA Modeling Basics Stream Flow GSSHA WMS Basics Creating Feature Objects and Mapping their Attributes to the 2D Grid
 v. 10.1 WMS 10.1 Tutorial GSSHA Modeling Basics Developing a GSSHA Model Using the Hydrologic Modeling Wizard in WMS Learn how to setup a basic GSSHA model using the hydrologic modeling wizard Objectives
WMS 8.4 Tutorial Hydraulics and Floodplain Modeling Simplified Dam Break Learn how to run a dam break simulation and delineate its floodplain
 v. 8.4 WMS 8.4 Tutorial Hydraulics and Floodplain Modeling Simplified Dam Break Learn how to run a dam break simulation and delineate its floodplain Objectives Setup a conceptual model of stream centerlines
Watershed Analysis and A Look Ahead
 Watershed Analysis and A Look Ahead 1 2 Specific Storm Flow to Grate What data do you need? Watershed boundaries for each storm sewer Net flow generated from each point across the landscape Elevation Fill
A Second Look at DEM s
 A Second Look at DEM s Overview Detailed topographic data is available for the U.S. from several sources and in several formats. Perhaps the most readily available and easy to use is the National Elevation
Using GIS to Site Minimal Excavation Helicopter Landings
 Using GIS to Site Minimal Excavation Helicopter Landings The objective of this analysis is to develop a suitability map for aid in locating helicopter landings in mountainous terrain. The tutorial uses
START>PROGRAMS>ARCGIS>
 Department of Urban Studies and Planning Spring 2006 Department of Architecture Site and Urban Systems Planning 11.304J / 4.255J GIS EXERCISE 2 Objectives: To generate the following maps using ArcGIS Software:
v. 9.1 WMS 9.1 Tutorial Watershed Modeling HEC-1 Interface Learn how to setup a basic HEC-1 model using WMS
 v. 9.1 WMS 9.1 Tutorial Learn how to setup a basic HEC-1 model using WMS Objectives Build a basic HEC-1 model from scratch using a DEM, land use, and soil data. Compute the geometric and hydrologic parameters
Stream network delineation and scaling issues with high resolution data
 Stream network delineation and scaling issues with high resolution data Roman DiBiase, Arizona State University, May 1, 2008 Abstract: In this tutorial, we will go through the process of extracting a stream
Tutorial 18: 3D and Spatial Analyst - Creating a TIN and Visual Analysis
 Tutorial 18: 3D and Spatial Analyst - Creating a TIN and Visual Analysis Module content 18.1. Creating a TIN 18.2. Spatial Analyst Viewsheds, Slopes, Hillshades and Density. 18.1 Creating a TIN Sometimes
Vector Data Analysis Working with Topographic Data. Vector data analysis working with topographic data.
 Vector Data Analysis Working with Topographic Data Vector data analysis working with topographic data. 1 Triangulated Irregular Network Triangulated Irregular Network 2 Triangulated Irregular Networks
Watershed Modeling Orange County Hydrology Using GIS Data
 v. 9.1 WMS 9.1 Tutorial Watershed Modeling Orange County Hydrology Using GIS Data Learn how to delineate sub-basins and compute soil losses for Orange County (California) hydrologic modeling Objectives
J.Welhan 5/07. Watershed Delineation Procedure
 Watershed Delineation Procedure 1. Prepare the DEM: - all grids should be in the same projection; if not, then reproject (or define and project); if in UTM, all grids must be in the same zone (if not,
GEOGRAPHIC INFORMATION SYSTEMS Lecture 25: 3D Analyst
 GEOGRAPHIC INFORMATION SYSTEMS Lecture 25: 3D Analyst 3D Analyst - 3D Analyst is an ArcGIS extension designed to work with TIN data (triangulated irregular network) - many of the tools in 3D Analyst also
HEC-RAS 5.0 Training New Zealand Workshop Guide
 HEC-RAS 5.0 Training New Zealand Workshop Guide Prepared by: Krey Price Surface Water Solutions 57 Bromfield Drive Kelmscott WA 6111 Australia Tel. +61 400 367 542 e-mail: info@surfacewater.biz website:
Introduction to GIS & Mapping: ArcGIS Desktop
 Introduction to GIS & Mapping: ArcGIS Desktop Your task in this exercise is to determine the best place to build a mixed use facility in Hudson County, NJ. In order to revitalize the community and take
Mapping 2001 Census Data Using ArcView 3.3
 Mapping 2001 Census Data Using ArcView 3.3 These procedures outline: 1. Mapping a theme (making a map) 2. Preparing the layout for printing and exporting the map into various file formats. In order to
How to...create a Video VBOX Gauge in Inkscape. So you want to create your own gauge? How about a transparent background for those text elements?
 BASIC GAUGE CREATION The Video VBox setup software is capable of using many different image formats for gauge backgrounds, static images, or logos, including Bitmaps, JPEGs, or PNG s. When the software
Map Preparation. Using QGIS
 Map Preparation Using QGIS Tutorial ID: IGET_GIS_006 This tutorial has been developed by BVIEER as part of the IGET web portal intended to provide easy access to geospatial education. This tutorial is
WMS 8.4 Tutorial Watershed Modeling MODRAT Interface (GISbased) Delineate a watershed and build a MODRAT model
 Delineate a watershed and build a MODRAT model") v. 8.4 WMS 8.4 Tutorial Watershed Modeling MODRAT Interface (GISbased) Delineate a watershed and build a MODRAT model Objectives Delineate a watershed from a DEM and derive many of the MODRAT input parameters
v. 8.4 WMS 8.4 Tutorial Watershed Modeling MODRAT Interface (GISbased) Delineate a watershed and build a MODRAT model Objectives Delineate a watershed from a DEM and derive many of the MODRAT input parameters
George Mason University Department of Civil, Environmental and Infrastructure Engineering
 George Mason University Department of Civil, Environmental and Infrastructure Engineering Dr. Celso Ferreira Prepared by Lora Baumgartner December 2015 Revised by Brian Ross July 2016 Exercise Topic: GIS
WMS 10.1 Tutorial Hydraulics and Floodplain Modeling Simplified Dam Break Learn how to run a dam break simulation and delineate its floodplain
 v. 10.1 WMS 10.1 Tutorial Hydraulics and Floodplain Modeling Simplified Dam Break Learn how to run a dam break simulation and delineate its floodplain Objectives Setup a conceptual model of stream centerlines
GGR 375 QGIS Tutorial
 GGR 375 QGIS Tutorial With text taken from: Sherman, Gary E. Shuffling Quantum GIS into the Open Source GIS Stack. Free and Open Source Software for Geospatial (FOSS4G) Conference. 2007. Available online
Data for this exercise are located in the L1 subdirectory or the class web page. Videos for this exercise are located in the class web page.
 Lesson 1: What You ll Learn: -Start ArcMap -Create a new map -Add data layers -Pan and zoom -Change data symbology -Change display properties -Set relative paths -Add layers to features -Select data -Measure
Spatial Hydrologic Modeling HEC-HMS Distributed Parameter Modeling with the MODClark Transform
 v. 9.0 WMS 9.0 Tutorial Spatial Hydrologic Modeling HEC-HMS Distributed Parameter Modeling with the MODClark Transform Setup a basic distributed MODClark model using the WMS interface Objectives In this
Word 3 Microsoft Word 2013
 Word 3 Microsoft Word 2013 Mercer County Library System Brian M. Hughes, County Executive Action Technique 1. Insert a Text Box 1. Click the Insert tab on the Ribbon. 2. Then click on Text Box in the Text
Designing & Creating your GIS Poster
 Designing & Creating your GIS Poster Revised by Carolyn Talmadge and Kyle Monahan 4/24/2017 First think about your audience and purpose, then design your poster! Here are instructions for setting up your
CONTENTS 1 INTRODUCTION 3 ARCGIS 5 START ARCMAP 11 IMPORT 1: MAP DATA 12 ADD WIND FARM DATA 21 CREATE A MAP TO INSERT IN A REPORT 32
 CONTENTS CONTENTS 1 INTRODUCTION 3 SCENARIO 3 WHAT WILL I LEARN? 3 WHAT DATA DO I HAVE? 4 ARCGIS 5 ARCMAP 6 ARCCATALOG 8 ARCTOOLBOX 9 START ARCMAP 11 IMPORT 1:250000 MAP DATA 12 CREATE A GROUP LAYER 16
Hydraulics and Floodplain Modeling Modeling with the Hydraulic Toolbox
 v. 9.1 WMS 9.1 Tutorial Hydraulics and Floodplain Modeling Modeling with the Hydraulic Toolbox Learn how to design inlet grates, detention basins, channels, and riprap using the FHWA Hydraulic Toolbox
Using Google Earth Pro
 Using Google Earth Pro (v7.3.2) University of Toronto Mississauga Library Hazel McCallion Academic Learning Centre October 2018 FURTHER ASSISTANCE If you have questions or need assistance contact Tanya
In this lab, you will create two maps. One map will show two different projections of the same data.
 Projection Exercise Part 2 of 1.963 Lab for 9/27/04 Introduction In this exercise, you will work with projections, by re-projecting a grid dataset from one projection into another. You will create a map
Combine Yield Data From Combine to Contour Map Ag Leader
 Combine Yield Data From Combine to Contour Map Ag Leader Exporting the Yield Data Using SMS Program 1. Data format On Hard Drive. 2. Start program SMS Basic. a. In the File menu choose Open. b. Click on
1. NJDEP Landscape 3.3 Viewer Interface
 Using the Landscape Project through NJDEP Landscape 3.3 Viewer Google Chrome or Mozilla Firefox are recommended for the use of this app. Navigate to the NJDEP-DFW s Landscape Project web page at www.njfishandwildlife.com/ensp/landscape/
Tutorial 1: Downloading elevation data
 Tutorial 1: Downloading elevation data Objectives In this exercise you will learn how to acquire elevation data from the website OpenTopography.org, project the dataset into a UTM coordinate system, and
Basics of Using LiDAR Data
 Conservation Applications of LiDAR Basics of Using LiDAR Data Exercise #2: Raster Processing 2013 Joel Nelson, University of Minnesota Department of Soil, Water, and Climate This exercise was developed
Designing & Creating your GIS Poster
 Designing & Creating your GIS Poster Revised by Carolyn Talmadge, 11/26/2018 First think about your audience and purpose, then design your poster! Here are instructions for setting up your poster using
Exercise 5. Height above Nearest Drainage Flood Inundation Analysis
 Exercise 5. Height above Nearest Drainage Flood Inundation Analysis GIS in Water Resources, Fall 2016 Prepared by David G Tarboton Purpose The purpose of this exercise is to illustrate the use of TauDEM
Basic Mapping: Livelihood Zones In Haiti
 Basic Mapping: Livelihood Zones In Haiti - 2009 Barbara Parmenter, revised by Carolyn Talmadge 9/10/2017 for ArcMap 10.5.1 DATA SOURCES... 1 MAPPING NETWORK DRIVES OUTSIDE THE DATA LAB... 2 SETTING UP
Basic Mapping: Livelihood Zones In Haiti
 Basic Mapping: Livelihood Zones In Haiti - 2009 Barbara Parmenter, revised by Carolyn Talmadge 9/10/2016 DATA SOURCES... 1 MAPPING NETWORK DRIVES OUTSIDE THE DATA LAB... 2 SETTING UP YOUR ARCMAP SESSION...
RiparianZone = buffer( River, 100 Feet )
") GIS Analysts perform spatial analysis when they need to derive new data from existing data. In GIS I, for example, you used the vector approach to derive a riparian buffer feature (output polygon) around
GIS Analysts perform spatial analysis when they need to derive new data from existing data. In GIS I, for example, you used the vector approach to derive a riparian buffer feature (output polygon) around
Geography 281 Mapmaking with GIS Project One: Exploring the ArcMap Environment
 Geography 281 Mapmaking with GIS Project One: Exploring the ArcMap Environment This activity is designed to introduce you to the Geography Lab and to the ArcMap software within the lab environment. Please
Lab 7c: Rainfall patterns and drainage density
 Lab 7c: Rainfall patterns and drainage density This is the third of a four-part handout for class the last two weeks before spring break. Due: Be done with this by class on 11/3. Task: Extract your watersheds
Introduction to GIS 2011
 Introduction to GIS 2011 Digital Elevation Models CREATING A TIN SURFACE FROM CONTOUR LINES 1. Start ArcCatalog from either Desktop or Start Menu. 2. In ArcCatalog, create a new folder dem under your c:\introgis_2011
Objectives Learn how GMS uses rasters to support all kinds of digital elevation models and how rasters can be used for interpolation in GMS.
 v. 9.1 GMS 9.1 Tutorial Using rasters for interpolation and visualization in GMS Objectives Learn how GMS uses rasters to support all kinds of digital elevation models and how rasters can be used for interpolation
Introduction to using QGIS for Archaeology and History Workshop by the Empirical Reasoning Center
 Introduction to using QGIS for Archaeology and History Workshop by the Empirical Reasoning Center In this workshop, we will cover the basics of working with spatial data, as well as its main uses for archaeology.
Creating Contours using ArcMap
 Creating Contours with ArcMap and ArcScene Digital elevation models (DEMs) are geospatial datasets that contain elevation values sampled according to a regularly spaced rectangular grid. They can be used
CS Multimedia and Communications REMEMBER TO BRING YOUR MEMORY STICK TO EVERY LAB! Lab 02: Introduction to Photoshop Part 1
 CS 1033 Multimedia and Communications REMEMBER TO BRING YOUR MEMORY STICK TO EVERY LAB! Lab 02: Introduction to Photoshop Part 1 Upon completion of this lab, you should be able to: Open, create new, save
Window Designer. Opening Screen: When you start Window Designer, you will see the Opening Screen. Here you will be choosing from 4 options:
 Window Designer Opening Screen: When you start Window Designer, you will see the Opening Screen. Here you will be choosing from 4 options: New Design: Use this option when no pre-built templates are available
Surface Analysis. Data for Surface Analysis. What are Surfaces 4/22/2010
 Surface Analysis Cornell University Data for Surface Analysis Vector Triangulated Irregular Networks (TIN) a surface layer where space is partitioned into a set of non-overlapping triangles Attribute and
Lab 7: Tables Operations in ArcMap
 Lab 7: Tables Operations in ArcMap What You ll Learn: This Lab provides more practice with tabular data management in ArcMap. In this Lab, we will view, select, re-order, and update tabular data. You should
Exercise 5. Height above Nearest Drainage Flood Inundation Analysis
 Exercise 5. Height above Nearest Drainage Flood Inundation Analysis GIS in Water Resources, Fall 2018 Prepared by David G Tarboton Purpose The purpose of this exercise is to learn how to calculation the
v Working with Rasters SMS 12.1 Tutorial Requirements Raster Module Map Module Mesh Module Time minutes Prerequisites Overview Tutorial
 v. 12.1 SMS 12.1 Tutorial Objectives This tutorial teaches how to import a Raster, view elevations at individual points, change display options for multiple views of the data, show the 2D profile plots,
Objectives Import DEMs from an online database. Set the display options of an imported DEM and view and edit the DEM attributes.
 v. 10.0 WMS 10.0 Tutorial Import, view, and edit digital elevation models Objectives Import DEMs from an online database. Set the display options of an imported DEM and view and edit the DEM attributes.
Digital Elevation Model & Surface Analysis
 Topics: Digital Elevation Model & Surface Analysis 1. Introduction 2. Create raster DEM 3. Examine Lidar DEM 4. Deriving secondary surface products 5. Mapping contours 6. Viewshed Analysis 7. Extract elevation
Development Authority of the North Country (DANC) Internet Mapping Application Instructions Public Viewer 1. Purpose. 2. Logging-in. 3.
 Internet Mapping Application Instructions Public Viewer 1. Purpose. 2. Logging-in. 3.") Development Authority of the North Country (DANC) Internet Mapping Application Instructions Public Viewer 1. Purpose The purpose of this document is to outline basic functionality of the DANC Internet
Development Authority of the North Country (DANC) Internet Mapping Application Instructions Public Viewer 1. Purpose The purpose of this document is to outline basic functionality of the DANC Internet
Intro to GIS (requirements: basic Windows computer skills and a flash drive)
") Introduction to GIS Intro to GIS (requirements: basic Windows computer skills and a flash drive) Part 1. What is GIS. 1. System: hardware (computers, devices), software (proprietary or free), people. 2.
Introduction to GIS Intro to GIS (requirements: basic Windows computer skills and a flash drive) Part 1. What is GIS. 1. System: hardware (computers, devices), software (proprietary or free), people. 2.