Basically, a graph is a representation of the relationship between two or more variables.
|
|
|
- Clement Melvin Nichols
- 6 years ago
- Views:
Transcription
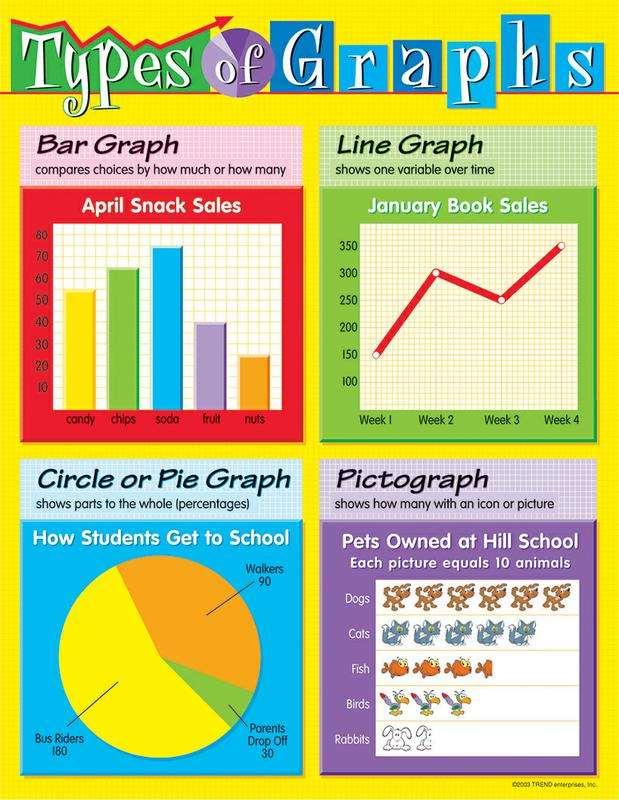
1 1 Drawing Graphs Introduction In recent years, the CSEC Integrated Science Examination, Paper 02, deals with graphical analysis. That is, data is presented in a tabular format and the student is asked to draw a graph and interpret information from it. Graphs are also commonly used when representing the results of a laboratory experiment and is an integral part of the School Based Assessment (SBA). What is a graph? 1. A diagram that exhibits a relationship, often functional, between two sets of numbers as a set of points having coordinates determined by the relationship. 2. A pictorial device, such as a pie chart or bar graph, used to illustrate quantitative relationships. ( Basically, a graph is a representation of the relationship between two or more variables. Types of Graphs The following are the most common graphs that may be encountered at CSEC: Pie chart Bar graph Line graph (The focus will be on this type)
2 2

3 3 Pie chart video: Bar graph video: Line chart video: Interpreting graphs: Or visit to download and watch these videos. Parts of a graph
4 4 Getting started 1. Look at the data to be plotted. Example: Table 1 showing the distance covered by the Stones family in a seven hour road trip. Time (h) Distance (km) In the example above, Time and Distance are the two variables being compared. 2. Insert relevant information on the graph page, especially if it is being done in the SBA notebook. Information such as Date, Lab # and Page. The Date and Lab # should be the SAME as the Date and Lab # of the lab report. 3. The height (vertical distance) of the graph page is greater than the width (horizontal distance). That is, the number of grids vertically is greater than the number of grids horizontally. 4. A 1cm grid consists of 5 subdivisions vertically and horizontally while a 2cm grid consists of double that amount, that is, 10 subdivisions vertically and horizontally.


5 5 Date: Lab: Page: Vertical distance 2 cm grid Horizontal distance 1 cm grid
6 6 Axes A graph consists of two axes. The horizontal line drawn at the bottom of the graph is called the x-axis. The vertical line drawn at the leftmost part of the graph is called the y-axis. It should be noted that the x and y axes must touch one another. In the case of CSEC Integrated Science, this is the only orientation that the axes will take since negative values are never used. (Refer to Parts of a graph ) Which variable goes on the x-axis and which on the y-axis? Variables Variables can be classified as either Independent or Dependent. The independent variable is put on the x-axis. It is the variable that does not change or depend on another. The dependent variable is placed on the y-axis. It is the variable that is being measured or is dependent on the other. In the case of our example, Time is the independent variable and Distance is the dependent variable since Distance travelled cannot determine the Time, and likewise, Time keeps ticking regardless of how far the family travelled. x-axis y-axis Time (h) Distance (km) In most cases, the table of data lists the independent variable (x-axis) first! Before drawing in the axes lines, determine which variable contains the smaller range. Remember that a graph page contains different number of grids vertically and horizontally.

7 7 Looking once again at the example, both orientations may be used since both have the same ranges, that is, Time ranges from 1 to 7 whereas Distance ranges from 10 to 70, which is essentially 7 units each. Only if the range on the x axis is bigger than the y axis, Orientation 2 should be used. Orientation 1 x-axis contains the smaller range Orientation 2 x-axis contains the larger range
 The axis label should be placed leaving room to insert the values for each variable.")
8 Distance (km) 8 Labels After the axes have been drawn in (pencil and ruler), they should both be labelled. This is done by simply stating the variable and its corresponding unit in brackets. Time (h) The axis label should be placed leaving room to insert the values for each variable. Title At this point where the axes have both been labelled, a title of the graph can be inserted at the top of the graph page. The title is stated as follows: Graph 1 showing Dependent variable against (or versus) the Independent variable. Example: Graph 1 showing Distance (km) against Time (h)

9 9 Remember the title of the table in the example? Table 1 showing the distance covered by the Stones family in a seven hour road trip. Simply replace Table 1 with Graph 1 to get the title of your graph! Example 2: Graph 1 showing distance covered by the Stones family during a seven hour road trip. Graph 1 showing Distance covered by the Stones family during a seven hour road trip.
10 10 Scale Values corresponding to each variable must now be inserted on each axis. This must be done at equal intervals away from the starting point (usually zero) trying to occupy as much of the graph page as possible. Looking at the example: Time (h) Distance (km) The x-axis ranges from 1 to 7 but some graph pages have up to 18 1cm intervals. Therefore, it would be better to space markers at 2cm intervals to maximize space. Time (h) Markers at 2cm intervals Next, insert values at each marker using a simple common multiple. Note: A common mistake of students is to insert the exact values found in the table.

11 h 1h 1h 3h? Time (h) Time (h) Similarly, insert the markers and values on the y-axis. The y-axis goes from 10 to 70 therefore a multiple of 10 is used. Since the y-axis can have up to 23 1cm intervals, it would be better to space out values every 2cm as well.

12 Distance (km)
13 13 It is not necessary to stop at the last value. Additional values may be inserted to make the graph look complete or in case any extrapolation of data is required. The Scales used on each axis must be inserted on the graph where it does not interfere with the graph itself. This should, therefore, be inserted AFTER the graph has been completed. (See Plotting Coordinates ) In General: Scale: On the x axis cm represents unit(s) On the y axis cm represents unit(s) Example: Scale: On the x axis 2cm represents 1 unit On the y axis 2cm represents 10 units OR Scale: On the x axis 2cm represents 1 hour On the y axis 2cm represents 10 km
 Time (h) 1 2 3 7 Distance (km) 10 20 30 70 From the table, the first coordinate is 1, 10.")
14 14 Plotting Coordinates A coordinate indicates the point where two variables meet or intersect. The x axis value is stated first in the form of (x, y) Time (h) Distance (km) From the table, the first coordinate is 1, 10. (Re: Time is on the x axis and Distance on the y axis) Step 1 Look for the x value (1 on the x axis). This value runs vertically.
15 15 Step 2 Look for the y value (10 on the y axis). This value runs horizontally. Point of Intersection (1, 10) The point where both lines intersect is the (x, y) coordinate. In this case, (1, 10). The point is marked by either an x or an. Note: the Red and Green dotted lines serve as a guide and should not be drawn in the graph.
16 16
17 17 Step 3 Continue plotting the points from the table. 2 nd coordinate (2, 20) 3 rd coordinate (3, 30) and so on. Step 4 Draw in the graph line. This can be done by joining the coordinates using a ruler and pencil. In most cases, the graph line expected is stated. For this example, the best straight line is drawn. (See Graph Lines )
18 18 Scale: On the x axis 2cm represents 1 h On the y axis 2cm represents 10km The Scale can now be inserted in a clear part of the graph! Two or more graph lines can be inserted using the same axes. In this case, a Legend should be inserted to differentiate between them. This can be done using different colour ink for the graph line (preferably black or blue), different plot symbols or labelling the end of the graph lines.
 1 2 3 4.5 7 Distance (km) 10 20 30 45 70 Let s look for the x value of 4.5. 1cm 4.5 There are 10 subdivisions between 4 and 5. Since 4.")
19 19 Example: Legend BOYS GIRLS Interpretation of Scale Subunits Plotting of the coordinates in the example given is straight-forward, but, supposed there were values that did not run along the labelled lines? Time (h) Distance (km) Let s look for the x value of cm 4.5 There are 10 subdivisions between 4 and 5. Since 4.5 (or 4 ½) is half-way between 4 and 5, this value will fall on the 1cm marker.
 So, 4.5 is found on the 5 th subdivision between 4 and 5. Let s look for the y axis value of 45.")
20 20 Another way of finding the value is to determine the value of each sub-division. 1/10 = 0.1 Difference between the upper value (5) and the lower value (4) No. of subdivisions Value of each subdivision Time (h) So, 4.5 is found on the 5 th subdivision between 4 and 5. Let s look for the y axis value of Once again, 45 is mid-way between 40 and 50. That is, it lies on the 1cm mark between the upper value (50) and the lower value (40).
21 Distance (km) 21 The value of each subdivision could also be determined as before. 10/10 = 1 Difference between the upper value (50) and the lower value (40) No. of subdivisions Value of each subdivision
22 22 The new coordinate on the graph appears as follows: Let s assume that the scale was altered so that 1cm represented 1 unit instead of 2cm representing 1 unit. This would mean that the number of subdivisions between 4 and 5 on the x axis would now be 5 instead of 10. Likewise, the number of subdivisions between 40 and 50 on the y axis would also be 5 instead of 10. This will change the value of each subdivision.
23 Distance (km) 23 On the x axis: 1/5 = 0.2 Difference between the upper value (5) and the lower value (4) No. of subdivisions Value of each subdivision Time (h) On the y axis: 10/5 = 2 Difference between the upper value (50) and the lower value (40) No. of subdivisions Value of each subdivision Note: There is NO 4.5 line on the x axis and NO 45 line on the y axis. So where do these values go?

24 Distance (km) 24 (4.5, 45) Time (h) Think about it!!! What if 1cm represented 5 units. What would be the value of each subdivision? What if 4cm represented 10 units. What would be the value of each subdivision? What if 2cm represented 25 units. What would be the value of each subdivision? Difference bet. upper & lower No. of subdivisions Value of each subdivision
25 25 Reading the graph Extrapolation of data The graph line represents the relationship between two variables. It can be used to find unknown values if the corresponding value is known. Meaning, if the x value is known, the y value can be found using the graph line and vice versa. Note: The graph line does not have to be straight to do this. Example: What distance would the Stones family travelled in 3.7 hours? (3.7, y)
26 26 Find the value 3.7 on the x axis. Draw a line along it until it touches the graph line. (red arrow) At this point, draw a line horizontally until it touches the y axis. (green arrow) From the example, the corresponding y value is 37km. In other words, the Stones family travelled 37km in 3.7 hours. (3.7, 37) Example 2: How long would it take the Stones family to travel 62km? (x, 62)
27 27 Find the value 62 on the y axis. Draw a line along it until it touches the graph line. (red arrow) At this point, draw a line vertically until it touches the x axis. (green arrow) From the example, the corresponding x value is 6.2 hours. In other words, it took the Stones family 6.2 hours to travel a distance of 62km. (6.2, 62) There are times where values may NOT fall on the graph line. In these cases, the graph line could be extended to fall within the range of the unknown value. Unlike before when plotting coordinates, the lines drawn on the graph to find unknown values should be left there. This shows the examiner where the values came from in your answer. Reading the lines Straight lines The shape of the graph gives an overview of the relationship between two variables. Use the variables on both axes to describe the shape of the line, read from left to right. Let s look at a few relationships commonly found. Keep in mind that there are different ways to say the same thing. Proportional relationship As the x value increases, the y value increases by an equal number of units. Example: If x increases from 1 to 2 (doubles) by 1 unit, the y value increases from 10 to 20 (doubles) by 1 unit.
28 28 Inversely Proportional relationship As the x value increases, the y value decreases by an equal number of units. Example: If x increases from 1 to 2 by 1 unit the y value decreases from 30 to 20 by 1 unit. Weak positive relationship As the x value increases, the y value increases by a smaller amount. Example: If x increases from 1 to 2 by 1 unit the y value increases from 22 to 25 by less than 1 unit. Strong positive relationship As the x value increases, the y value increases by a greater amount. Example: If x increases from 1 to 2 by 1 unit the y value increases from 10 to 30 by greater than 1 unit.
29 29 Weak negative relationship As the x value decreases, the y value increases by a smaller amount. Example: If x decreases from 1 to 2 by 1 unit the y value decreases from 11 to 9 by less than 1 unit. Strong negative relationship As the x value decreases, the y value decreases by a greater amount. Example: If x decreases from 1 to 2 by 1 unit the y value decreases from 40 to 15 by greater than 1 unit. Constant / No change As x increases, y remains the same
30 Temp ( 0 C) 30 Constant / No change As y increases, x remains the same Curves Gradual then Drastic then Drastic then Gradual then drastic increase gradual increase gradual decrease drastic decrease Different relationships on the same curve / lines Use a combination of straight and curve line graphs to describe the graphs below. Remember to use the variables to describe what happens to the graph line as one moves from left to right. Example 1: Melting Curve Time (mins)

31 Height (cm) 31 General description: At zero mins, there is a decrease in temperature from 40 to 30 0 C until 1.5mins where there is no change until 2.5 mins. The temperature then falls from 25 to 10 0 C until 4 mins. Example 2: Growth Curve General description (no values used): There is no change in height initially then a drastic increase which eventually slows down as age increases. Age (years)

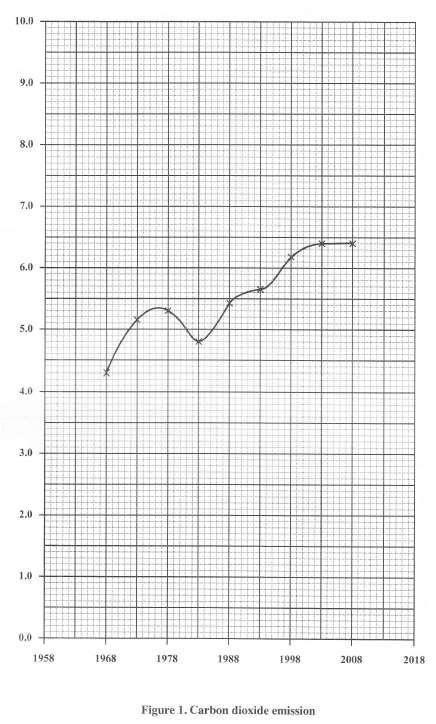
32 32 Other common graphs What about graphs that only have ONE set of numerical values? Example: Bar graph Table 1 showing carbon dioxide emissions per capita Country Australia US Canada Russia CO 2 emissions (metric tonnes) Note: The alphabetical values are placed on the x axis at equal intervals apart. Sometimes names are replaced by years. The same procedure applies by just spacing the data given at equal intervals apart regardless of value.

33 33 Example 2: Pie Chart Table 1 showing CO 2 emissions in the United States of America Agriculture Commercial and Residential Electricity Industry Transportation 8% 11% 33% 20% 28% In CSEC Integrated Science Paper 02, there is the tendency to list TWO y axis values. However, the graph usually involves plotting just one set of coordinates. Example 3: CSEC June 2011 The x axis values are the years (again this is usually placed first on a table). The two y axis values are China and USA.
34 34 If asked to plot a graph to represent the data for China, the information taken from the table would be as follows: Similarly, if asked to plot a graph to represent the data for USA, the x axis values remain the same but the y axis shifts to the column with USA values:

35 35 Examples from CSEC Integrated Science Try the following questions from CSEC on new graph pages. Ensure that all the elements are present. Labelled Axes Title Scale Legend You can download these past papers in its entirety at The Science Exchange June 2011 *Plot a graph to represent the data for China using the same axes and scale. USA has already been plotted. (Remember to use different plotting symbols or ink. Similarly, graph lines can be labelled.)
36 36

37 37 June 2012
38 38

39 39 June 2013 *Plot a graph to represent the data for the tobacco smokers

40 40 June 2014

41 41 June 2015

42 42 June 2016
43 43 Conclusion It is the hope of the author that the preceding information will not only assist students, but also teachers when encountering graphs at all levels of Integrated Science. Recently, the Ministry of Education of Trinidad and Tobago has reformulated the Science Curriculum to stress on the various aspects of Integrated Science, that is, Biology, Chemistry and Physics. However, the fact that CSEC Integrated Science still exists, the guidelines remain 100% relevant to the syllabus. Having dealt with students who have not understood the concept of graphs for some time, I am confident that these guidelines will cut down on the time spent drawing graphs in the classroom, increasing students self-efficacy and teacher motivation. Feel free to visit my website at and Facebook page The Science Experiment for your comments / questions / suggestions. Ron Mahabalsingh July 19 th 2016
Decimals should be spoken digit by digit eg 0.34 is Zero (or nought) point three four (NOT thirty four).
 point three four (NOT thirty four).") Numeracy Essentials Section 1 Number Skills Reading and writing numbers All numbers should be written correctly. Most pupils are able to read, write and say numbers up to a thousand, but often have difficulty
Numeracy Essentials Section 1 Number Skills Reading and writing numbers All numbers should be written correctly. Most pupils are able to read, write and say numbers up to a thousand, but often have difficulty
Making Science Graphs and Interpreting Data
 Making Science Graphs and Interpreting Data Eye Opener: 5 mins What do you see? What do you think? Look up terms you don t know What do Graphs Tell You? A graph is a way of expressing a relationship between
At the end of the chapter, you will learn to: Present data in textual form. Construct different types of table and graphs
 DATA PRESENTATION At the end of the chapter, you will learn to: Present data in textual form Construct different types of table and graphs Identify the characteristics of a good table and graph Identify
Processing, representing and interpreting data
 Processing, representing and interpreting data 21 CHAPTER 2.1 A head CHAPTER 17 21.1 polygons A diagram can be drawn from grouped discrete data. A diagram looks the same as a bar chart except that the
GRAPHING WORKSHOP. A graph of an equation is an illustration of a set of points whose coordinates satisfy the equation.
 GRAPHING WORKSHOP A graph of an equation is an illustration of a set of points whose coordinates satisfy the equation. The figure below shows a straight line drawn through the three points (2, 3), (-3,-2),
Math 7 Notes - Unit 4 Pattern & Functions
 Math 7 Notes - Unit 4 Pattern & Functions Syllabus Objective: (3.2) The student will create tables, charts, and graphs to extend a pattern in order to describe a linear rule, including integer values.
Microscopic Measurement
 Microscopic Measurement Estimating Specimen Size : The area of the slide that you see when you look through a microscope is called the " field of view ". If you know the diameter of your field of view,
Spreadsheet and Graphing Exercise Biology 210 Introduction to Research
 1 Spreadsheet and Graphing Exercise Biology 210 Introduction to Research There are many good spreadsheet programs for analyzing data. In this class we will use MS Excel. Below are a series of examples
STRAIGHT LINE GRAPHS THE COORDINATES OF A POINT. The coordinates of any point are written as an ordered pair (x, y)
") THE COORDINATES OF A POINT STRAIGHT LINE GRAPHS The coordinates of any point are written as an ordered pair (x, y) Point P in the diagram has coordinates (2, 3). Its horizontal distance along the x axis
THE COORDINATES OF A POINT STRAIGHT LINE GRAPHS The coordinates of any point are written as an ordered pair (x, y) Point P in the diagram has coordinates (2, 3). Its horizontal distance along the x axis
Transformations in the Plane - Activity 1 Reflections in axes and an oblique line.
 Name: Class: p 5 Maths Helper Plus Resource Set. Copyright 00 Bruce A. Vaughan, Teachers Choice Software Transformations in the Plane - Activity Reflections in axes and an oblique line. ) On the diagram
Name: Date: Period: Chapter 2. Section 1: Describing Location in a Distribution
 Name: Date: Period: Chapter 2 Section 1: Describing Location in a Distribution Suppose you earned an 86 on a statistics quiz. The question is: should you be satisfied with this score? What if it is the
Objective: Construct a coordinate system on a plane.
 Lesson 2 Objective: Construct a coordinate system on a plane. Suggested Lesson Structure Fluency Practice Application Problem Concept Development Student Debrief Total Time (10 minutes) (7 minutes) (33
Elementary Statistics
 1 Elementary Statistics Introduction Statistics is the collection of methods for planning experiments, obtaining data, and then organizing, summarizing, presenting, analyzing, interpreting, and drawing
Students interpret the meaning of the point of intersection of two graphs and use analytic tools to find its coordinates.
 Student Outcomes Students interpret the meaning of the point of intersection of two graphs and use analytic tools to find its coordinates. Classwork Example 1 (7 minutes) Have students read the situation
Select Cases. Select Cases GRAPHS. The Select Cases command excludes from further. selection criteria. Select Use filter variables
 Select Cases GRAPHS The Select Cases command excludes from further analysis all those cases that do not meet specified selection criteria. Select Cases For a subset of the datafile, use Select Cases. In
Use of GeoGebra in teaching about central tendency and spread variability
 CREAT. MATH. INFORM. 21 (2012), No. 1, 57-64 Online version at http://creative-mathematics.ubm.ro/ Print Edition: ISSN 1584-286X Online Edition: ISSN 1843-441X Use of GeoGebra in teaching about central
The basic arrangement of numeric data is called an ARRAY. Array is the derived data from fundamental data Example :- To store marks of 50 student
 Organizing data Learning Outcome 1. make an array 2. divide the array into class intervals 3. describe the characteristics of a table 4. construct a frequency distribution table 5. constructing a composite
 Specific Objectives Students will understand that that the family of equation corresponds with the shape of the graph. Students will be able to create a graph of an equation by plotting points. In lesson
Plotting Graphs. Error Bars
 E Plotting Graphs Construct your graphs in Excel using the method outlined in the Graphing and Error Analysis lab (in the Phys 124/144/130 laboratory manual). Always choose the x-y scatter plot. Number
Systems of Linear Equations and Graphs
 8.1 Systems of Linear Equations and Graphs Focus on explaining the meaning of the point of intersection of two linear equations solving systems of linear equations by creating graphs, with and without
My Target Level 1c. My areas for development:
 My Target Level 1c I can read numbers up to 10 (R) I can count up to 10 objects (R) I can say the number names in order up to 20 (R) I can write at least 4 numbers up to 10. When someone gives me a small
Rational Numbers and the Coordinate Plane
 Rational Numbers and the Coordinate Plane LAUNCH (8 MIN) Before How can you use the numbers placed on the grid to figure out the scale that is used? Can you tell what the signs of the x- and y-coordinates
B. Graphing Representation of Data
 B Graphing Representation of Data The second way of displaying data is by use of graphs Although such visual aids are even easier to read than tables, they often do not give the same detail It is essential
Chapter 12: Quadratic and Cubic Graphs
 Chapter 12: Quadratic and Cubic Graphs Section 12.1 Quadratic Graphs x 2 + 2 a 2 + 2a - 6 r r 2 x 2 5x + 8 2y 2 + 9y + 2 All the above equations contain a squared number. They are therefore called quadratic
Mathematics Department Inverclyde Academy
 Common Factors I can gather like terms together correctly. I can substitute letters for values and evaluate expressions. I can multiply a bracket by a number. I can use common factor to factorise a sum
Bar Graphs and Dot Plots
 CONDENSED LESSON 1.1 Bar Graphs and Dot Plots In this lesson you will interpret and create a variety of graphs find some summary values for a data set draw conclusions about a data set based on graphs
UNIT 15 GRAPHICAL PRESENTATION OF DATA-I
 UNIT 15 GRAPHICAL PRESENTATION OF DATA-I Graphical Presentation of Data-I Structure 15.1 Introduction Objectives 15.2 Graphical Presentation 15.3 Types of Graphs Histogram Frequency Polygon Frequency Curve
Displacement-time and Velocity-time Graphs
 PhysicsFactsheet April Number Displacement- and Velocity- Graphs This Factsheet explains how motion can be described using graphs, in particular how - graphs and - graphs can be used. Displacement- graphs
ELGIN ACADEMY Mathematics Department Evaluation Booklet (Main) Name Reg
 Name Reg") ELGIN ACADEMY Mathematics Department Evaluation Booklet (Main) Name Reg CfEM You should be able to use this evaluation booklet to help chart your progress in the Maths department from August in S1 until
ELGIN ACADEMY Mathematics Department Evaluation Booklet (Main) Name Reg CfEM You should be able to use this evaluation booklet to help chart your progress in the Maths department from August in S1 until
DOWNLOAD PDF BIG IDEAS MATH VERTICAL SHRINK OF A PARABOLA
 Chapter 1 : BioMath: Transformation of Graphs Use the results in part (a) to identify the vertex of the parabola. c. Find a vertical line on your graph paper so that when you fold the paper, the left portion
Integrated Curriculum for Secondary Schools. MATHEMATICS Form 1
 MINISTRY OF EDUCATION MALAYSIA Integrated Curriculum for Secondary Schools Curriculum Specifications MATHEMATICS Form 1 Curriculum Development Centre Ministry of Education Malaysia 2002 CONTENTS Page WHOLE
Using the Best of Both!
 Using the Best of Both! A Guide to Using Connected Mathematics 2 with Prentice Hall Mathematics Courses 1, 2, 3 2012, and Algebra Readiness MatBro111707BestOfBothPH10&CMP2.indd 1 6/7/11 11:59 AM Using
Continued =5.28
 Chapter Nine Graphing and Introduction to Statistics Learning Objectives: Ch 9 What is mean, medians, and mode? Tables, pictographs, and bar charts Line graphs and predications Creating bar graphs and
Curriculum Maps for Progress in Understanding Mathematics Assessment Termly content for Year 6
 Term-by-term mathematics assessment across primary school Curriculum Maps for Progress in Understanding Mathematics Assessment Termly content for Year 6 The PUMA tests provide thorough coverage of the
Maths Revision Worksheet: Algebra I Week 1 Revision 5 Problems per night
 2 nd Year Maths Revision Worksheet: Algebra I Maths Revision Worksheet: Algebra I Week 1 Revision 5 Problems per night 1. I know how to add and subtract positive and negative numbers. 2. I know how to
Box Plots. OpenStax College
 Connexions module: m46920 1 Box Plots OpenStax College This work is produced by The Connexions Project and licensed under the Creative Commons Attribution License 3.0 Box plots (also called box-and-whisker
Open a new Excel workbook and look for the Standard Toolbar.
 This activity shows how to use a spreadsheet to draw line graphs. Open a new Excel workbook and look for the Standard Toolbar. If it is not there, left click on View then Toolbars, then Standard to make
Linear Equations in Two Variables IMPORTANT TERMS, DEFINITIONS AND RESULTS ANIL TUTORIALS SUMMATIVE ASSESSMENT MULTIPLE CHOICE QUESTIONS
 Linear Equations in Two Variables IMPORTANT TERMS, DEFINITIONS AND RESULTS l An equation of the form ax + by + c = 0, where a, b, c are real numbers, is called a linear equation in x and y. For example,
Univariate Statistics Summary
 Further Maths Univariate Statistics Summary Types of Data Data can be classified as categorical or numerical. Categorical data are observations or records that are arranged according to category. For example:
(Refer Slide Time: 00:02:02)
") Computer Graphics Prof. Sukhendu Das Dept. of Computer Science and Engineering Indian Institute of Technology, Madras Lecture - 20 Clipping: Lines and Polygons Hello and welcome everybody to the lecture
Computer Graphics Prof. Sukhendu Das Dept. of Computer Science and Engineering Indian Institute of Technology, Madras Lecture - 20 Clipping: Lines and Polygons Hello and welcome everybody to the lecture
Age Related Maths Expectations
 Step 1 Times Tables Addition Subtraction Multiplication Division Fractions Decimals Percentage & I can count in 2 s, 5 s and 10 s from 0 to 100 I can add in 1 s using practical resources I can add in 1
Name: Tutor s
 Name: Tutor s Email: Bring a couple, just in case! Necessary Equipment: Black Pen Pencil Rubber Pencil Sharpener Scientific Calculator Ruler Protractor (Pair of) Compasses 018 AQA Exam Dates Paper 1 4
Chapter 2: Frequency Distributions
 Chapter 2: Frequency Distributions Chapter Outline 2.1 Introduction to Frequency Distributions 2.2 Frequency Distribution Tables Obtaining ΣX from a Frequency Distribution Table Proportions and Percentages
Introduction to Geospatial Analysis
 Introduction to Geospatial Analysis Introduction to Geospatial Analysis 1 Descriptive Statistics Descriptive statistics. 2 What and Why? Descriptive Statistics Quantitative description of data Why? Allow
Objectives. Materials
 Activity 13 Objectives Understand what a slope field represents in terms of Create a slope field for a given differential equation Materials TI-84 Plus / TI-83 Plus Graph paper Introduction One of the
Making Science Graphs and Interpreting Data
 Making Science Graphs and Interpreting Data Scientific Graphs: Most scientific graphs are made as line graphs. There may be times when other types would be appropriate, but they are rare. The lines on
Chapter 2 Organizing and Graphing Data. 2.1 Organizing and Graphing Qualitative Data
 Chapter 2 Organizing and Graphing Data 2.1 Organizing and Graphing Qualitative Data 2.2 Organizing and Graphing Quantitative Data 2.3 Stem-and-leaf Displays 2.4 Dotplots 2.1 Organizing and Graphing Qualitative
8 th Grade Mathematics Unpacked Content For the new Common Core standards that will be effective in all North Carolina schools in the
 8 th Grade Mathematics Unpacked Content For the new Common Core standards that will be effective in all North Carolina schools in the 2012-13. This document is designed to help North Carolina educators
a 2 + 2a - 6 r r 2 To draw quadratic graphs, we shall be using the method we used for drawing the straight line graphs.
 Chapter 12: Section 12.1 Quadratic Graphs x 2 + 2 a 2 + 2a - 6 r r 2 x 2 5x + 8 2 2 + 9 + 2 All the above equations contain a squared number. The are therefore called quadratic expressions or quadratic
Big Ideas of Mathematics, Reception
 Big Ideas of Mathematics, Reception Number Quantities 1, 2 and 3 can be perceptually subitized (recognised as one group without counting) Quantities 4 and 5 can be conceptually subitized (the quantity
GRAPHING BAYOUSIDE CLASSROOM DATA
 LUMCON S BAYOUSIDE CLASSROOM GRAPHING BAYOUSIDE CLASSROOM DATA Focus/Overview This activity allows students to answer questions about their environment using data collected during water sampling. Learning
Motion I. Goals and Introduction
 Motion I Goals and Introduction As you have probably already seen in lecture or homework, it is important to develop a strong understanding of how to model an object s motion for success in this course.
LEADERS. Long and Medium Term Planning
 LEADERS Long and Medium Term Planning Medium-Term Planning W Title Curriculum objective 1 Place value and rounding off 2 Mental and written addition and subtraction of large numbers To read, write, order
QUADRATIC AND CUBIC GRAPHS
 NAME SCHOOL INDEX NUMBER DATE QUADRATIC AND CUBIC GRAPHS KCSE 1989 2012 Form 3 Mathematics Working Space 1. 1989 Q22 P1 (a) Using the grid provided below draw the graph of y = -2x 2 + x + 8 for values
Percentage and Ratio. Properties of Number. Perimeter and Area. Position and Direction MATHS LADDER CONTENTS LEARNING LADDERS
 MATHS NAME CLASS CONTENTS Page 4 Page 6 Page 8 Page 10 Page 12 Page 14 Page 18 Page 20 Page 22 Page 26 Page 28 Page 32 Page 34 Page 36 Page 40 Page 44 Page 46 Times Tables Addition Subtraction Multiplication
Direct Variations DIRECT AND INVERSE VARIATIONS 19. Name
 DIRECT AND INVERSE VARIATIONS 19 Direct Variations Name Of the many relationships that two variables can have, one category is called a direct variation. Use the description and example of direct variation
Millburn Academy. Numeracy Across Learning. Name. Department
 Millburn Academy Numeracy Across Learning Name Department Introduction Aim of this Booklet This booklet has been produced as the first step towards teaching numeracy across the curriculum in a consistent
8 th Grade Pre Algebra Pacing Guide 1 st Nine Weeks
 8 th Grade Pre Algebra Pacing Guide 1 st Nine Weeks MS Objective CCSS Standard I Can Statements Included in MS Framework + Included in Phase 1 infusion Included in Phase 2 infusion 1a. Define, classify,
Cambridge International Examinations Cambridge International General Certificate of Secondary Education
 Cambridge International Examinations Cambridge International General Certificate of Secondary Education *7274008958* MATHEMATICS 0580/43 Paper 4 (Extended) October/November 2018 2 hours 30 minutes Candidates
Math 1201 Unit 5: Relations & Functions. Ch. 5 Notes
 Math 1201 Unit 5: Relations & Functions Read Building On, Big Ideas, and New Vocabulary, p. 254 text. 5.1 Representing Relations (0.5 class) Read Lesson Focus p. 256 text. Outcomes Ch. 5 Notes 1. Define
Downloaded from
 UNIT 2 WHAT IS STATISTICS? Researchers deal with a large amount of data and have to draw dependable conclusions on the basis of data collected for the purpose. Statistics help the researchers in making
4. Write sets of directions for how to check for direct variation. How to check for direct variation by analyzing the graph :
 Name Direct Variations There are many relationships that two variables can have. One of these relationships is called a direct variation. Use the description and example of direct variation to help you
Box It Up (A Graphical Look)
") . Name Date A c t i v i t y 1 0 Box It Up (A Graphical Look) The Problem Ms. Hawkins, the physical sciences teacher at Hinthe Middle School, needs several open-topped boxes for storing laboratory materials.
. Name Date A c t i v i t y 1 0 Box It Up (A Graphical Look) The Problem Ms. Hawkins, the physical sciences teacher at Hinthe Middle School, needs several open-topped boxes for storing laboratory materials.
MATHS. years 4,5,6. malmesbury c of e primary school NAME CLASS
 MATHS years 4,5,6 NAME CLASS malmesbury c of e primary school LEARNING LADDERS CONTENTS Ladder Title Times Tables Addition Subtraction Multiplication Division Fractions Decimals Percentage and Ratio Problem
2.1 Objectives. Math Chapter 2. Chapter 2. Variable. Categorical Variable EXPLORING DATA WITH GRAPHS AND NUMERICAL SUMMARIES
 EXPLORING DATA WITH GRAPHS AND NUMERICAL SUMMARIES Chapter 2 2.1 Objectives 2.1 What Are the Types of Data? www.managementscientist.org 1. Know the definitions of a. Variable b. Categorical versus quantitative
How Do I Choose Which Type of Graph to Use?
 How Do I Choose Which Type of Graph to Use? When to Use...... a Line graph. Line graphs are used to track changes over short and long periods of time. When smaller changes exist, line graphs are better
Selby Abbey C.E. (VC) Primary School Mathematics Curriculum
 Primary School Mathematics Curriculum") Selby Abbey C.E. (VC) Primary School Mathematics Curriculum 2018-2019 Essential Characteristics of Mathematicians An understanding of the important concepts and an ability to make connections within mathematics.
Selby Abbey C.E. (VC) Primary School Mathematics Curriculum 2018-2019 Essential Characteristics of Mathematicians An understanding of the important concepts and an ability to make connections within mathematics.
LASER s Level 2 Maths Course - Summary
 LASER s Level 2 Maths Course - Summary Unit Code Unit Title Credits Level Status SER945 Shape, Space and Measurement 3 2 Mandatory SER946 Collecting, Recording and Analysing Data 3 2 Mandatory SER947 Development
Alabama State Standards correlated to Merit Software Math Programs
 Alabama State Standards correlated to Merit Software Math Programs The Classroom Improvement Section is responsible for the development, implementation, and assessment of the minimum curriculum content
3D shapes introduction
 3D shapes introduction 2D shapes have 2 dimensions width and height. They re flat. height 3D shapes have 3 dimensions height, width and depth. Sometimes we call them solids. When we draw them, we often
Chapter 5. Transforming Shapes
 Chapter 5 Transforming Shapes It is difficult to walk through daily life without being able to see geometric transformations in your surroundings. Notice how the leaves of plants, for example, are almost
The Function Elevator
 Math Objectives Students will create a piecewise linear graph to model a real life scenario. Students will identify connections between position and velocity functions and their graphs. Students will create
Mathematics; Gateshead Assessment Profile (MGAP) Year 6 Understanding and investigating within number
 Year 6 Understanding and investigating within number") Year 6 Understanding and investigating within number Place value, ordering and rounding Counting reading, writing, comparing, ordering and rounding whole numbers using place value Properties of numbers
Year 6 Understanding and investigating within number Place value, ordering and rounding Counting reading, writing, comparing, ordering and rounding whole numbers using place value Properties of numbers
Multiply using the grid method.
 Multiply using the grid method. Learning Objective Read and plot coordinates in all quadrants DEFINITION Grid A pattern of horizontal and vertical lines, usually forming squares. DEFINITION Coordinate
Aston Hall s A-Z of mathematical terms
 Aston Hall s A-Z of mathematical terms The following guide is a glossary of mathematical terms, covering the concepts children are taught in FS2, KS1 and KS2. This may be useful to clear up any homework
Year 6 Mathematics Overview
 Year 6 Mathematics Overview Term Strand National Curriculum 2014 Objectives Focus Sequence Autumn 1 Number and Place Value read, write, order and compare numbers up to 10 000 000 and determine the value
Data Presentation. Figure 1. Hand drawn data sheet
 Data Presentation The purpose of putting results of experiments into graphs, charts and tables is two-fold. First, it is a visual way to look at the data and see what happened and make interpretations.
Mathematics: Planning and Assessment from National Curriculum Year 1
 Mathematics: Planning and Assessment from National Curriculum Year Number & Place Value Addition & Subtraction Multiplication & Division Fractions Measurement Geometry: Properties of Shapes Count to and
Summary Of Topics covered in Year 7. Topic All pupils should Most pupils should Some pupils should Learn formal methods for
 Summary Of Topics covered in Year 7 Topic All pupils should Most pupils should Some pupils should Learn formal methods for Have a understanding of computing multiplication Use the order of basic number
Course Guide (/8/teachers/teacher_course_guide.html) Print (/8/teachers/print_materials.html) LMS (/8
 Print (/8/teachers/print_materials.html) LMS (/8") (http://openupresources.org)menu Close OUR Curriculum (http://openupresources.org) Professional Development (http://openupresources.org/illustrative-mathematics-professional-development) Implementation
(http://openupresources.org)menu Close OUR Curriculum (http://openupresources.org) Professional Development (http://openupresources.org/illustrative-mathematics-professional-development) Implementation
AP Calculus. Extreme Values: Graphically. Slide 1 / 163 Slide 2 / 163. Slide 4 / 163. Slide 3 / 163. Slide 5 / 163. Slide 6 / 163
 Slide 1 / 163 Slide 2 / 163 AP Calculus Analyzing Functions Using Derivatives 2015-11-04 www.njctl.org Slide 3 / 163 Table of Contents click on the topic to go to that section Slide 4 / 163 Extreme Values
Mill Hill School. 13+ Entrance Examination Mathematics. January Time: 1 hour. School: Mark: Materials required for examination
 Name: School: Mark: Mill Hill School 13+ Entrance Examination Mathematics January 2014 Time: 1 hour Materials required for examination Ruler, protractor, compasses, pen, pencil, eraser Calculators must
Fractions, Decimals, Ratio and Percentages (FDRP) Measures (MEA)
 Measures (MEA)") Termly assessment Number and Place Value (NPV) Addition and Subtraction (AS) Multiplication and Division (MD) Fractions, Decimals, Ratio and Percentages (FDRP) Measures (MEA) Geometry (GEO) Statistics
Termly assessment Number and Place Value (NPV) Addition and Subtraction (AS) Multiplication and Division (MD) Fractions, Decimals, Ratio and Percentages (FDRP) Measures (MEA) Geometry (GEO) Statistics
Year 1 End of Year Maths Targets. Pupil Name AUT 2 SPR 2 SPR 1 AUT 1 SUM 1 SUM 2 TARGETS
 Year End of Year Maths Targets Pupil Name Number and place value I can count to and across 00, forward and backwards,beginning with 0 or from any number. I can count in multiples of, 5 and 0. I can count,
Polygons in the Coordinate Plane
 Polygons in the Coordinate Plane LAUNCH (8 MIN) Before How can you find the perimeter of the sandbox that the park worker made? During How will you determine whether the park worker s plan for the sandbox
EDINBURGH PRIMARY SCHOOL
 EDINBURGH PRIMARY SCHOOL TARGETS FOR THE NEW MATHEMATICS CURRICULUM Parent Information Edinburgh Primary School Assessment MATHEMATICS TARGETS - A YEAR 1 MATHEMATICIAN Number and place value I can count
Using a percent or a letter grade allows us a very easy way to analyze our performance. Not a big deal, just something we do regularly.
 GRAPHING We have used statistics all our lives, what we intend to do now is formalize that knowledge. Statistics can best be defined as a collection and analysis of numerical information. Often times we
Year 7 Unit 1 - number properties 1
 Year 7 Unit 1 - number properties 1 Order whole numbers using a number line. Place integers and decimals in order of size. Multiply and divide integers and decimals by 10,100, 1000 and explain the effect.
INSTRUCTIONS FOR THE USE OF THE SUPER RULE TM
 INSTRUCTIONS FOR THE USE OF THE SUPER RULE TM NOTE: All images in this booklet are scale drawings only of template shapes and scales. Preparation: Your SUPER RULE TM is a valuable acquisition for classroom
Maths PoS: Year 7 HT1. Students will colour code as they work through the scheme of work. Students will learn about Number and Shape
 Maths PoS: Year 7 HT1 Students will learn about Number and Shape Number: Use positive and negative numbers in context and position them on a number line. Recall quickly multiplication facts up to 10 10
Frequency Distributions
 Displaying Data Frequency Distributions After collecting data, the first task for a researcher is to organize and summarize the data so that it is possible to get a general overview of the results. Remember,
Diocese of Boise Math Curriculum 5 th grade
 Diocese of Boise Math Curriculum 5 th grade ESSENTIAL Sample Questions Below: What can affect the relationshi p between numbers? What does a decimal represent? How do we compare decimals? How do we round
AND NUMERICAL SUMMARIES. Chapter 2
 EXPLORING DATA WITH GRAPHS AND NUMERICAL SUMMARIES Chapter 2 2.1 What Are the Types of Data? 2.1 Objectives www.managementscientist.org 1. Know the definitions of a. Variable b. Categorical versus quantitative
Lecture Slides. Elementary Statistics Twelfth Edition. by Mario F. Triola. and the Triola Statistics Series. Section 2.1- #
 Lecture Slides Elementary Statistics Twelfth Edition and the Triola Statistics Series by Mario F. Triola Chapter 2 Summarizing and Graphing Data 2-1 Review and Preview 2-2 Frequency Distributions 2-3 Histograms
M3.1 Translate information between graphical, numerical and algebraic forms =
 Maths tutorial booklet for M3: Graphs Name: Target grade: Quiz scores: M3.1 Translate information between graphical, numerical and algebraic forms = M3.2 Plot two variables from experimental or other data
Section 4.1 Investigating Circles
 Section 4.1 Investigating Circles A circle is formed when all the points in a plane that are the same distance away from a center point. The distance from the center of the circle to any point on the edge
English 3 rd Grade M-Z Vocabulary Cards and Word Walls Revised: 1/13/14
 English 3 rd Grade M-Z Vocabulary Cards and Word Walls Revised: 1/13/14 Important Notes for Teachers: The vocabulary cards in this file match the Common Core, the math curriculum adopted by the Utah State
Sec 4.1 Coordinates and Scatter Plots. Coordinate Plane: Formed by two real number lines that intersect at a right angle.
 Algebra I Chapter 4 Notes Name Sec 4.1 Coordinates and Scatter Plots Coordinate Plane: Formed by two real number lines that intersect at a right angle. X-axis: The horizontal axis Y-axis: The vertical
Chapter 2 - Graphical Summaries of Data
 Chapter 2 - Graphical Summaries of Data Data recorded in the sequence in which they are collected and before they are processed or ranked are called raw data. Raw data is often difficult to make sense
UNIVERSITY OF CAMBRIDGE INTERNATIONAL EXAMINATIONS General Certificate of Education Ordinary Level MATHEMATICS (SYLLABUS D) 4024/02
 4024/02") UNIVERSITY OF CAMBRIDGE INTERNATIONAL EXAMINATIONS General Certificate of Education Ordinary Level MATHEMATICS (SYLLABUS D) 4024/02 Paper 2 Additional Materials: Answer Booklet/Paper Electronic calculator
UNIVERSITY OF CAMBRIDGE INTERNATIONAL EXAMINATIONS General Certificate of Education Ordinary Level MATHEMATICS (SYLLABUS D) 4024/02 Paper 2 Additional Materials: Answer Booklet/Paper Electronic calculator