Geographic Information Systems (GIS) Spatial Analyst [10] Dr. Mohammad N. Almasri. [10] Spring 2018 GIS Dr. Mohammad N. Almasri Spatial Analyst
|
|
|
- Milo Morton
- 5 years ago
- Views:
Transcription
1 Geographic Information Systems (GIS) Spatial Analyst [10] Dr. Mohammad N. Almasri 1 Preface POINTS, LINES, and POLYGONS are good at representing geographic objects with distinct shapes They are less good with geographic objects that are distributed continuously across a surface Think of temperature. You cannot go someplace where there is not one. It is cold in some spots and hot in others, but temperature itself is continuous So is elevation; so are land cover, noise levels, and chemical concentrations 2 1

2 Preface ArcGIS Spatial Analyst provides a way to represent and analyze geographic objects of this kind Instead of drawing them as shapes, it divides the surface on which they are distributed into a matrix of identically sized square cells This way of representation is called a raster Each cell is filled in with a number that stores the object s value at that location 3 Raster Data So to represent average daily temperature in degrees centigrade, the cells would hold numbers like 13, 20, 26, and so on The area bordered by the red box would be divided into many more cells than are shown here 4 2

3 Raster Data A raster is a spatial data method that defines space as an array of equally sized cells arranged in rows and columns, and composed of single or multiple bands 5 Raster Data Each cell contains an attribute value and location coordinates Raster coordinates are contained in the ordering of the matrix. Groups of cells that share the same value represent the same type of geographic feature 6 3

4 Raster and Vector Data Raster data are described by a cell grid, one value per cell Vector Raster Point Line Polygon 7 Conversion from Vectors Polygons 8 4
5 Definition of a Raster Number of rows Cell size Number of columns 9 Raster Data In a raster, surface is treated as continuous Each location is represented as a cell Cells can be organized into a matrix of rows and columns called a raster Each raster contains cells (pixels) with numeric values attached, and these represent some kind of geographic value The cells' numeric values can represent any kind of information about the geography an elevation measurement in meters 10 5

6 Raster Data 11 NODATA Cells When data values are not available for particular cells, the latter are described as NODATA cells NODATDA cells differ from cells containing a zero in that a zero value is considered to be data NODATA cells are represented as blank cells 12 6

7 NODATA Cells 13 Definition of a Raster Grid Cell size represents the minimum geographic unit size and defines spatial resolution of the grid Therefore, a high resolution grid contains a greater number of cells per geographic area than a grid of lower resolution 14 7


8 Resolution of Rasters This size for a raster cell depends on the data resolution required for your analysis: Small enough to capture details Large enough to store and perform analysis efficiently 15 Resolution of Rasters 16 8
9 Resolution of Rasters Coarser resolution means loss of data: Larger cells may encompass more than one data value Values that fall within cell get aggregated to one value Save storage space but compromises detail 17 Resolution of Rasters Finer resolution means more accurate information: Smaller cells represent well the reality Less aggregation is necessary Takes up more storage space Changing cells to half current size could require as much as four times the storage space 18 9
 Raster (1,000 m) Nablus Governorate 19 Referencing a Raster In raster")


10 Data Representation with a Vector and a Raster Vector (polygon) Raster (250 m) Raster (1,000 m) Nablus Governorate 19 Referencing a Raster In raster analysis, geographic units are regularly spaced, and the location of each unit is referenced by row and column position A raster consists of data elements referenced by row and column. The number of rows may or may not be equal to the number of columns Consequently, a raster may be a square or a rectangle 20 10
11 Referencing a Raster The column in a raster also increases to the right, yet the rows increase downward All cells in a raster have a positive position referenced, following the left-to-right and top-bottom data scan 21 Referencing a Raster Y X Rows Columns Note the difference in the referencing structure 22 11
12 Raster Types Every cell in a raster is an undividable unit and must be assigned a value Depending on the nature of the raster, the value assigned to a cell can be an integer or a floating Grid Types There are two types of grids: Integer grids (store cell values as integers) Have a value attribute table (VAT) It stores the codes and categories of the grid cells Floating grids (store values with decimal points) Have no theme attribute table 24 12
 Integer (may have associated attribute table) 25 The Raster Data Structure 100 (row = 2, column = 4) (X = 50, Y = 20)")
13 The Raster Data Structure Raster size (and cell size) is defined by the following: Number of rows and number of columns Top, left, bottom and right coordinates Raster values Real (floating decimal point) Integer (may have associated attribute table) 25 The Raster Data Structure 100 (row = 2, column = 4) (X = 50, Y = 20) 26 13
14 A raster dataset stores a two-dimensional matrix with values for each cell Raster Datasets The value associated with a cell defines the class, group, or measure at the cell position Cells of the same zone do not have to be geographically connected 27 Raster Datasets The VAT contains at least two fields, the value at each cell and the count (frequency of value occurrences) The code value occurs many times in the raster, but only once in the attribute table, which stores additional attributes for the code This design reduces storage and simplifies updating 28 14


15 Raster Datasets 29 Raster Datasets A single change to an attribute in the VAT table can be applied to several hundred or thousands of instances of that value 30 15
16 Types of Raster Data Each cell in a raster has one value. The cell values in a raster can represent one of the following four general types of data: Nominal data Ordinal data Interval data Ratio data 31 Types of Raster Data Nominal Data Agriculture Built up Commercial Industrial 32 16
17 Types of Raster Data Nominal Data A value of nominal data identifies one entity from another These values establish the group, class, member, or category with which the geographic entity at the position of the cell is associated These values are qualities, not quantities, with no relation to a fixed point or a linear scale and no relation to each other 33 Coding schemes for land use and soil types qualify as a nominal measurement Types of Raster Data Ordinal Data A value of ordinal data determines the rank of an entity versus other entities These measurements show position, such as first, second, or third But they do not establish magnitude or relative proportions. In other words, you cannot infer a quantitative difference, such as how much an entity is larger, higher, or denser than the others 34 17
18 Types of Raster Data Ordinal Data very good good moderate poor 35 Types of Raster Data Interval Data A value of interval data represents a measurement on a scale such as time and ph However, these values are not relative to a true zero point 36 18
19 Types of Raster Data Ratio Data A value of ratio data represents a measurement on a scale with a fixed and meaningful zero point such as rainfall, population, age, distance, weight, and volume You can make relative comparisons 37 Data Value Assignment The assignment of data values can follow different methods, each of which may result in a different grid definition The three most widely adopted methods are the centroid, predominant type, and most important type 38 19

20 Original map (vector) Data Value Assignment Centroid Method Assigned values (raster) The centroid method assigns the value to a cell according to the observed value at its geometric center Problems: the centroid may represent a minority such as the cell at the upper right corner 39 Data Value Assignment Predominant Type Method Original map (vector) Assigned values (raster) This method assigns cell value based on the largest area in the cell The predominant type method involves more complicated computation than the centroid method because the area of every type must be computed for every cell 40 20
21 Original map (vector) Data Value Assignment Most Important Type Method Assigned values (raster) In this method, the cell value depends on the occurrence of the most important surface type For instance, a public health agency may need to report the location of contagious disease cases regardless of numbers per cell 41 Data Value Assignment Method Comparison Predominant Type Method Most Important Type Method Centroid Method 21
22 Raster Operations Common operations in raster analysis consist of: Local functions that work on every single cell Focal functions that process the data of each cell based on the information of a specified neighborhood Zonal functions that provide operations that work on each group of cells of identical values 43 Global functions that work on a cell based on the data of the entire grid RasterOperations Local Functions Local functions process a raster on a cell-by-cell basis That is, each cell is processed based solely on its own value without reference to the values of other cells In other words, the output value is a function of the value of the cell being processed 44 22
23 Raster Operations Local Functions = Input raster Output raster Multiplier factor 45 Raster Operations Local Functions Input raster Output raster Multiplier raster 46 23
24 Raster Operations Local Functions Local functions are not limited to arithmetic computations In the next slide, the maximum value for each cell is to be identified from two grids 47 Raster Operations Local Functions MAX Input raster 1 Input raster Output raster 48 24

25 Raster Operations Focal Functions Focal functions process cell data depending on the values of neighboring cells For instance, computing the sum of a specified neighborhood and assigning the sum to the corresponding cell of the output grid is the focal sum function 49 Raster Operations Focal Functions 50 25

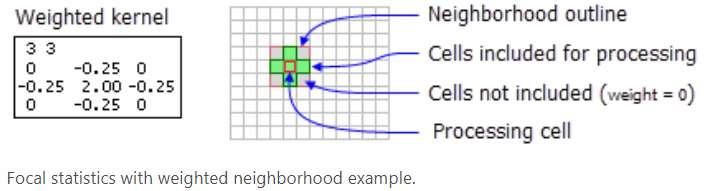
26 Raster Operations Focal Functions Rectangular Neighboring cells The rectangle neighborhood is specified by providing a width and a height in either cells or map units Only the cells whose centers fall within the defined object are processed as part of the rectangle neighborhood The default rectangle neighborhood is a square with a height and width of three cells 51 Rectangular Neighboring Raster Operations Focal Functions The x and y positions for the processing cell (the output) within the neighborhood, with respect to the upper left corner of the neighborhood, is determined by the following equation 52 26


27 Raster Operations Focal Functions Input raster Output raster: Focal sum Raster Operations Focal Functions Input raster Output raster: Focal sum
28 Raster Operations Focal Functions Input raster Output raster: Focal sum Raster Operations Focal Functions Input raster Output raster: Focal sum


29 Raster Operations Focal Functions Input raster Output raster: Focal sum Raster Operations Focal Functions Input raster Output raster: Focal mean Focal mean (3 3): this is the smoothing function to obtain the moving average in such a way that the value of each cell is changed into the average of the specified neighborhood 58 29
30 Raster Operations Focal Functions Neighboring cells can be one of the following: Rectangle Circle Annulus Wedge Irregular Weight 59 Raster Operations Annulus Neighborhood 60 30

31 Raster Operations Circle Neighborhood 61 Raster Operations Wedge Neighborhood A wedge is a pie-shaped neighborhood specified by a radius, a starting angle, and an ending angle 62 31

32 Raster Operations Irregular Neighborhood 63 Raster Operations Irregular Neighborhood 64 32
33 Raster Operations Focal Functions Other commonly employed focal functions include focal standard deviation, focal maximum, focal minimum, and focal range Focal flow function depends on the neighboring cells to specify the direction of flow The size and shape of the neighborhood can be defined using a prespecified method 65 Raster Operations Zonal Functions Zonal functions process the data of a grid in such a way that cells of the same zone are analyzed as a group A zone consists of a number of cells that may or may not be contiguous A typical zonal function requires two grids a zone grid which defines the size, shape, and location of each zone, and a value grid which is to be processed for analysis In the zone grid, cells of the same zone are coded with the same value, while different zones are assigned different zone values 66 33
34 Raster Operations Zonal Functions Zonal Max Zone raster Value raster Output raster 67 Raster Operations Global Functions For global functions, the output values of each cell is a function of the entire grid An example is the Euclidean distance function which computes the distance from each cell to the nearest source cell Source cells are defined in an input grid Distance is to be considered from the centers of cells 68 34
35 Raster Operations Global Functions Source raster Output raster 69 Raster Operations Global Functions Global functions based on the Euclidean distance measurement assume that the distance between every pair of adjacent cells is a constant In reality, the cost for traveling through two neighboring cells may be quite different from that for two other neighboring cells In other words, the travel cost may vary from place to place depending on surface characteristics or transportation accessibility Thus, the cost distance function is useful for adjusting the distance measurement by a cost grid 70 35
36 Grid Operations Global Functions Source raster Cost raster (cost to travel through a cell) Output raster 71 Geographic Information Systems (GIS) Spatial Analyst Raster Calculator Dr. Mohammad N. Almasri 72 36

37 The Raster Calculator The Raster Calculator provides a powerful tool for performing multiple tasks You can type in Map Algebra to perform mathematical calculations using operators and functions, set up selection queries, or type in Spatial Analyst function syntax 73 The Raster Calculator 74 37

 =")
38 The Raster Calculator Arithmetic operators Arithmetic operators allow the addition, subtraction, multiplication, and division of two rasters or numbers, or a combination of the two + = 75 The Raster Calculator Arithmetic operators = Precipitation - Losses (Evaporation, Infiltration) = Runoff 76 38
 in the cells of both input rasters Or: Finds where nonzero values are present in the")
39 Boolean operators use Boolean logic TRUE or FALSE on input rasters on a cell-by-cell basis Output values of TRUE are written as 1 and FALSE as 0 Boolean operators: And, Or, Xor, Not The Raster Calculator Boolean Operators 77 The Raster Calculator Boolean Operators And: Finds where values are true (nonzero) in the cells of both input rasters Or: Finds where nonzero values are present in the cells of one or both input rasters Xor: Finds where nonzero values are present in the cells of one input raster or another input raster, but not both Not: Finds where nonzero values are not present in the cells of a single input raster (where zero values are present) 78 39
 80")
40 The Raster Calculator Boolean operators And (&) 79 The Raster Calculator Boolean operators Or (l) 80 40
 Finds where nonzero values are present in the cells of")
 Finds where zero")
41 The Raster Calculator Boolean operators Xor (!, ^) Finds where nonzero values are present in the cells of any raster but not both rasters at the same time 81 The Raster Calculator Boolean operators Not (~) Finds where zero values are present 82 41

42 The Raster Calculator Relational operators Relational operators evaluate specific relational conditions If a condition is TRUE, the output is assigned 1 If a condition is FALSE, the output is assigned 0 Relational operators: ==, >, <, <>, >=, <= 83 The Raster Calculator Relational operators 84 42


43 A logical query on two overlaid grids (A and B) In grid A, check for cells with values less than or equal to 2 In grid B, check for cells with values equal to 3 Spatially corresponding cells that meet both conditions are assigned the value 1. All other cells are assigned 0 The results of the query are stored in grid C The Raster Calculator Relational operators 85 The Raster Calculator Relational operators 86 43


44 The Raster Calculator Relational operators 87 The Raster Calculator Mathematical Functions Mathematical functions are applied on the values of a single layer 88 44
 Spatial Analyst Distance Dr. Mohammad N.")
45 The Raster Calculator Mathematical Functions 89 Geographic Information Systems (GIS) Spatial Analyst Distance Dr. Mohammad N. Almasri 90 45
46 Distance What are distance mapping functions? The distance mapping functions are global functions. They compute all output raster dataset where the output value at each location is potentially a function of all the cells in the input raster datasets There are several distance mapping tools for measuring both straight line distance and distance measured in terms of other factors, such as the cost to travel over the landscape 91 Distance Why It is Useful to Map Distance? By mapping distance you can find out information such as the distance to the nearest hospital from certain areas, or find all fire hydrants within 500 meters from a burning building Alternatively, you could find the shortest or least-cost path from one location to another based on some cost factor 92 46
47 Distance The source The source identifies the location of the objects of interest such as wells, stations and so on If the source is a raster, it must contain only the values of the source cells while all other cells must be NoData If the source is a feature, it will internally be transformed into a grid when you run the function 93 Distance Straight Line Distance Functions The Straight Line Distance function measures the straight line distance from each cell lo the closest source The distance is measured from cell center to cell center The Straight Line Allocation function assigns each cell the value of the source to which it is closest The nearest source is determined by the Straight Line Distance The Straight Line Direction function computes the direction of each cell to the closest source, measured in degrees Example of usage: What is the direction to the closest town? 94 47


48 Distance Straight Line Distance Functions Keep in mind that the Straight Line Distance functions give you information according to Euclidean, or straight line distance 95 Distance Straight Line Distance Function We need to find out the raster of the distance to the closest source locations 100-m cell size grid 96 48


49 Distance Straight Line Distance Functions 97 Distance Straight Line Distance Functions Cell size = 1 m 98 49


50 Distance Straight Line Allocation raster dataset Each cell value denotes the source ID for which the cell itself is the closest to 99 Distance Straight Line Allocation raster dataset

51 Distance Straight Line Direction raster dataset The Straight Line Direction raster contains the direction from each cell to the nearest source Thus, you start from a cell, follow the direction to get to the next cell and so on 101 Distance Source Distribution

52 Distance Straight Line Distance Functions 103 Distance Straight Line Allocation raster dataset

53 Distance Straight Line Direction raster dataset 105 Distance Cost Weighted Distance Functions What is the cost weighted distance mapping? Cost weighted distance mapping finds the least accumulative cost from each cell to the nearest cheapest source. Cost can be money, time, or preference The functions that perform cost weighted distance mapping compute the accumulative cost of traveling from each cell to the nearest source, based on the cell s distance from each source and the cost to travel through it

54 Distance Cost Weighted Distance Functions Why use the cost weighted distance function? Cost weighted distance modeling is useful whenever movement is based on geographic factors, such as animal migration studies or consumer travel behavior Cost weighted distance may also be used to minimize construction costs for routing new roads or pipelines 107 Distance Cost Weighted Distance Functions The straight line distance between two points is not necessarily the best. In the figure, the shortest path over the mountain takes three hours. The longer path around takes two hours If time was a cost, then the route with the longer distance should be taken It may take longer to travel over the mountain due to steep slopes, so steep slopes should be given a higher cost However, the aim may be to climb over the mountain. Applying cost weighted distance enables you to specify preferences in your input data


55 Distance Cost Weighted Distance Functions Allocation 109 Distance Cost Weighted Distance Functions Cost


56 Distance Cost Weighted Distance Functions Cumulative 111 Distance Cost Weighted Distance Functions Direction
57 Geographic Information Systems (GIS) Spatial Analyst Interpolation Dr. Mohammad N. Almasri 113 Interpolation Why interpolate to raster? Visiting every location in a study area to measure the topographic elevation or rainfall depth is indeed difficult, time consuming and expensive Instead, dispersed sample input point locations can be selected and a predicted value can be assigned to all other locations The assumption that makes interpolation a viable option is that spatially distributed objects are spatially correlated
58 Interpolation For instance, if it is raining on one side of the street, you can predict with a high level of confidence that it is also raining on the other side of the street You would be less sure if it was raining across town and less confident still about the state of the weather in the neighboring town Using this analogy, it is easy to see that the values of points close to sampled points are more likely to be similar to those that are further apart This is the basis of interpolation 115 Interpolation Methods The interpolation method that will be considered in this presentation is the Inverse Distance Weighted (IDW) It makes certain assumptions about how to determine the best estimated values No matter which method is selected, however, the more input points and the greater their distribution, the more reliable the results will be
59 Inverse Distance Weighted Method (IDW) IDW estimates cell values by averaging the values of sample data points in the vicinity of each cell The closer a sampled point is to the center of the cell being estimated, the more influence or weight it has in the averaging process That is, IDW method assumes that each interpolation point has a local influence that diminishes with distance 117 Inverse Distance Weighted Method (IDW) Search Radius The interpolated point is controlled by applying a search radius This radius limits the number of input points that can be used for calculating the value at each interpolated cell The weighting function is the following: w(d)= 1/d p where d is the distance and p is the power A higher power results in less influence from distant points 118 i 1 n i 1 Z n Z i w w i i 59

60 Inverse Distance Method (IDW) Power By defining a high power, more emphasis is placed on the nearest points By defining a lower power, more influence is placed on the points that are further away With increasing the power, the decrease in weight per change in power will be higher in remote points than in the close ones A power of 2 is most commonly used and is the default 119 Inverse Distance Method (IDW) Fixed Search Radius
61 Inverse Distance Method (IDW) Fixed Search Radius A fixed search radius requires a distance and a minimum number of points The radius is used to determine the sampling points The minimum number of points indicates the minimum number to use within the neighborhood All the measured points that fall within the radius will be used in the calculation of each interpolated cell When there are fewer sampled points than the specified minimum number of points, the search radius will increase until it can encompass the minimum number of points 121 Inverse Distance Method (IDW) Variable Search Radius
62 Inverse Distance Method (IDW) Variable Search Radius With a variable search radius, the number of points used in calculating the value of the interpolated cell is specified, which makes the radius vary for each interpolated cell, depending on how far it has to search around each interpolated cell to reach the specified number of input points You can also specify a maximum distance, in map units, that the search radius cannot exceed If the radius for a particular neighborhood reaches the maximum distance before obtaining the specified number of points, the prediction for that location will be performed on the number of measured points within the maximum distance 123 Inverse Distance Method (IDW) Barrier A barrier is a polyline dataset used as a break that limits the search for input sample points A polyline can represent an interruption in a landscape such as a cliff Only those input sample points on the same side of the barrier as the current processing cell will be considered

63 Inverse Distance Method (IDW) Fixed versus Variable Search Radius Fixed radius Specify the radius Specify the minimum number of points ArcMap uses all the points within the search radius if the number equals or more the minimum specified Otherwise, the search radius will be extended until getting all the minimum points 125 Variable radius Specify the number of points ArcMap varies the radius until encompassing all the points If you specify a maximum radius then ArcMap will consider only these within the radius area Inverse Distance Method (IDW)
 Power=2 Power=5")
")

64 Inverse Distance Method (IDW) Power=2 Power=5 Power= Geographic Information Systems (GIS) Spatial Analyst Contours Dr. Mohammad N. Almasri
65 Contours Contours are polylines that connect points of equal value such as elevation, temperature, precipitation, or pollution The distribution of the polylines shows how values change across a surface Where there is a little change in a value, the polylines are spread farther apart. Where the values rise or fall rapidly, the polylines are closer together 129 Contours Why Create Contours? By following the polyline of a specific contour, you can identify which locations have the same value Contours are also a useful surface representation because they allow you to simultaneously visualize flat and steep areas With contours you can identify the level of variability in the data with space


66 Contours A Hypothetical Temperature Surface The following points represent measurements of temperature through out a specific area Create the contour map of the temperature for the area 131 Contours A Hypothetical Temperature Surface IDW
67 Geographic Information Systems (GIS) Spatial Analyst Cell Statistics Dr. Mohammad N. Almasri 133 Majority
68 Majority Majority uses multiple input rasters to determine the majority value (the value that appears most often) on a cell-by-cell basis within the Analysis window The order of input is irrelevant in the Majority expression When there is more than one majority value for a cell location, the output for that location is NoData A reasonable expression should consist of at least three input rasters; however, the command will work on a single input raster (creating a copy of that raster) 135 Majority If only two rasters are used as input, any location where the values on the rasters are different will be written as NoData Since there are only two different values from which to choose, there is no majority value If a cell location contains NoData on any of the input rasters, that location will be assigned NoData on the output
69 Minority Uses multiple input rasters to determine the minority value (the value that appears least often) on a cell-by-cell basis within the Analysis window 137 Maximum Uses multiple input rasters to determine the maximum value on a cellby-cell basis within the Analysis window

70 Minimum Uses multiple input rasters to determine the minimum value on a cell-by-cell basis within the Analysis window 139 Mean Uses multiple input rasters to determine the mean value on a cell-by-cell basis within the Analysis window
71 Median Uses multiple input rasters to determine the median value on a cell-by-cell basis If the number of inputs is odd, the median value is calculated by ranking the values and selecting the middle value If the number of inputs is even, the values will be ranked and the middle two values will be averaged. This value will be truncated to an integer if all the input rasters are of integer type 141 Sum Outputs the sum of all input values on a cellby-cell basis within the Analysis window
72 Variety Uses multiple input rasters to determine the variety of the values (the number of unique values) on a cell-by-cell basis within the Analysis window 143 Lowest Position Determines the position of a raster with the minimum value in a set of rasters The order of inputs is relevant for the Lowest Position tool


73 Highest Position Determines, on a cell-by-cell basis within the Analysis window, the position of the input raster with the maximum value in the argument list 145 Less Than 73
![Geographic Information Systems (GIS) Spatial Analyst Slope, Aspect, and Viewshed [10-9] Dr. Mohammad N.](/docs-images/80/81171101/images/74-1.jpg "Almasri 147 Digital Elevation Models DEM DEM (Digital Elevation Model) is an array (in raster format) representing the ground surface topography (elevation) DEM is generally used by")
74 Geographic Information Systems (GIS) Spatial Analyst Slope, Aspect, and Viewshed [10-9] Dr. Mohammad N. Almasri 147 Digital Elevation Models DEM DEM (Digital Elevation Model) is an array (in raster format) representing the ground surface topography (elevation) DEM is generally used by the Spatial Analyst to perform many tasks among them the viewshed analysis
75 Surface Analysis Slope The Slope function calculates the maximum rate of change between each cell and its neighbors a b c d e f g h i dz dx dz dy (a 2d g) - (c 2f i) 8* x_mesh_spacing (g 2h i) - (a 2b c) 8* y_mesh_spacing rise run dz dx 2 dz dy rise deg atan run Surface Analysis Hydrologic Slope Steepest Descent Slope =

76 Surface Analysis Aspect Aspect is the direction of slope The value of each cell in an aspect dataset indicates the direction the cell's slope faces 151 Aspect Why Using Aspect? Find all north-facing slopes on a mountain as part of a search for the best slopes for ski runs Calculate the solar illumination for each location in a region as part of a study to determine the diversity of life at each site Find all southerly slopes in a mountainous region to identify locations where the snow is likely to melt first as part of a study to identify those residential locations likely to be hit by runoff first
 - (a 2b c) 8* y_mesh_spacing (60 2 *52 48) (80 2*74 63) 2 2 Slope 0.229 0.329 8*30 0.401 0.329 o atan(0.401) 21.8 0.229 o o Aspect atan 34.8 180 0.329 o 145.")
77 a b c d e f g h i o Surface Analysis Aspect dz dx dz dy (a 2d g) - (c 2f i) 8* x_mesh_spacing (80 2 *69 60) (63 2 *56 24) 8* (g 2h i) - (a 2b c) 8* y_mesh_spacing (60 2 *52 48) (80 2*74 63) 2 2 Slope * o atan(0.401) o o Aspect atan o Surface Analysis Aspect
78 Viewshed Viewshed analysis uses the elevation value of each cell of the DEM to determine visibility to or from a particular cell Viewsheds can be calculated using an individual point or multiple points For example, when locating a landfill, the analysis can determine from where the landfill is visible to keep it hidden from view 155 Viewshed Viewshed identifies the cells in an input raster that can be seen from one or more observation points or lines If you have only one observer point, each cell that can see that observer point is given a value of 1 All cells that cannot see the observer point are given a value of
Mapping Distance and Density
 Mapping Distance and Density Distance functions allow you to determine the nearest location of something or the least-cost path to a particular destination. Density functions, on the other hand, allow
Cell based GIS. Introduction to rasters
 Week 9 Cell based GIS Introduction to rasters topics of the week Spatial Problems Modeling Raster basics Application functions Analysis environment, the mask Application functions Spatial Analyst in ArcGIS
Lecture 9. Raster Data Analysis. Tomislav Sapic GIS Technologist Faculty of Natural Resources Management Lakehead University
 Lecture 9 Raster Data Analysis Tomislav Sapic GIS Technologist Faculty of Natural Resources Management Lakehead University Raster Data Model The GIS raster data model represents datasets in which square
Raster Data. James Frew ESM 263 Winter
 Raster Data 1 Vector Data Review discrete objects geometry = points by themselves connected lines closed polygons attributes linked to feature ID explicit location every point has coordinates 2 Fields
Raster Analysis and Functions. David Tenenbaum EEOS 465 / 627 UMass Boston
 Raster Analysis and Functions Local Functions By-cell operations Operated on by individual operators or by coregistered grid cells from other themes Begin with each target cell, manipulate through available
Module 7 Raster operations
 Introduction Geo-Information Science Practical Manual Module 7 Raster operations 7. INTRODUCTION 7-1 LOCAL OPERATIONS 7-2 Mathematical functions and operators 7-5 Raster overlay 7-7 FOCAL OPERATIONS 7-8
Lecture 6: GIS Spatial Analysis. GE 118: INTRODUCTION TO GIS Engr. Meriam M. Santillan Caraga State University
 Lecture 6: GIS Spatial Analysis GE 118: INTRODUCTION TO GIS Engr. Meriam M. Santillan Caraga State University 1 Spatial Data It can be most simply defined as information that describes the distribution
Neighbourhood Operations Specific Theory
 Neighbourhood Operations Specific Theory Neighbourhood operations are a method of analysing data in a GIS environment. They are especially important when a situation requires the analysis of relationships
+ = Spatial Analysis of Raster Data. 2 =Fault in shale 3 = Fault in limestone 4 = no Fault, shale 5 = no Fault, limestone. 2 = fault 4 = no fault
 Spatial Analysis of Raster Data 0 0 1 1 0 0 1 1 1 0 1 1 1 1 1 1 2 4 4 4 2 4 5 5 4 2 4 4 4 2 5 5 4 4 2 4 5 4 3 5 4 4 4 2 5 5 5 3 + = 0 = shale 1 = limestone 2 = fault 4 = no fault 2 =Fault in shale 3 =
Spatial Analysis (Vector) II
 II") Spatial Analysis (Vector) II GEOG 300, Lecture 9 Dr. Anthony Jjumba 1 A Spatial Network is a set of geographic locations interconnected in a system by a number of routes is a system of linear features
Spatial Analysis (Vector) II GEOG 300, Lecture 9 Dr. Anthony Jjumba 1 A Spatial Network is a set of geographic locations interconnected in a system by a number of routes is a system of linear features
Understanding Geospatial Data Models
 Understanding Geospatial Data Models 1 A geospatial data model is a formal means of representing spatially referenced information. It is a simplified view of physical entities and a conceptualization of
Lab 12: Sampling and Interpolation
 Lab 12: Sampling and Interpolation What You ll Learn: -Systematic and random sampling -Majority filtering -Stratified sampling -A few basic interpolation methods Videos that show how to copy/paste data
Map Analysis of Raster Data I 3/8/2018
 Map Analysis of Raster Data I /8/8 Spatial Analysis of Raster Data What is Spatial Analysis? = shale = limestone 4 4 4 4 5 5 4 4 4 4 5 5 4 4 4 5 4 5 4 4 4 5 5 5 + = = fault =Fault in shale 4 = no fault
Getting Started with Spatial Analyst. Steve Kopp Elizabeth Graham
 Getting Started with Spatial Analyst Steve Kopp Elizabeth Graham Spatial Analyst Overview Over 100 geoprocessing tools plus raster functions Raster and vector analysis Construct workflows with ModelBuilder,
Surface Analysis. Data for Surface Analysis. What are Surfaces 4/22/2010
 Surface Analysis Cornell University Data for Surface Analysis Vector Triangulated Irregular Networks (TIN) a surface layer where space is partitioned into a set of non-overlapping triangles Attribute and
Raster Data Model & Analysis
 Topics: 1. Understanding Raster Data 2. Adding and displaying raster data in ArcMap 3. Converting between floating-point raster and integer raster 4. Converting Vector data to Raster 5. Querying Raster
Geol 588. GIS for Geoscientists II. Zonal functions. Feb 22, Zonal statistics. Interpolation. Zonal statistics Sp. Analyst Tools - Zonal.
 Zonal functions Geol 588 GIS for Geoscientists II Feb 22, 2011 Zonal statistics Interpolation Zonal statistics Sp. Analyst Tools - Zonal Choose correct attribute for zones (usually: must be unique ID for
Creating Surfaces. Steve Kopp Steve Lynch
 Steve Kopp Steve Lynch Overview Learn the types of surfaces and the data structures used to store them Emphasis on surface interpolation Learn the interpolation workflow Understand how interpolators work
L7 Raster Algorithms
 L7 Raster Algorithms NGEN6(TEK23) Algorithms in Geographical Information Systems by: Abdulghani Hasan, updated Nov 216 by Per-Ola Olsson Background Store and analyze the geographic information: Raster
Getting Started with Spatial Analyst. Steve Kopp Elizabeth Graham
 Getting Started with Spatial Analyst Steve Kopp Elizabeth Graham Workshop Overview Fundamentals of using Spatial Analyst What analysis capabilities exist and where to find them How to build a simple site
RASTER ANALYSIS GIS Analysis Fall 2013
 RASTER ANALYSIS GIS Analysis Fall 2013 Raster Data The Basics Raster Data Format Matrix of cells (pixels) organized into rows and columns (grid); each cell contains a value representing information. What
Raster GIS applications
 Raster GIS applications Columns Rows Image: cell value = amount of reflection from surface DEM: cell value = elevation (also slope/aspect/hillshade/curvature) Thematic layer: cell value = category or measured
GEOGRAPHIC INFORMATION SYSTEMS Lecture 18: Spatial Modeling
 Spatial Analysis in GIS (cont d) GEOGRAPHIC INFORMATION SYSTEMS Lecture 18: Spatial Modeling - the basic types of analysis that can be accomplished with a GIS are outlined in The Esri Guide to GIS Analysis
Lesson 5 overview. Concepts. Interpolators. Assessing accuracy Exercise 5
 Interpolation Tools Lesson 5 overview Concepts Sampling methods Creating continuous surfaces Interpolation Density surfaces in GIS Interpolators IDW, Spline,Trend, Kriging,Natural neighbors TopoToRaster
RASTER ANALYSIS GIS Analysis Winter 2016
 RASTER ANALYSIS GIS Analysis Winter 2016 Raster Data The Basics Raster Data Format Matrix of cells (pixels) organized into rows and columns (grid); each cell contains a value representing information.
Purpose: To explore the raster grid and vector map element concepts in GIS.
 GIS INTRODUCTION TO RASTER GRIDS AND VECTOR MAP ELEMENTS c:wou:nssi:vecrasex.wpd Purpose: To explore the raster grid and vector map element concepts in GIS. PART A. RASTER GRID NETWORKS Task A- Examine
Spatial Analysis with Raster Datasets
 Spatial Analysis with Raster Datasets Francisco Olivera, Ph.D., P.E. Srikanth Koka Lauren Walker Aishwarya Vijaykumar Keri Clary Department of Civil Engineering April 21, 2014 Contents Brief Overview of
Working with Map Algebra
 Working with Map Algebra While you can accomplish much with the Spatial Analyst user interface, you can do even more with Map Algebra, the analysis language of Spatial Analyst. Map Algebra expressions
How does Map Algebra work?
 Map Algebra How does Map Algebra work? Map Algebra uses math-like expressions containing operators and functions with raster data. Map Algebra operators, which are relational, Boolean, logical, combinatorial,
GEOGRAPHIC INFORMATION SYSTEMS Lecture 24: Spatial Analyst Continued
 GEOGRAPHIC INFORMATION SYSTEMS Lecture 24: Spatial Analyst Continued Spatial Analyst - Spatial Analyst is an ArcGIS extension designed to work with raster data - in lecture I went through a series of demonstrations
ENGRG Introduction to GIS
 ENGRG 59910 Introduction to GIS Michael Piasecki April 3, 2014 Lecture 11: Raster Analysis GIS Related? 4/3/2014 ENGRG 59910 Intro to GIS 2 1 Why we use Raster GIS In our previous discussion of data models,
Watershed Sciences 4930 & 6920 GEOGRAPHIC INFORMATION SYSTEMS
 HOUSEKEEPING Watershed Sciences 4930 & 6920 GEOGRAPHIC INFORMATION SYSTEMS CONTOURS! Self-Paced Lab Due Friday! WEEK SIX Lecture RASTER ANALYSES Joe Wheaton YOUR EXCERCISE Integer Elevations Rounded up
GIS Tools - Geometry. A GIS stores data as different layers of information Different feature types are stored in individual files.
 A Definition of GIS GIS is a system of hardware, software, and procedures designed to support the capture, management, manipulation, analysis, modeling and display of spatially referenced data for solving
Surface Creation & Analysis with 3D Analyst
 Esri International User Conference July 23 27 San Diego Convention Center Surface Creation & Analysis with 3D Analyst Khalid Duri Surface Basics Defining the surface Representation of any continuous measurement
Copyright The McGraw-Hill Companies, Inc. Permission required for reproduction or display.
 CHAPTER 12 RASTER DATA ANALYSIS 12.1 Data Analysis Environment Box 12.1 How to Make an Analysis Mask 12.2 Local Operations 12.2.1 Local Operations with a Single Raster 12.2.2 Reclassification 12.2.3 Local
RASTER ANALYSIS S H A W N L. P E N M A N E A R T H D A T A A N A LY S I S C E N T E R U N I V E R S I T Y O F N E W M E X I C O
 RASTER ANALYSIS S H A W N L. P E N M A N E A R T H D A T A A N A LY S I S C E N T E R U N I V E R S I T Y O F N E W M E X I C O TOPICS COVERED Spatial Analyst basics Raster / Vector conversion Raster data
Lab 12: Sampling and Interpolation
 Lab 12: Sampling and Interpolation What You ll Learn: -Systematic and random sampling -Majority filtering -Stratified sampling -A few basic interpolation methods Data for the exercise are in the L12 subdirectory.
Raster GIS applications Columns
 Raster GIS applications Columns Rows Image: cell value = amount of reflection from surface Thematic layer: cell value = category or measured value - In both cases, there is only one value per cell (in
Review of Cartographic Data Types and Data Models
 Review of Cartographic Data Types and Data Models GIS Data Models Raster Versus Vector in GIS Analysis Fundamental element used to represent spatial features: Raster: pixel or grid cell. Vector: x,y coordinate
Raster Data. James Frew ESM 263 Winter
 Raster Data 1 Vector Data Review discrete objects geometry = points by themselves connected lines closed polygons agributes linked to feature ID explicit localon every point has coordinates 2 Fields in
Class #2. Data Models: maps as models of reality, geographical and attribute measurement & vector and raster (and other) data structures
 data structures") Class #2 Data Models: maps as models of reality, geographical and attribute measurement & vector and raster (and other) data structures Role of a Data Model Levels of Data Model Abstraction GIS as Digital
Class #2 Data Models: maps as models of reality, geographical and attribute measurement & vector and raster (and other) data structures Role of a Data Model Levels of Data Model Abstraction GIS as Digital
Dijkstra's Algorithm
 Shortest Path Algorithm Dijkstra's Algorithm To find the shortest path from the origin node to the destination node No matrix calculation Floyd s Algorithm To find all the shortest paths from the nodes
Raster Analysis. Overview Neighborhood Analysis Overlay Cost Surfaces. Arthur J. Lembo, Jr. Salisbury University
 Raster Analysis Overview Neighborhood Analysis Overlay Cost Surfaces Exam results Mean: 74% STDEV: 15% High: 92 Breakdown: A: 1 B: 2 C: 2 D: 1 F: 2 We will review the exam next Tuesday. Start thinking
Esri International User Conference. San Diego, California. Technical Workshops. July Creating Surfaces. Steve Kopp and Steve Lynch
 Esri International User Conference San Diego, California Technical Workshops July 2011 Creating Surfaces Steve Kopp and Steve Lynch Overview Learn the types of surfaces and the data structures used to
The Raster Data Model
 The Raster Data Model 2 2 2 2 8 8 2 2 8 8 2 2 2 2 2 2 8 8 2 2 2 2 2 2 2 2 2 Llano River, Mason Co., TX 1 Rasters are: Regular square tessellations Matrices of values distributed among equal-sized, square
GEOGRAPHIC INFORMATION SYSTEMS Lecture 25: 3D Analyst
 GEOGRAPHIC INFORMATION SYSTEMS Lecture 25: 3D Analyst 3D Analyst - 3D Analyst is an ArcGIS extension designed to work with TIN data (triangulated irregular network) - many of the tools in 3D Analyst also
Raster Data Models 9/18/2018
 Raster Data Models The Raster Data Model Rasters are: Regular square tessellations Matrices of values distributed among equal-sized, square cells 5 5 5 5 5 5 5 5 2 2 5 5 5 5 5 5 2 2 2 2 5 5 5 5 5 2 2 2
Contents of Lecture. Surface (Terrain) Data Models. Terrain Surface Representation. Sampling in Surface Model DEM
 Data Models. Terrain Surface Representation. Sampling in Surface Model DEM") Lecture 13: Advanced Data Models: Terrain mapping and Analysis Contents of Lecture Surface Data Models DEM GRID Model TIN Model Visibility Analysis Geography 373 Spring, 2006 Changjoo Kim 11/29/2006 1
Lecture 13: Advanced Data Models: Terrain mapping and Analysis Contents of Lecture Surface Data Models DEM GRID Model TIN Model Visibility Analysis Geography 373 Spring, 2006 Changjoo Kim 11/29/2006 1
Raster Analysis. Overview Neighborhood Analysis Overlay Cost Surfaces. Arthur J. Lembo, Jr. Salisbury University
 Raster Analysis Overview Neighborhood Analysis Overlay Cost Surfaces Why we use Raster GIS In our previous discussion of data models, we indicated that Raster GIS is often used because: Raster is better
Rasters are: The Raster Data Model. Cell location specified by: Why squares? Raster Data Models 9/25/2014. GEO327G/386G, UT Austin 1
 5 5 5 5 5 5 5 5 5 5 5 5 2 2 5 5 2 2 2 2 2 2 8 8 2 2 5 5 5 5 5 5 2 2 2 2 5 5 5 5 5 2 2 2 5 5 5 5 The Raster Data Model Rasters are: Regular square tessellations Matrices of values distributed among equalsized,
The Raster Data Model
 The Raster Data Model 2 2 2 2 8 8 2 2 8 8 2 2 2 2 2 2 8 8 2 2 2 2 2 2 2 2 2 Llano River, Mason Co., TX 9/24/201 GEO327G/386G, UT Austin 1 Rasters are: Regular square tessellations Matrices of values distributed
Curriculum at a Glance Kindergarten- Grade 5
 Curriculum at a Glance Kindergarten- Grade 5 Students learn to reason and communicate, be problem-solvers, value mathematics and feel confident in their ability to apply concepts and skills. Creating such
Representing Geography
 Data models and axioms Chapters 3 and 7 Representing Geography Road map Representing the real world Conceptual models: objects vs fields Implementation models: vector vs raster Vector topological model
Vector Data Analysis Working with Topographic Data. Vector data analysis working with topographic data.
 Vector Data Analysis Working with Topographic Data Vector data analysis working with topographic data. 1 Triangulated Irregular Network Triangulated Irregular Network 2 Triangulated Irregular Networks
GIS: Raster Analysis
 GIS: Raster Analysis Ts (K) High : 311 Low : 299 500 Meters Albedo G / Rn High : 0.35 High : 0.50 Low : 0.03 Low : 0.10 1 Raster analysis: Outline Raster analysis applications Map algebra Local functions
Geographic Surfaces. David Tenenbaum EEOS 383 UMass Boston
 Geographic Surfaces Up to this point, we have talked about spatial data models that operate in two dimensions How about the rd dimension? Surface the continuous variation in space of a third dimension
Surface Analysis with 3D Analyst
 2013 Esri International User Conference July 8 12, 2013 San Diego, California Technical Workshop Surface Analysis with 3D Analyst Khalid H. Duri Esri UC2013. Technical Workshop. Why use 3D GIS? Because
PART 1. Answers module 6: 'Transformations'
 Answers module 6: 'Transformations' PART 1 1 a A nominal measure scale refers to data that are in named categories. There is no order among these categories. That is, no category is better or more than
GIS IN ECOLOGY: MORE RASTER ANALYSES
 GIS IN ECOLOGY: MORE RASTER ANALYSES Contents Introduction... 2 More Raster Application Functions... 2 Data Sources... 3 Tasks... 4 Raster Recap... 4 Viewshed Determining Visibility... 5 Hydrology Modeling
Big Mathematical Ideas and Understandings
 Big Mathematical Ideas and Understandings A Big Idea is a statement of an idea that is central to the learning of mathematics, one that links numerous mathematical understandings into a coherent whole.
Learn the various 3D interpolation methods available in GMS
 v. 10.4 GMS 10.4 Tutorial Learn the various 3D interpolation methods available in GMS Objectives Explore the various 3D interpolation algorithms available in GMS, including IDW and kriging. Visualize the
Stream network delineation and scaling issues with high resolution data
 Stream network delineation and scaling issues with high resolution data Roman DiBiase, Arizona State University, May 1, 2008 Abstract: In this tutorial, we will go through the process of extracting a stream
Data can be in the form of numbers, words, measurements, observations or even just descriptions of things.
 + What is Data? Data is a collection of facts. Data can be in the form of numbers, words, measurements, observations or even just descriptions of things. In most cases, data needs to be interpreted and
Suitability Modeling with GIS
 Developed and Presented by Juniper GIS 1/33 Course Objectives What is Suitability Modeling? The Suitability Modeling Process Cartographic Modeling GIS Tools for Suitability Modeling Demonstrations of Models
Soil texture: based on percentage of sand in the soil, partially determines the rate of percolation of water into the groundwater.
 Overview: In this week's lab you will identify areas within Webster Township that are most vulnerable to surface and groundwater contamination by conducting a risk analysis with raster data. You will create
GEOGRAPHIC INFORMATION SYSTEMS Lecture 02: Feature Types and Data Models
 GEOGRAPHIC INFORMATION SYSTEMS Lecture 02: Feature Types and Data Models Feature Types and Data Models How Does a GIS Work? - a GIS operates on the premise that all of the features in the real world can
Digital Elevation Model & Surface Analysis
 Topics: Digital Elevation Model & Surface Analysis 1. Introduction 2. Create raster DEM 3. Examine Lidar DEM 4. Deriving secondary surface products 5. Mapping contours 6. Viewshed Analysis 7. Extract elevation
Geostatistics 3D GMS 7.0 TUTORIALS. 1 Introduction. 1.1 Contents
 GMS 7.0 TUTORIALS Geostatistics 3D 1 Introduction Three-dimensional geostatistics (interpolation) can be performed in GMS using the 3D Scatter Point module. The module is used to interpolate from sets
3. Data Structures for Image Analysis L AK S H M O U. E D U
 3. Data Structures for Image Analysis L AK S H M AN @ O U. E D U Different formulations Can be advantageous to treat a spatial grid as a: Levelset Matrix Markov chain Topographic map Relational structure
TIPS4Math Grades 4 to 6 Overview Grade 4 Grade 5 Grade 6 Collect, Organize, and Display Primary Data (4+ days)
") Collect, Organize, and Display Primary Data (4+ days) Collect, Organize, Display and Interpret Categorical Data (5+ days) 4m88 Collect data by conducting a survey or an experiment to do with the 4m89 Collect
Collect, Organize, and Display Primary Data (4+ days) Collect, Organize, Display and Interpret Categorical Data (5+ days) 4m88 Collect data by conducting a survey or an experiment to do with the 4m89 Collect
WHOLE NUMBER AND DECIMAL OPERATIONS
 WHOLE NUMBER AND DECIMAL OPERATIONS Whole Number Place Value : 5,854,902 = Ten thousands thousands millions Hundred thousands Ten thousands Adding & Subtracting Decimals : Line up the decimals vertically.
LECTURE 2 SPATIAL DATA MODELS
 LECTURE 2 SPATIAL DATA MODELS Computers and GIS cannot directly be applied to the real world: a data gathering step comes first. Digital computers operate in numbers and characters held internally as binary
Longley Chapter 3. Representations
 Longley Chapter 3 Digital Geographic Data Representation Geographic Data Type Data Models Representing Spatial and Temporal Data Attributes The Nature of Geographic Data Representations Are needed to convey
APS Sixth Grade Math District Benchmark Assessment NM Math Standards Alignment
 SIXTH GRADE NM STANDARDS Strand: NUMBER AND OPERATIONS Standard: Students will understand numerical concepts and mathematical operations. 5-8 Benchmark N.: Understand numbers, ways of representing numbers,
Thoughts on Representing Spatial Objects. William A. Huber Quantitative Decisions Rosemont, PA
 Thoughts on Representing Spatial Objects William A. Huber Quantitative Decisions Rosemont, PA Overview 1. Some Ways to Structure Space 2. What to Put into a Grid 3. Objects and Fields 4. Hybrid Structures
Spa$al Analysis and Modeling (GIST 4302/5302) Guofeng Cao Department of Geosciences Texas Tech University
 Guofeng Cao Department of Geosciences Texas Tech University") Spa$al Analysis and Modeling (GIST 432/532) Guofeng Cao Department of Geosciences Texas Tech University Representa$on of Spa$al Data Representa$on of Spa$al Data Models Object- based model: treats the
Spa$al Analysis and Modeling (GIST 432/532) Guofeng Cao Department of Geosciences Texas Tech University Representa$on of Spa$al Data Representa$on of Spa$al Data Models Object- based model: treats the
Houghton Mifflin MATHEMATICS Level 5 correlated to NCTM Standard
 s 2000 Number and Operations Standard Understand numbers, ways of representing numbers, relationships among numbers, and number systems understand the place-value structure of the TE: 4 5, 8 11, 14 17,
Lab 10: Raster Analyses
 Lab 10: Raster Analyses What You ll Learn: Spatial analysis and modeling with raster data. You will estimate the access costs for all points on a landscape, based on slope and distance to roads. You ll
Computation of Slope
 Computation of Slope Prepared by David R. Maidment and David Tarboton GIS in Water Resources Class University of Texas at Austin September 2011, Revised December 2011 There are various ways in which slope
Interactive Math Glossary Terms and Definitions
 Terms and Definitions Absolute Value the magnitude of a number, or the distance from 0 on a real number line Addend any number or quantity being added addend + addend = sum Additive Property of Area the
Computer Database Structure for Managing Data :-
 The Map as an Abstraction of Space :- We begin the process of abstraction by conceptualizing what we encounter as a group of points, lines, areas and surfaces. We make decision about which object to take
Data handling 3: Alter Process
 Introduction Geo information Science (GRS 10306) Data handling 3: Alter Process 2009/2010 CGI GIRS 2 Alter / process / analysis / operations definition Query a data handling class of operators which doesn
Downloaded from
 UNIT 2 WHAT IS STATISTICS? Researchers deal with a large amount of data and have to draw dependable conclusions on the basis of data collected for the purpose. Statistics help the researchers in making
Number and Operation Standard #1. Divide multi- digit numbers; solve real- world and mathematical problems using arithmetic.
 Number and Operation Standard #1 MN Math Standards Vertical Alignment for Grade 5 Demonstrate mastery of multiplication and division basic facts; multiply multi- digit numbers; solve real- world and mathematical
SHAPE, SPACE & MEASURE
 STAGE 1 Know the place value headings up to millions Recall primes to 19 Know the first 12 square numbers Know the Roman numerals I, V, X, L, C, D, M Know the % symbol Know percentage and decimal equivalents
Using GIS To Estimate Changes in Runoff and Urban Surface Cover In Part of the Waller Creek Watershed Austin, Texas
 Using GIS To Estimate Changes in Runoff and Urban Surface Cover In Part of the Waller Creek Watershed Austin, Texas Jordan Thomas 12-6-2009 Introduction The goal of this project is to understand runoff
Decimals should be spoken digit by digit eg 0.34 is Zero (or nought) point three four (NOT thirty four).
 point three four (NOT thirty four).") Numeracy Essentials Section 1 Number Skills Reading and writing numbers All numbers should be written correctly. Most pupils are able to read, write and say numbers up to a thousand, but often have difficulty
Numeracy Essentials Section 1 Number Skills Reading and writing numbers All numbers should be written correctly. Most pupils are able to read, write and say numbers up to a thousand, but often have difficulty
Spatial Interpolation & Geostatistics
 (Z i Z j ) 2 / 2 Spatial Interpolation & Geostatistics Lag Lag Mean Distance between pairs of points 1 Tobler s Law All places are related, but nearby places are related more than distant places Corollary:
Number/Computation. addend Any number being added. digit Any one of the ten symbols: 0, 1, 2, 3, 4, 5, 6, 7, 8, or 9
 14 Number/Computation addend Any number being added algorithm A step-by-step method for computing array A picture that shows a number of items arranged in rows and columns to form a rectangle associative
Lesson 4A overview. Introduction to Map Algebra (4A) Map Algebra functions (4B)
 Map Algebra functions (4B)") Map Algebra Lesson 4A overview Introduction to Map Algebra (4A) Language components Syntax and rules Objects Operators Commands Exercise 5A Map Algebra functions (4B) Function syntax Local functions Focal
Map Algebra Lesson 4A overview Introduction to Map Algebra (4A) Language components Syntax and rules Objects Operators Commands Exercise 5A Map Algebra functions (4B) Function syntax Local functions Focal
Statistical surfaces and interpolation. This is lecture ten
 Statistical surfaces and interpolation This is lecture ten Data models for representation of surfaces So far have considered field and object data models (represented by raster and vector data structures).
Channel Conditions in the Onion Creek Watershed. Integrating High Resolution Elevation Data in Flood Forecasting
 Channel Conditions in the Onion Creek Watershed Integrating High Resolution Elevation Data in Flood Forecasting Lukas Godbout GIS in Water Resources CE394K Fall 2016 Introduction Motivation Flooding is
Does Not Meet State Standard Meets State Standard
 Exceeds the Standard Solves real-world and mathematical problems using addition, subtraction, and multiplication; understands that the size of a fractional part is relative to the size of the whole. Exceeds
Spatial Analysis and Modeling (GIST 4302/5302) Guofeng Cao Department of Geosciences Texas Tech University
 Guofeng Cao Department of Geosciences Texas Tech University") Spatial Analysis and Modeling (GIST 4302/5302) Guofeng Cao Department of Geosciences Texas Tech University Outline of Today Last week, we learned: Characteristics of spatial data Types of spatial data
Spatial Analysis and Modeling (GIST 4302/5302) Guofeng Cao Department of Geosciences Texas Tech University Outline of Today Last week, we learned: Characteristics of spatial data Types of spatial data
Read, write compare and order numbers beyond 1000 in numerals and words Read Roman numerals to 100 and understand how they have changed through time
 Number Year 4 Year 5 Year 6 Year 6 Exceeded Developing Count reliably to and from 20 putting numbers in order Year 2 Year 3 Read, write and compare and order numbers 0-1000 in numerals and words Read,
Beyond The Vector Data Model - Part Two
 Beyond The Vector Data Model - Part Two Introduction Spatial Analyst Extension (Spatial Analysis) What is your question? Selecting a method of analysis Map Algebra Who is the audience? What is Spatial
University of West Hungary, Faculty of Geoinformatics. Béla Márkus. Spatial Analysis 5. module SAN5. 3D analysis
 University of West Hungary, Faculty of Geoinformatics Béla Márkus Spatial Analysis 5. module SAN5 3D analysis SZÉKESFEHÉRVÁR 2010 The right to this intellectual property is protected by the 1999/LXXVI
Tutorial: Using SAGA for Least Cost Path Analysis
 Tutorial: Using SAGA for Least Cost Path Analysis Developed by Kim Cimmery (Kapcimmery at hot mail dot com) March 2013 1. Introduction The shortest path between two points is a straight line (unless you
Glossary Common Core Curriculum Maps Math/Grade 6 Grade 8
 Glossary Common Core Curriculum Maps Math/Grade 6 Grade 8 Grade 6 Grade 8 absolute value Distance of a number (x) from zero on a number line. Because absolute value represents distance, the absolute value
Spatial Interpolation - Geostatistics 4/3/2018
 Spatial Interpolation - Geostatistics 4/3/201 (Z i Z j ) 2 / 2 Spatial Interpolation & Geostatistics Lag Distance between pairs of points Lag Mean Tobler s Law All places are related, but nearby places