RASTER ANALYSIS S H A W N L. P E N M A N E A R T H D A T A A N A LY S I S C E N T E R U N I V E R S I T Y O F N E W M E X I C O
|
|
|
- Ross Leonard
- 5 years ago
- Views:
Transcription
1 RASTER ANALYSIS S H A W N L. P E N M A N E A R T H D A T A A N A LY S I S C E N T E R U N I V E R S I T Y O F N E W M E X I C O
2 TOPICS COVERED Spatial Analyst basics Raster / Vector conversion Raster data fundamentals Cells, cell values, zones and regions Basic spatial properties of raster Points, lines, polygons, distance, adjacency, buffer, network Types of raster functions Raster reclassification Raster overlay Raster query and map algebra Distance functions Zonal statistics Other raster analysis tools
3 SPATIAL ANALYST BASICS

4 SPATIAL ANALYST TO WORK WITH RASTER DATA
5 ARCGIS SPATIAL ANALYST Extremely useful extension to ArcGIS Same for all levels (ArcView, ArcInfo) Needs to be purchased separately. Spatial Analyst uses grids essentially makes ArcGIS into a raster program Spatial analysis and modeling tools queries, overlay, distance, proximity, density, slope, aspect, hillshade, viewshed, contours, etc.

6 TURNING SPATIAL ANALYST ON


7 SPATIAL ANALYST TOOLBAR & ARCTOOLBOX ArcMap 10.1 Spatial Analyst & Image Classification Toolbars ArcMap 9.3 Spatial Analyst Toolbar Tools now in ArcToolbox
8 RASTER FORMATS ADRG (ARC Digitized Raster Graphics) CADRG (Compressed ADRG) CIB (Controlled Image Base) DTED (Digital Terrain Elevation Data) ERDAS GIS, LAN, RAW, IMG ERMapper (ERS) BIL, BIP, BSQ ESRI GRID GIF, JPG, SID, TIF, BMP

9 Grids are the main raster format of ArcGIS Spatial Analyst. Output created by Spatial Analyst consist of grids these can be converted to other formats using ArcCatalog. GRIDS
10 WORKING WITH GRIDS Grids are stored very much like coverages. Always set a proper working directory and never delete files manually in Windows Explorer but use ArcCatalog.


11 BUILDING PYRAMIDS Pyramids are used to improve performance. They are a downsampled version of the original raster dataset and can contain many downsampled layers. Each successive layer of the pyramid is downsampled at a scale of 2:1. Pyramids can speed up the display of raster data by retrieving only the data at a specified resolution that is required for the display.
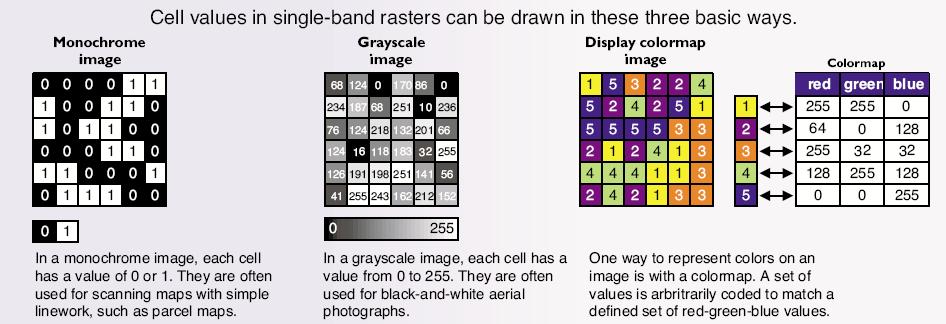
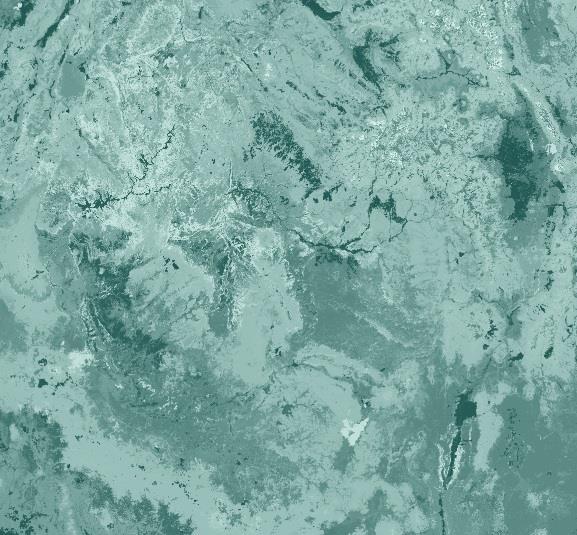
12 SINGLE-BAND RASTERS

13 MULTIBAND RASTERS
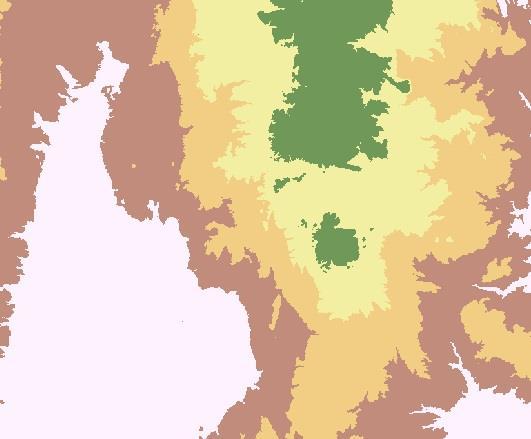
14 DISPLAYING GRIDS Grid data files can be classified using the Symboloy properties Grid cells are given a solid color based on cell values Both discrete and continuous data are used discrete data are stored an integer grid theme, e.g. land use, soil type, land ownership, etc. continuous data are stored as an integer or floating point grid theme, e.g. population density, elevation, price of land etc. Various classification methods can be used Unique values Classified Stretched


15 GRID MAP EXAMPLE Housing units in city of Pittsburgh Census block centroids Kernel density raster map GIS TUTORIAL 1 - Basic Workbook

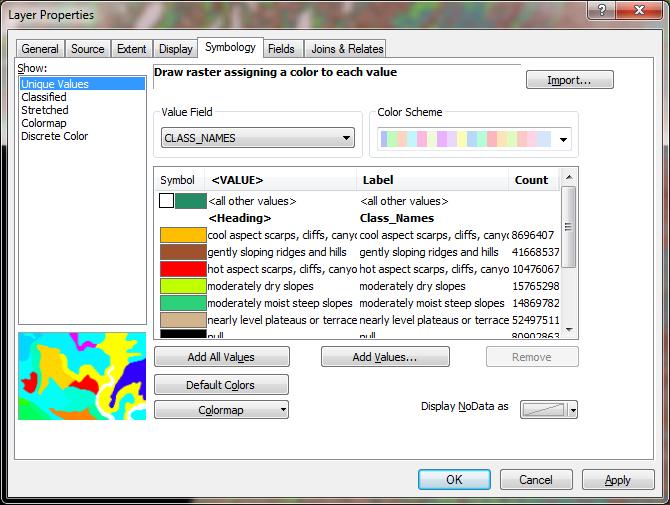
16 UNIQUE VALUES

17 CLASSIFIED

18 STRETCHED


19 ANALYSIS OPTIONS Now settings under Environments
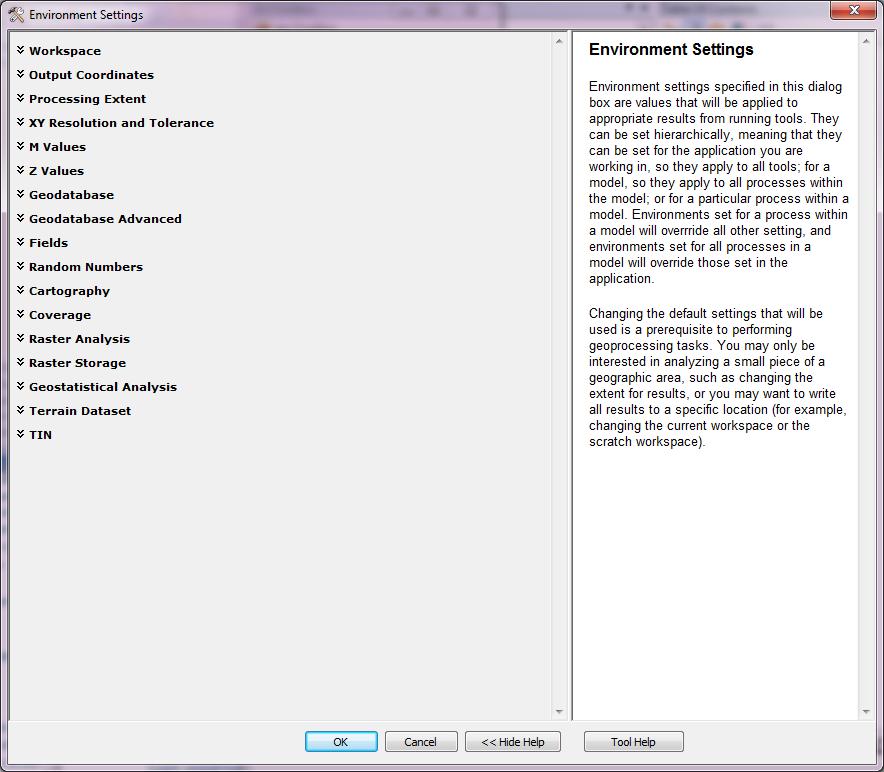
20 ENVIRONMENTS

21 ANALYSIS MASK The mask identifies those cells within the analysis extent that will not be considered when performing an operation or a function. All identified cells will be "out" and assigned to the nodata value on all subsequent output raster datasets.


22 ANALYSIS MASK The analysis extent be a vector or raster file in the example, a vector polygon is used as a mask to create slope map from a DEM but only within the study area.

23 ANALYSIS EXTENT When performing analysis, the area of interest may be a portion of a larger raster dataset. If the area of interest is a portion of a larger raster dataset, the analysis extent can be set to encompass only the desired cells. All subsequent results from analysis will be to this extent. The analysis extent is a rectangle and is specified by identifying the coordinates of the window in map space.
24 RASTER RESOLUTION

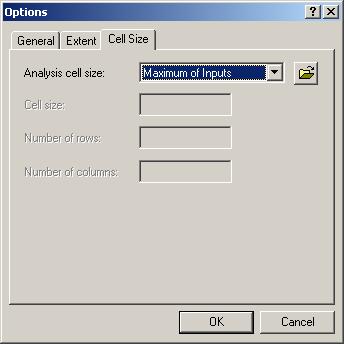
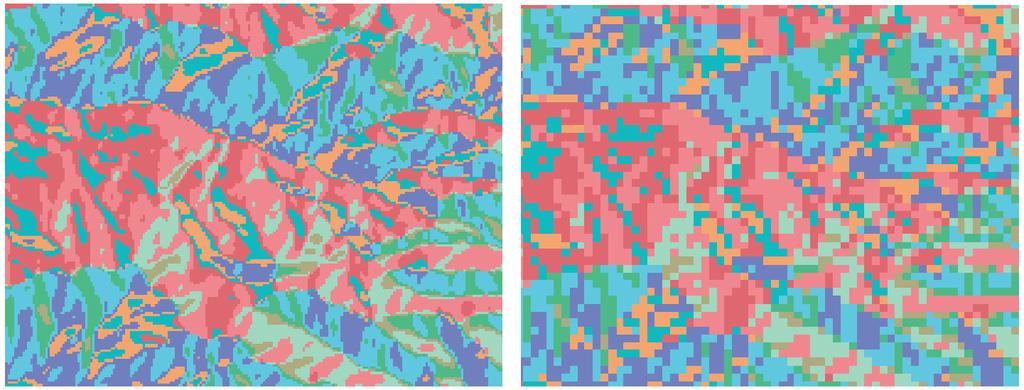
25 CELL SIZE The output cell size, or resolution, for any operation or function can be set to any size desired. The default output resolution is determined by the coarsest of the input raster datasets.
26 RASTER / VECTOR CONVERSION

27 RASTER / VECTOR CONVERSION

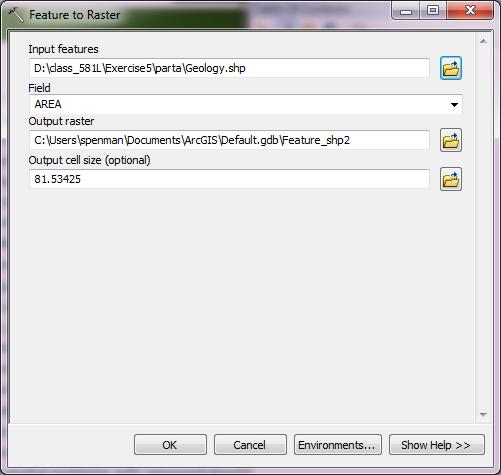
28 RASTER / VECTOR CONVERSION

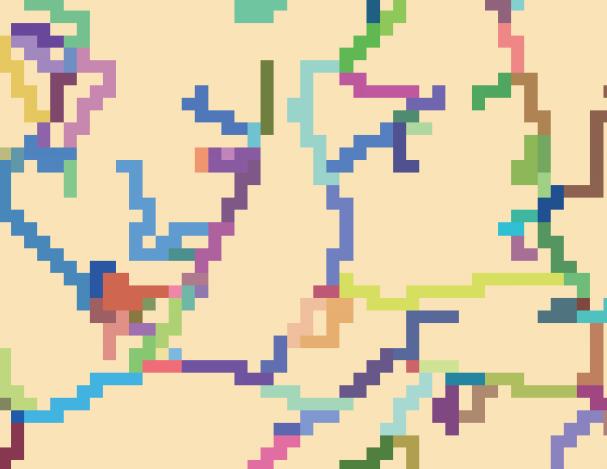
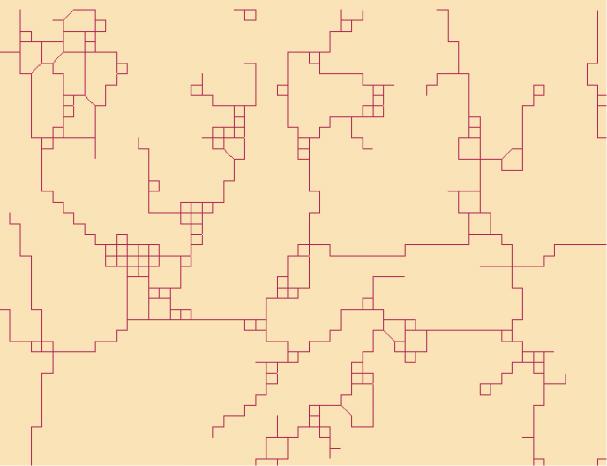
29 RASTER / VECTOR CONVERSION
30 RASTER DATA FUNDAMENTALS
31 CELLS, ROWS, COLUMNS AND VALUES Columns (4,1) Rows Raster data sets are an organized matrix of cells. Cells are organized into rows & columns which have an index position number. The top left cell is at the (0,0) position. The notation uses column first, followed by row.
32 Y axis RASTER DATA AND COORDINATE SYSTEMS Raster origin (135,982;1,251,821) Raster data layers are stored with a Cartesian coordinate system. Positions on the grid have real-world locations. Each cell can be referenced by an X,Y location. All cells are square & are the same size. Coordinate origin (0,0) X axis
33 CELL VALUES
34 INTEGER VS. FLOATING POINT

35 DATA TYPES AND CELL VALUES

36 WORKING WITH NO DATA
37 ZONES An example with 6 zones Any two or more cells within the same value belong to the same zone a zone can consist of cells that are connected, disconnected or both.
38 ZONES AND ATTRIBUTE DATA Value Count
39 BASIC SPATIAL PROPERTIES OF RASTER
40 BASIS SPATIAL PROPERTIES IN RASTER Points Line Polygons Distance Adjacency Buffer Network Spatial Coincidence
41 RASTER - POINTS
42 RASTER - LINES
43 RASTER - POLYGONS
44 RASTER - DISTANCE
45 RASTER - ADJACENCY Orthogonal and diagonal Orthogonal only
46 RASTER - BUFFER
47 RASTER - NETWORK
48 RASTER SPATIAL COINCIDENCE
49 TYPES OF RASTER FUNCTIONS
50 RASTER FUNCTIONS Local Zonal Focal Global
51 LOCAL FUNCTION EXAMPLE: RASTER CALCULATOR * 2 =
52 GLOBAL FUNCTION EXAMPLE: STRAIGHT- LINE DISTANCE Distance of =
53 RASTER RECLASSIFICATION
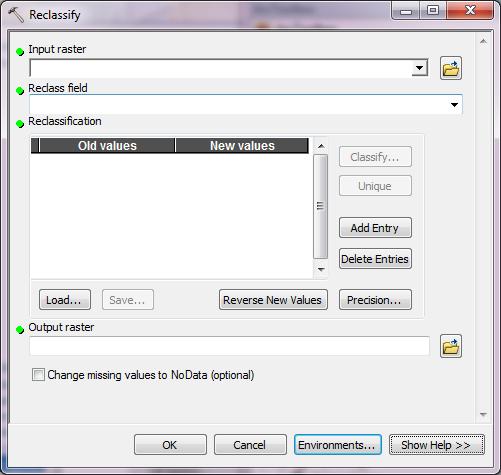
54 RECLASSIFY Reclassifying your data simply means replacing input cell values with new output cell values. The input data can be any supported raster format. If you add a multiband raster, the first band will be taken and used in the reclassification.
55 ELEVATION RASTER
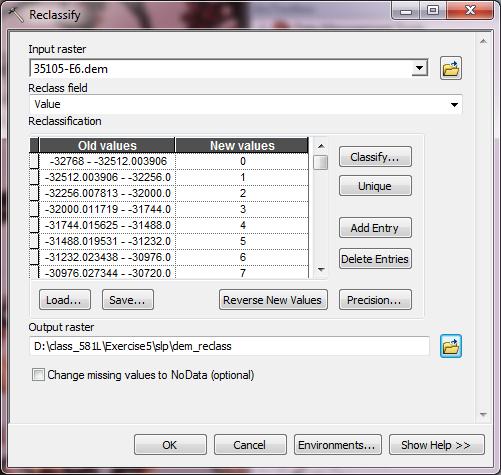
56

57 RECLASSIFY
58 RECLASSIFY There are many reasons why you might want to reclassify your data. Some of the most common reasons are: To replace values based on new information To classify certain values together for display To classify certain values together for conversion to vector format for analysis To reclassify values to a common scale To set specific values to nodata or to set nodata cells to a value
59 RECLASSIFY Reclassification is useful when you want to replace the values in the input raster with new values. This could be due to finding out that the value of a cell or a number of cells should actually be a different value. For example, this may happen if the landuse in an area changed over time. You may want to simplify the information in a raster. For instance, you may want to group together various types of forest into one forest class.
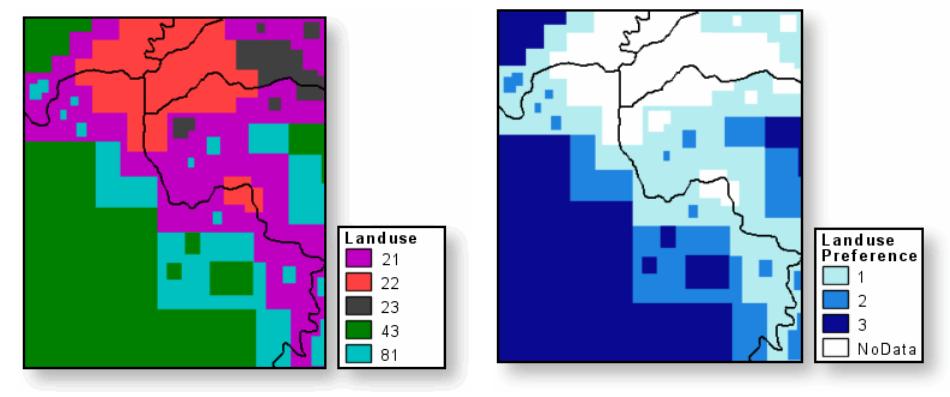
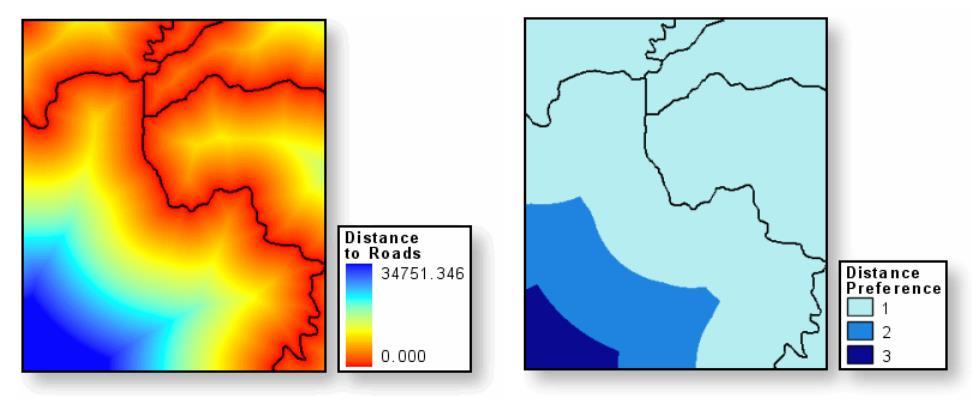
60 RECLASSIFY Another reason to reclassify is to assign values of preference, sensitivity, priority, or some similar criteria to a raster. This may be done on a single raster (a raster of soil type may be assigned values of 1 10 that represent erosion potential) or with several rasters to create a common scale of values. For example, when finding slopes most at risk of avalanche activity, input rasters might be slope, soil type, and vegetation. Each of these rasters might be reclassified on a scale of 1 10 depending on the susceptibility of each attribute in each raster to avalanche activity (that is, steep slopes in the slope raster might be given a value of 10 because they are most susceptible to avalanche activity).
61 RECLASSIFY Sometimes you want to remove specific values from your analysis. This might be, for example, because a certain landuse type has restrictions (such as wetland restrictions), which means you cannot build there. In such cases, you might want to change these values to nodata in order to remove them from further analysis. In other cases, you may want to change a value of NoData to be a value such as in the case where new information means a value of NoData has become a known value.
62 RECLASSIFY
63 RECLASSIFY
64 FTP SITE ftp://edacftp.unm.edu/outgoing/pub/spenman/geog581l/exam ples_raster_analysis/part1
65 DEMO/PRACTICE Open Tutorial1-1 mxd DEM Properties, Source tab how many columns & rows and what is their size? What is the projection? Statistics what is the range of elevation? Examine attribute table of LandUse How many records are there? Set Environment turn on spatial analyst toolbar Set Raster Analysis Environment Cell size, select as specified as below, 50, mask Pittsburgh Extract Land Use using a mask Use layer file to symbolize new land use layer
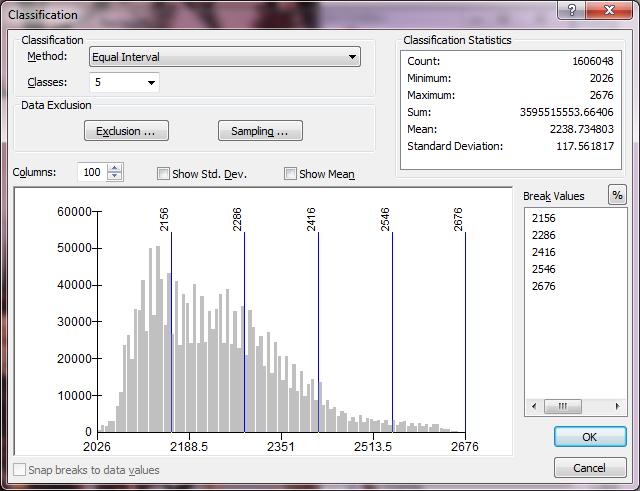
66 DEMO/PRACTICE Reclassify Tool Reclassify LandUse All developed into one category All forest into one category All wetlands into one category Have to look at classification (symbology tab) to figure out which numbers belong to developed, forest and wetlands categories Examine changes Try reclassify with Classification window Use reclassified LandUse and export to polygon
Lab 1: Exploring data format
 Geog 458: Map Sources and Errors January 13, 2006 Lab 1: Exploring data format Data format supported by ArcGIS There are many file types supported by ArcGIS, in addition to specific cartographic objects.
RASTER ANALYSIS GIS Analysis Fall 2013
 RASTER ANALYSIS GIS Analysis Fall 2013 Raster Data The Basics Raster Data Format Matrix of cells (pixels) organized into rows and columns (grid); each cell contains a value representing information. What
RASTER ANALYSIS GIS Analysis Winter 2016
 RASTER ANALYSIS GIS Analysis Winter 2016 Raster Data The Basics Raster Data Format Matrix of cells (pixels) organized into rows and columns (grid); each cell contains a value representing information.
Cell based GIS. Introduction to rasters
 Week 9 Cell based GIS Introduction to rasters topics of the week Spatial Problems Modeling Raster basics Application functions Analysis environment, the mask Application functions Spatial Analyst in ArcGIS
Raster GIS applications
 Raster GIS applications Columns Rows Image: cell value = amount of reflection from surface DEM: cell value = elevation (also slope/aspect/hillshade/curvature) Thematic layer: cell value = category or measured
Using GIS to Site Minimal Excavation Helicopter Landings
 Using GIS to Site Minimal Excavation Helicopter Landings The objective of this analysis is to develop a suitability map for aid in locating helicopter landings in mountainous terrain. The tutorial uses
Module 7 Raster operations
 Introduction Geo-Information Science Practical Manual Module 7 Raster operations 7. INTRODUCTION 7-1 LOCAL OPERATIONS 7-2 Mathematical functions and operators 7-5 Raster overlay 7-7 FOCAL OPERATIONS 7-8
Welcome to NR402 GIS Applications in Natural Resources. This course consists of 9 lessons, including Power point presentations, demonstrations,
 Welcome to NR402 GIS Applications in Natural Resources. This course consists of 9 lessons, including Power point presentations, demonstrations, readings, and hands on GIS lab exercises. Following the last
Raster GIS applications Columns
 Raster GIS applications Columns Rows Image: cell value = amount of reflection from surface Thematic layer: cell value = category or measured value - In both cases, there is only one value per cell (in
Raster Data Model & Analysis
 Topics: 1. Understanding Raster Data 2. Adding and displaying raster data in ArcMap 3. Converting between floating-point raster and integer raster 4. Converting Vector data to Raster 5. Querying Raster
Basics of Using LiDAR Data
 Conservation Applications of LiDAR Basics of Using LiDAR Data Exercise #2: Raster Processing 2013 Joel Nelson, University of Minnesota Department of Soil, Water, and Climate This exercise was developed
Soil texture: based on percentage of sand in the soil, partially determines the rate of percolation of water into the groundwater.
 Overview: In this week's lab you will identify areas within Webster Township that are most vulnerable to surface and groundwater contamination by conducting a risk analysis with raster data. You will create
Spatial Analysis with Raster Datasets
 Spatial Analysis with Raster Datasets Francisco Olivera, Ph.D., P.E. Srikanth Koka Lauren Walker Aishwarya Vijaykumar Keri Clary Department of Civil Engineering April 21, 2014 Contents Brief Overview of
Lecture 20 - Chapter 8 (Raster Analysis, part1)
") GEOL 452/552 - GIS for Geoscientists I Lecture 20 - Chapter 8 (Raster Analysis, part) 4 lectures on rasters - but won t cover everything (Raster GIS course: Geol 588: GIS II (Spring 20) Today: Raster data,
GEOL 452/552 - GIS for Geoscientists I Lecture 20 - Chapter 8 (Raster Analysis, part) 4 lectures on rasters - but won t cover everything (Raster GIS course: Geol 588: GIS II (Spring 20) Today: Raster data,
ENGRG Introduction to GIS
 ENGRG 59910 Introduction to GIS Michael Piasecki April 3, 2014 Lecture 11: Raster Analysis GIS Related? 4/3/2014 ENGRG 59910 Intro to GIS 2 1 Why we use Raster GIS In our previous discussion of data models,
Lab 12: Sampling and Interpolation
 Lab 12: Sampling and Interpolation What You ll Learn: -Systematic and random sampling -Majority filtering -Stratified sampling -A few basic interpolation methods Videos that show how to copy/paste data
Pond Distance and Habitat for use in Wildlife Modeling
 Pond Distance and Habitat for use in Wildlife Modeling These instructions enable you to aggregate layers within a study area, calculate new fields, and create new data out of existing data, for use in
Field-Scale Watershed Analysis
 Conservation Applications of LiDAR Field-Scale Watershed Analysis A Supplemental Exercise for the Hydrologic Applications Module Andy Jenks, University of Minnesota Department of Forest Resources 2013
Tutorial 18: 3D and Spatial Analyst - Creating a TIN and Visual Analysis
 Tutorial 18: 3D and Spatial Analyst - Creating a TIN and Visual Analysis Module content 18.1. Creating a TIN 18.2. Spatial Analyst Viewsheds, Slopes, Hillshades and Density. 18.1 Creating a TIN Sometimes
Raster Data. James Frew ESM 263 Winter
 Raster Data 1 Vector Data Review discrete objects geometry = points by themselves connected lines closed polygons attributes linked to feature ID explicit location every point has coordinates 2 Fields
GEOGRAPHIC INFORMATION SYSTEMS Lecture 02: Feature Types and Data Models
 GEOGRAPHIC INFORMATION SYSTEMS Lecture 02: Feature Types and Data Models Feature Types and Data Models How Does a GIS Work? - a GIS operates on the premise that all of the features in the real world can
Getting Started with Spatial Analyst. Steve Kopp Elizabeth Graham
 Getting Started with Spatial Analyst Steve Kopp Elizabeth Graham Spatial Analyst Overview Over 100 geoprocessing tools plus raster functions Raster and vector analysis Construct workflows with ModelBuilder,
A Second Look at DEM s
 A Second Look at DEM s Overview Detailed topographic data is available for the U.S. from several sources and in several formats. Perhaps the most readily available and easy to use is the National Elevation
Getting Started with Spatial Analyst. Steve Kopp Elizabeth Graham
 Getting Started with Spatial Analyst Steve Kopp Elizabeth Graham Workshop Overview Fundamentals of using Spatial Analyst What analysis capabilities exist and where to find them How to build a simple site
Making Yield Contour Maps Using John Deere Data
 Making Yield Contour Maps Using John Deere Data Exporting the Yield Data Using JDOffice 1. Data Format On Hard Drive 2. Start program JD Office. a. From the PC Card menu on the left of the screen choose
Combine Yield Data From Combine to Contour Map Ag Leader
 Combine Yield Data From Combine to Contour Map Ag Leader Exporting the Yield Data Using SMS Program 1. Data format On Hard Drive. 2. Start program SMS Basic. a. In the File menu choose Open. b. Click on
INTRODUCTION TO GIS WORKSHOP EXERCISE
 111 Mulford Hall, College of Natural Resources, UC Berkeley (510) 643-4539 INTRODUCTION TO GIS WORKSHOP EXERCISE This exercise is a survey of some GIS and spatial analysis tools for ecological and natural
Masking Lidar Cliff-Edge Artifacts
 Masking Lidar Cliff-Edge Artifacts Methods 6/12/2014 Authors: Abigail Schaaf is a Remote Sensing Specialist at RedCastle Resources, Inc., working on site at the Remote Sensing Applications Center in Salt
GEO 465/565 - Lab 7 Working with GTOPO30 Data in ArcGIS 9
 GEO 465/565 - Lab 7 Working with GTOPO30 Data in ArcGIS 9 This lab explains how work with a Global 30-Arc-Second (GTOPO30) digital elevation model (DEM) from the U.S. Geological Survey. This dataset can
Introduction to GIS 2011
 Introduction to GIS 2011 Digital Elevation Models CREATING A TIN SURFACE FROM CONTOUR LINES 1. Start ArcCatalog from either Desktop or Start Menu. 2. In ArcCatalog, create a new folder dem under your c:\introgis_2011
Ex. 4: Locational Editing of The BARC
 Ex. 4: Locational Editing of The BARC Using the BARC for BAER Support Document Updated: April 2010 These exercises are written for ArcGIS 9.x. Some steps may vary slightly if you are working in ArcGIS
Data Assembly, Part II. GIS Cyberinfrastructure Module Day 4
 Data Assembly, Part II GIS Cyberinfrastructure Module Day 4 Objectives Continuation of effective troubleshooting Create shapefiles for analysis with buffers, union, and dissolve functions Calculate polygon
Lab 11: Terrain Analyses
 Lab 11: Terrain Analyses What You ll Learn: Basic terrain analysis functions, including watershed, viewshed, and profile processing. There is a mix of old and new functions used in this lab. We ll explain
Stream network delineation and scaling issues with high resolution data
 Stream network delineation and scaling issues with high resolution data Roman DiBiase, Arizona State University, May 1, 2008 Abstract: In this tutorial, we will go through the process of extracting a stream
GIS Fundamentals: Supplementary Lessons with ArcGIS Pro
 Station Analysis (parts 1 & 2) What You ll Learn: - Practice various skills using ArcMap. - Combining parcels, land use, impervious surface, and elevation data to calculate suitabilities for various uses
GEOGRAPHIC INFORMATION SYSTEMS Lecture 25: 3D Analyst
 GEOGRAPHIC INFORMATION SYSTEMS Lecture 25: 3D Analyst 3D Analyst - 3D Analyst is an ArcGIS extension designed to work with TIN data (triangulated irregular network) - many of the tools in 3D Analyst also
LAB 1: Introduction to ArcGIS 8
 LAB 1: Introduction to ArcGIS 8 Outline Introduction Purpose Lab Basics o About the Computers o About the software o Additional information Data ArcGIS Applications o Starting ArcGIS o o o Conclusion To
Your Prioritized List. Priority 1 Faulted gridding and contouring. Priority 2 Geoprocessing. Priority 3 Raster format
 Your Prioritized List Priority 1 Faulted gridding and contouring Priority 2 Geoprocessing Priority 3 Raster format Priority 4 Raster Catalogs and SDE Priority 5 Expanded 3D Functionality Priority 1 Faulted
Working with Elevation Data URPL 969 Applied GIS Workshop: Rethinking New Orleans After Hurricane Katrina Spring 2006
 Working with Elevation Data URPL 969 Applied GIS Workshop: Rethinking New Orleans After Hurricane Katrina Spring 2006 This GIS lab exercise will explore Light Detection And Ranging (LiDAR) data for New
Watershed Sciences 4930 & 6920 GEOGRAPHIC INFORMATION SYSTEMS
 HOUSEKEEPING Watershed Sciences 4930 & 6920 GEOGRAPHIC INFORMATION SYSTEMS CONTOURS! Self-Paced Lab Due Friday! WEEK SIX Lecture RASTER ANALYSES Joe Wheaton YOUR EXCERCISE Integer Elevations Rounded up
Finding and Using Spatial Data
 Finding and Using Spatial Data Introduction In this lab, you will download two different versions of the National Wetlands Inventory (NWI) dataset for a region of Massachusetts, from a source on the internet.
Raster Analysis. Overview Neighborhood Analysis Overlay Cost Surfaces. Arthur J. Lembo, Jr. Salisbury University
 Raster Analysis Overview Neighborhood Analysis Overlay Cost Surfaces Exam results Mean: 74% STDEV: 15% High: 92 Breakdown: A: 1 B: 2 C: 2 D: 1 F: 2 We will review the exam next Tuesday. Start thinking
Lecture 6: GIS Spatial Analysis. GE 118: INTRODUCTION TO GIS Engr. Meriam M. Santillan Caraga State University
 Lecture 6: GIS Spatial Analysis GE 118: INTRODUCTION TO GIS Engr. Meriam M. Santillan Caraga State University 1 Spatial Data It can be most simply defined as information that describes the distribution
Lecture 9. Raster Data Analysis. Tomislav Sapic GIS Technologist Faculty of Natural Resources Management Lakehead University
 Lecture 9 Raster Data Analysis Tomislav Sapic GIS Technologist Faculty of Natural Resources Management Lakehead University Raster Data Model The GIS raster data model represents datasets in which square
Copyright The McGraw-Hill Companies, Inc. Permission required for reproduction or display.
 CHAPTER 12 RASTER DATA ANALYSIS 12.1 Data Analysis Environment Box 12.1 How to Make an Analysis Mask 12.2 Local Operations 12.2.1 Local Operations with a Single Raster 12.2.2 Reclassification 12.2.3 Local
Geoprocessing and georeferencing raster data
 Geoprocessing and georeferencing raster data Raster conversion tools Geoprocessing tools ArcCatalog tools ESRI Grid GDB Raster Raster Dataset Raster Catalog Erdas IMAGINE TIFF ArcMap - raster projection
Lab 1: Exploring ArcMap and ArcCatalog In this lab, you will explore the ArcGIS applications ArcCatalog and ArcMap. You will learn how to use
 Lab 1: Exploring ArcMap and ArcCatalog In this lab, you will explore the ArcGIS applications ArcCatalog and ArcMap. You will learn how to use ArcCatalog to find maps and data and how to display maps in
COPYRIGHTED MATERIAL. Introduction to 3D Data: Modeling with ArcGIS 3D Analyst and Google Earth CHAPTER 1
 CHAPTER 1 Introduction to 3D Data: Modeling with ArcGIS 3D Analyst and Google Earth Introduction to 3D Data is a self - study tutorial workbook that teaches you how to create data and maps with ESRI s
Lab 11: Terrain Analyses
 Lab 11: Terrain Analyses What You ll Learn: Basic terrain analysis functions, including watershed, viewshed, and profile processing. There is a mix of old and new functions used in this lab. We ll explain
The GIS Spatial Data Model
 The GIS Spatial Data Model Introduction: Spatial data are what drive a GIS. Every piece of functionality that makes a GIS separate from another analytical environment is rooted in the spatially explicit
GEOGRAPHIC INFORMATION SYSTEMS Lecture 18: Spatial Modeling
 Spatial Analysis in GIS (cont d) GEOGRAPHIC INFORMATION SYSTEMS Lecture 18: Spatial Modeling - the basic types of analysis that can be accomplished with a GIS are outlined in The Esri Guide to GIS Analysis
Image Services for Elevation Data
 Image Services for Elevation Data Peter Becker Need for Elevation Using Image Services for Elevation Data sources Creating Elevation Service Requirement: GIS and Imagery, Integrated and Accessible Field
Suitability Modeling with GIS
 Developed and Presented by Juniper GIS 1/33 Course Objectives What is Suitability Modeling? The Suitability Modeling Process Cartographic Modeling GIS Tools for Suitability Modeling Demonstrations of Models
Raster Analysis. Overview Neighborhood Analysis Overlay Cost Surfaces. Arthur J. Lembo, Jr. Salisbury University
 Raster Analysis Overview Neighborhood Analysis Overlay Cost Surfaces Why we use Raster GIS In our previous discussion of data models, we indicated that Raster GIS is often used because: Raster is better
Lecture 21 - Chapter 8 (Raster Analysis, part2)
") GEOL 452/552 - GIS for Geoscientists I Lecture 21 - Chapter 8 (Raster Analysis, part2) Today: Digital Elevation Models (DEMs), Topographic functions (surface analysis): slope, aspect hillshade, viewshed,
GEOL 452/552 - GIS for Geoscientists I Lecture 21 - Chapter 8 (Raster Analysis, part2) Today: Digital Elevation Models (DEMs), Topographic functions (surface analysis): slope, aspect hillshade, viewshed,
By Colin Childs, ESRI Education Services. Catalog
 s resolve many traditional raster management issues By Colin Childs, ESRI Education Services Source images ArcGIS 10 introduces Catalog Mosaicked images Sources, mosaic methods, and functions are used
Lab 12: Sampling and Interpolation
 Lab 12: Sampling and Interpolation What You ll Learn: -Systematic and random sampling -Majority filtering -Stratified sampling -A few basic interpolation methods Data for the exercise are in the L12 subdirectory.
GIS LAB 8. Raster Data Applications Watershed Delineation
 GIS LAB 8 Raster Data Applications Watershed Delineation This lab will require you to further your familiarity with raster data structures and the Spatial Analyst. The data for this lab are drawn from
Raster: The Other GIS Data
 Raster_The_Other_GIS_Data.Docx Page 1 of 11 Raster: The Other GIS Data Objectives Understand the raster format and how it is used to model continuous geographic phenomena. Understand how projections &
Introducing ArcScan for ArcGIS
 Introducing ArcScan for ArcGIS An ESRI White Paper August 2003 ESRI 380 New York St., Redlands, CA 92373-8100, USA TEL 909-793-2853 FAX 909-793-5953 E-MAIL info@esri.com WEB www.esri.com Copyright 2003
STUDENT PAGES GIS Tutorial Treasure in the Treasure State
 STUDENT PAGES GIS Tutorial Treasure in the Treasure State Copyright 2015 Bear Trust International GIS Tutorial 1 Exercise 1: Make a Hand Drawn Map of the School Yard and Playground Your teacher will provide
Lab 10: Raster Analyses
 Lab 10: Raster Analyses What You ll Learn: Spatial analysis and modeling with raster data. You will estimate the access costs for all points on a landscape, based on slope and distance to roads. You ll
Creating raster DEMs and DSMs from large lidar point collections. Summary. Coming up with a plan. Using the Point To Raster geoprocessing tool
 Page 1 of 5 Creating raster DEMs and DSMs from large lidar point collections ArcGIS 10 Summary Raster, or gridded, elevation models are one of the most common GIS data types. They can be used in many ways
Lecture 22 - Chapter 8 (Raster Analysis, part 3)
") GEOL 452/552 - GIS for Geoscientists I Lecture 22 - Chapter 8 (Raster Analysis, part 3) Today: Zonal Analysis (statistics) for polygons, lines, points, interpolation (IDW), Effects Toolbar, analysis masks
GEOL 452/552 - GIS for Geoscientists I Lecture 22 - Chapter 8 (Raster Analysis, part 3) Today: Zonal Analysis (statistics) for polygons, lines, points, interpolation (IDW), Effects Toolbar, analysis masks
Lesson 8 : How to Create a Distance from a Water Layer
 Created By: Lane Carter Advisor: Paul Evangelista Date: July 2011 Software: ArcGIS 10 Lesson 8 : How to Create a Distance from a Water Layer Background This tutorial will cover the basic processes involved
Surface Analysis with 3D Analyst
 2013 Esri International User Conference July 8 12, 2013 San Diego, California Technical Workshop Surface Analysis with 3D Analyst Khalid H. Duri Esri UC2013. Technical Workshop. Why use 3D GIS? Because
ArcScan. for ArcGIS. GIS by ESRI
 ArcScan for ArcGIS GIS by ESRI Copyright 2002 ESRI All rights reserved Printed in the United States of America The information contained in this document is the exclusive property of ESRI This work is
Module 10 Data-action models
 Introduction Geo-Information Science Practical Manual Module 10 Data-action models 10. INTRODUCTION 10-1 DESIGNING A DATA-ACTION MODEL 10-2 REPETITION EXERCISES 10-6 10. Introduction Until now you have
17/07/2013 RASTER DATA STRUCTURE GIS LECTURE 4 GIS DATA MODELS AND STRUCTURES RASTER DATA MODEL& STRUCTURE TIN- TRIANGULAR IRREGULAR NETWORK
 RASTER DATA STRUCTURE GIS LECTURE 4 GIS DATA MODELS AND STRUCTURES Space is subdivided into regular grids of square grid cells or other forms of polygonal meshes known as picture elements (pixels) the
Practical Manual. Introduction Geo information Science (GRS 10306) B. Kempen, W.TH. ten Haaf (Ed.)
 B. Kempen, W.TH. ten Haaf (Ed.)") Laboratory of Geographical Information Science and Remote Sensing Centre for Geo Information Introduction Geo information Science (GRS 10306) Practical Manual B. Kempen, W.TH. ten Haaf (Ed.) September
Laboratory of Geographical Information Science and Remote Sensing Centre for Geo Information Introduction Geo information Science (GRS 10306) Practical Manual B. Kempen, W.TH. ten Haaf (Ed.) September
ii. From the Tools menu choose Multi-Extract
 Created By: Grant J. Firl Advisors: Paul Evangelista, Jim Graham Date: November 2010 Software: ArcGIS v9.2, TUGZip v3.5 Lesson 8: Mosaicking and Clipping Landsat Data The purpose of this tutorial is to
Working with Map Algebra
 Working with Map Algebra While you can accomplish much with the Spatial Analyst user interface, you can do even more with Map Algebra, the analysis language of Spatial Analyst. Map Algebra expressions
GIS Workbook #1. GIS Basics and the ArcGIS Environment. Helen Goodchild
 GIS Basics and the ArcGIS Environment Helen Goodchild Overview of Geographic Information Systems Geographical Information Systems (GIS) are used to display, manipulate and analyse spatial data (data that
Search & Rescue Map Specifications and Production Workflows
 Search & Rescue Map Specifications and Production Workflows About The Search & Rescue map product and production procedures discussed in this document can be utilized to support search, rescue, and relief
BAEN 673 Biological and Agricultural Engineering Department Texas A&M University ArcSWAT / ArcGIS 10.1 Example 2
 Before you Get Started BAEN 673 Biological and Agricultural Engineering Department Texas A&M University ArcSWAT / ArcGIS 10.1 Example 2 1. Open ArcCatalog Connect to folder button on tool bar navigate
Layer Variables for RSF-type Modelling Applications
 Layer Variables for RSF-type Modelling Applications These instructions for ArcGIS 9.x enable you to create expressions for use in Spatial Analyst s Raster Calculator that result in output grids of continuous
ArcMap - EXPLORING THE DATABASE Part I. SPATIAL DATA FORMATS Part II
 Week 5 ArcMap - EXPLORING THE DATABASE Part I SPATIAL DATA FORMATS Part II topics of the week Exploring the Database More on the Table of Contents Exploration tools Identify, Find, Measure, Map tips, Hyperlink,
How does Map Algebra work?
 Map Algebra How does Map Algebra work? Map Algebra uses math-like expressions containing operators and functions with raster data. Map Algebra operators, which are relational, Boolean, logical, combinatorial,
GEOG 487 Lesson 8: Step-by-Step Activity
 GEOG 487 Lesson 8: Step-by-Step Activity Part I: Review the Relevant Data Layers and Organize the Map Document In Part I, we will review the starting datasets and organize the map document for analysis.
GIS IN ECOLOGY: MORE RASTER ANALYSES
 GIS IN ECOLOGY: MORE RASTER ANALYSES Contents Introduction... 2 More Raster Application Functions... 2 Data Sources... 3 Tasks... 4 Raster Recap... 4 Viewshed Determining Visibility... 5 Hydrology Modeling
Geographic Information Systems (GIS) Spatial Analyst [10] Dr. Mohammad N. Almasri. [10] Spring 2018 GIS Dr. Mohammad N. Almasri Spatial Analyst
![Geographic Information Systems (GIS) Spatial Analyst [10] Dr. Mohammad N. Almasri. [10] Spring 2018 GIS Dr. Mohammad N. Almasri Spatial Analyst](/thumbs/80/81171101.jpg "Geographic Information Systems (GIS) Spatial Analyst [10] Dr. Mohammad N. Almasri. [10] Spring 2018 GIS Dr. Mohammad N. Almasri Spatial Analyst") Geographic Information Systems (GIS) Spatial Analyst [10] Dr. Mohammad N. Almasri 1 Preface POINTS, LINES, and POLYGONS are good at representing geographic objects with distinct shapes They are less good
Geographic Information Systems (GIS) Spatial Analyst [10] Dr. Mohammad N. Almasri 1 Preface POINTS, LINES, and POLYGONS are good at representing geographic objects with distinct shapes They are less good
A Hands-on Experience with Arc/Info 8 Desktop
 Demo of Arc/Info 8 Desktop page 1 of 17 A Hands-on Experience with Arc/Info 8 Desktop Prepared by Xun Shi and Ted Quinby Geography 377 December 2000 In this DEMO, we introduce a brand new edition of ArcInfo,
Map Library ArcView Version 1 02/20/03 Page 1 of 12. ArcView GIS
 Map Library ArcView Version 1 02/20/03 Page 1 of 12 1. Introduction 1 ArcView GIS ArcView is the most popular desktop GIS analysis and map presentation software package.. With ArcView GIS you can create
Exercise # 6: Using the NHDPlus Raster Data Sets Last Updated 3/28/2006
 Exercise # 6: Using the NHDPlus Raster Data Sets Last Updated 3/28/2006 The NHDPlus includes several raster (grid) data sets. Several of these are primarily used in analytical processes that are beyond
ARIS Grid & Raster Editor for ArcMap 10 User's Manual
 ARIS Grid & Raster Editor for ArcMap 10 User's Manual 14 February 2018 ARIS B.V. http://www.aris.nl/ helpdesk@aris.nl Table of contents 1. Introduction...4 2. Installation...5 2.1 Requirements...5 2.2
New Media in Landscape Architecture: Advanced GIS
 New Media in Landscape Architecture: Advanced GIS - Projections and Transformations - Version 10.2, English ANHALT UNIVERSITY OF APPLIED SCIENCES Hochschule Anhalt Author: Dr. Matthias Pietsch Tutorial-Version:
Delineating Watersheds from a Digital Elevation Model (DEM)
") Delineating Watersheds from a Digital Elevation Model (DEM) (Using example from the ESRI virtual campus found at http://training.esri.com/courses/natres/index.cfm?c=153) Download locations for additional
Delineating Watersheds from a Digital Elevation Model (DEM) (Using example from the ESRI virtual campus found at http://training.esri.com/courses/natres/index.cfm?c=153) Download locations for additional
Steps for Modeling a Proposed New Reservoir in GIS
 Steps for Modeling a Proposed New Reservoir in GIS Requirements: ArcGIS ArcMap, ArcScene, Spatial Analyst, and 3D Analyst There s a new reservoir proposed for Right Hand Fork in Logan Canyon. I wanted
Notes: Notes: Notes: Notes:
 NR406 GIS Applications in Fire Ecology & Management Lesson 2 - Overlay Analysis in GIS Gathering Information from Multiple Data Layers One of the many strengths of a GIS is that you can stack several data
Terms and definitions * keep definitions of processes and terms that may be useful for tests, assignments
 Lecture 1 Core of GIS Thematic layers Terms and definitions * keep definitions of processes and terms that may be useful for tests, assignments Lecture 2 What is GIS? Info: value added data Data to solve
The Reference Library Generating Low Confidence Polygons
 GeoCue Support Team In the new ASPRS Positional Accuracy Standards for Digital Geospatial Data, low confidence areas within LIDAR data are defined to be where the bare earth model might not meet the overall
GIS OPERATION MANUAL
 GIS OPERATION MANUAL 1. Computer System Description Hardware Make Compaq Presario 5004 CPU AMD Athlon 1.1 Ghz Main Memory 640MB CD-ROM 52 X CD-RW 8 X HD 57GB Monitor 19 inch Video Adapter 16 Mb Nvidia
Longley Chapter 3. Representations
 Longley Chapter 3 Digital Geographic Data Representation Geographic Data Type Data Models Representing Spatial and Temporal Data Attributes The Nature of Geographic Data Representations Are needed to convey
Raster Analysis and Functions. David Tenenbaum EEOS 465 / 627 UMass Boston
 Raster Analysis and Functions Local Functions By-cell operations Operated on by individual operators or by coregistered grid cells from other themes Begin with each target cell, manipulate through available
Raster Data. James Frew ESM 263 Winter
 Raster Data 1 Vector Data Review discrete objects geometry = points by themselves connected lines closed polygons agributes linked to feature ID explicit localon every point has coordinates 2 Fields in
GEO 465/565 Lab 6: Modeling Landslide Susceptibility
 1 GEO 465/565 Lab 6: Modeling Landslide Susceptibility This lab will give you more practice in understanding and building a GIS analysis model. Recall from class lecture that a GIS analysis model is a
Review of Cartographic Data Types and Data Models
 Review of Cartographic Data Types and Data Models GIS Data Models Raster Versus Vector in GIS Analysis Fundamental element used to represent spatial features: Raster: pixel or grid cell. Vector: x,y coordinate
Tutorial 1: Downloading elevation data
 Tutorial 1: Downloading elevation data Objectives In this exercise you will learn how to acquire elevation data from the website OpenTopography.org, project the dataset into a UTM coordinate system, and
Geographical Information Systems Institute. Center for Geographic Analysis, Harvard University. LAB EXERCISE 1: Basic Mapping in ArcMap
 Harvard University Introduction to ArcMap Geographical Information Systems Institute Center for Geographic Analysis, Harvard University LAB EXERCISE 1: Basic Mapping in ArcMap Individual files (lab instructions,
Exercise 4 Compiling a Spatial Database: Adding and Linking Attribute Data
 Geog, IES 377/Cee 357 Exercise 4 Page: 1/9 GEOG 377/CEE 357: An Introduction to Geographic Information Systems Exercise 4 Compiling a Spatial Database: Adding and Linking Attribute Data 1. Introduction