Beyond the Assumption of Constant Hazard Rate in Estimating Incidence Rate on Current Status Data with Applications to Phase IV Cancer Trial
|
|
|
- Miles Simon Francis
- 5 years ago
- Views:
Transcription
1 Beyond the Assumption of Constant Hazard Rate in Estimating Incidence Rate on Current Status Data with Applications to Phase IV Cancer Trial Deokumar Srivastava, Ph.D. Member Department of Biostatistics St. Jude Children s Research Hospital Society for Clinical Trials May 17-20, 2015 Joint work with Liang Zhu, Melissa Hudson, Jianmin Pan, and Shesh N Rai

2 Outline Motivating Example Statistical Methodology Simulation and Application Conclusion
3 Motivating Example Hudson et al. (2007), JCO, Noninvasive evaluation of late anthracycline cardiac toxicity in childhood cancer survivors (CCS) CCS treated with anthracylcines and cardiac radiation are at increased risk for late onset of cardiac toxicity. Not feasible to evaluate patients frequently on a long term basis to obtain the data. Only the current status of the patient with onset prior to current status. Risk Groups: At Risk: treated with cardiotoxic therapy Not at Risk: Did not receive cardiotoxic therapy
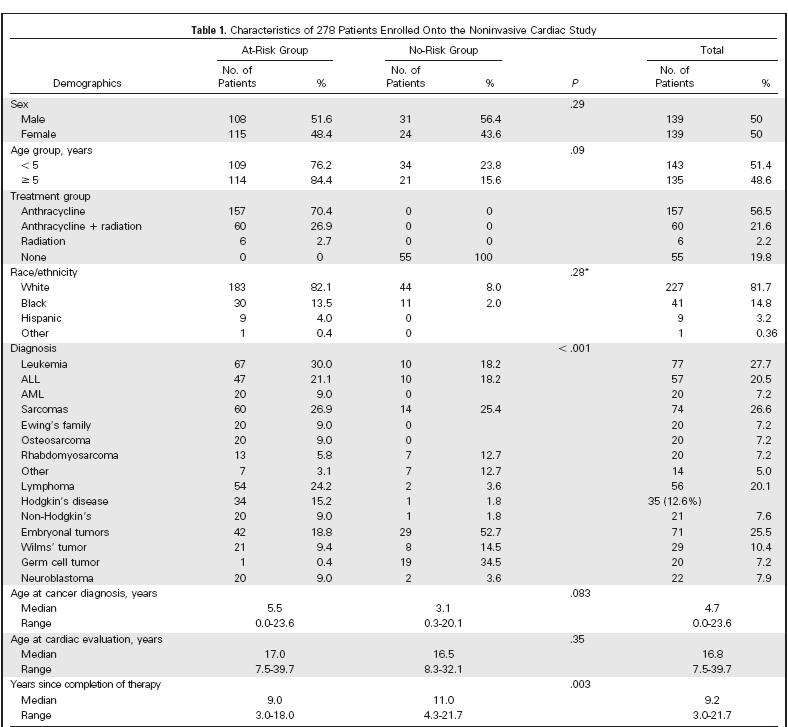
4 Description of Data
5 Cardiac Toxicity Measures Fractional Shortening (SF): Left ventricular systolic performance Abnormal if SF < 0.28 Afterload (AF): Left ventricular endsystolic wall stress Abnormal if AF > 74 g/cm 2
6 Statistical Problem To estimate the cumulative incidence and confidence intervals.
7 Interval Censored Data Interval Censored Data Instead of observing the exact time (T) of the event it is known that the event occurred in the interval (L,R] Current Status Data (Case I, ICD) Either L=0 or R=, that is either left- or right-censored General or Case II ICD At least one with both L and R (0, ) that is, include at least one finite interval away from zero.
8 General Model X(t) state occupied by a survivor at time t T Observation time to death, cardiac failure or survey U Time to cardiac abnormality Alive with No Cardiac abnormality 1 1 (u) (u) 1 3 Alive with Cardiac abnormality 3 (t u) The intensities 1 (u), 2 (u), and 3 (t u) are transition rates Death/Cardiac Failure
9 Psuedo Survival Functions The pseudo survival functions corresponding to 1 (u), 2 (u), and 3 (t u) are: t Q i t = exp i ( 0 v dv} for i=1,2 t Q 3 t u = exp { 3 v u dv} 0 t Q t = exp 1 v + 2 (v) 0 dv = Q 1 (t)q 2 (t) The probability that the time to the first event alive with abnormal value or death with normal value exceeds t.
10 Likelihood Construction t Interest in estimating Λ 1 t = 1 u du 0 cumulative incidence function., the
11 Likelihood Function The likelihood function is n L θ = {a i logl 1 t i + b i logl 2 t i + c i logl 3 t i i=1 + d i logl 4 (t i )} where a i = δ i 1 γ i, b i = (1 δ i ) 1 γ i, c i = δ i γ i, and d i = (1 δ i )γ i are the indicators corresponding to observation types 1 to 4
12 Analysis using Piecewise Exponential Model Rai et al. (2013) conducted the analysis assuming exponential and piecewise exponential distribution. Assumed 1 to be piecewise exponential with parameters 11 for t < t c (2-years or 5-years) and 12 for t t c. One has to know the number and location of change points One has to assume that the intensity function is constant within each period. These assumptions are hard to justify in practice and an alternative approach free of these assumptions would be preferable.
13 Analysis using Weibull Model The likelihood based on Weibull distribution for the special case 2 = 3 = 0 and a i = c i = 0 can be represented as, n log L 1, α 1 = b i 1 t α 1 i i=1 + n i=1 d i log 1 exp ( 1 t i α 1 ) The maximum likelihood estimates can be obtained by solving the likelihood equations obtained by taking the derivative of the log-likelihood with respect to the parameters and equating them to zero.
14 Simulation Study Setting I: Data generated from piecewise exponential and the estimates were obtained using piecewise exponential and Weibull distributions. Setting II: Data generated from two different Weibull distribution to mimic slow increasing hazard and rapidly increasing hazard and once again the estimates of CI were obtained Weibull and piecewise exponential distributions. Setting III: Data was generated from piecewise exponential as in Setting 1 but the change point was assumed to be at t-1, t and t+1 years.
15 Performance of Weibull Model for the data generated from piecewise Exponential Distribution with 11 = 0.15 and 12 = 0.4 (n=400) Follow-up time/change point Time True Piecewise Exponential Weibull CI CI (SE) CI (SE) 10 years/ 2 year (0.03) 0.14 (0.03) (0.05) 0.32 (0.04) (0.03) 0.50 (0.04) (0.03) 0.65 (0.03) (0.03) 0.76 (0.03) (0.02) 0.84 (0.02) (0.02) 0.90 (0.02) (0.02) 0.94 (0.02) (0.01) 0.96 (0.01) (0.01) 0.98 (0.01) 10 years/ 5 year (0.02) 0.10 (0.03) (0.03) 0.24 (0.03) (0.03) 0.38 (0.03) (0.04) 0.50 (0.03) (0.04) 0.61 (0.03) (0.03) 0.70 (0.03) (0.03) 0.78 (0.03) (0.03) 0.83 (0.03) (0.03) 0.88 (0.03) (0.02) 0.91 (0.02)
16 Performance of Piecewise Exponential with three assumed change points (a), (b) and (c) for the data generated from Weibull distributions corresponding to Cases A and B with 10 year follow-up and sample size n=400 Cases * time True Weibull Piecewise Exponetial (a) ** Piecewise Exponetial (b) ** Piecewise Exponetial (c) ** CI CI (SE) CI (SE) CI (SE) CI (SE) A (0.02) 0.03 (0.03) 0.06 (0.02) 0.09 (0.02) (0.03) 0.22 (0.02) 0.12 (0.04) 0.17 (0.03) (0.03) 0.37 (0.02) 0.32 (0.03) 0.24 (0.05) (0.03) 0.49 (0.03) 0.47 (0.03) 0.43 (0.03) (0.03) 0.59 (0.03) 0.59 (0.03) 0.58 (0.03) (0.03) 0.67 (0.03) 0.68 (0.03) 0.68 (0.03) (0.03) 0.74 (0.03) 0.75 (0.03) 0.76 (0.03) (0.03) 0.79 (0.03) 0.81 (0.03) 0.82 (0.03) (0.03) 0.83 (0.02) 0.85 (0.02) 0.87 (0.03) (0.02) 0.86 (0.02) 0.88 (0.02) 0.90 (0.02) B (0.01) 0.10 (0.02) 0.04 (0.02) 0.14 (0.01) (0.03) 0.18 (0.03) 0.07 (0.03) 0.26 (0.02) (0.04) 0.26 (0.04) 0.35 (0.02) 0.36 (0.03) (0.04) 0.33 (0.05) 0.54 (0.03) 0.45 (0.04) (0.03) 0.61 (0.03) 0.68 (0.03) 0.52 (0.04) (0.03) 0.78 (0.03) 0.77 (0.03) 0.59 (0.04) (0.02) 0.87 (0.02) 0.84 (0.02) 0.83 (0.03) (0.02) 0.92 (0.02) 0.89 (0.02) 0.93 (0.02) (0.01) 0.95 (0.01) 0.92 (0.02) 0.97 (0.01) (0.01) 0.97 (0.01) 0.94 (0.01) 0.99 (0.01)
17 Performance of Weibull Model and Piecewise Exponential Distribution for varying change points when the data is generated from piecewise Exponential Distribution with 11 = 0.15 and 12 = 0.4 (n=400) Follow-up time/change point Time True Weibull Piecewise Exponetial (a) ** Piecewise Exponetial (b) ** Piecewise Exponetial (c) ** 10 years/ 2 year (0.03) 0.10 (0.04) 0.14 (0.03) 0.17 (0.03) (0.04) 0.36 (0.03) 0.26 (0.05) 0.32 (0.04) (0.04) 0.55 (0.03) 0.51 (0.03) 0.44 (0.05) (0.03) 0.68 (0.03) 0.67 (0.03) 0.64 (0.03) (0.03) 0.77 (0.02) 0.78 (0.03) 0.77 (0.03) (0.02) 0.84 (0.02) 0.85 (0.02) 0.85 (0.02) (0.02) 0.89 (0.02) 0.90 (0.02) 0.90 (0.02) (0.02) 0.92 (0.02) 0.93 (0.02) 0.94 (0.02) (0.01) 0.94 (0.01) 0.95 (0.01) 0.96 (0.01) (0.01) 0.96 (0.01) 0.97 (0.01) 0.97 (0.01) 10 years/ 5 year (0.03) 0.13 (0.02) 0.14 (0.02) 0.15 (0.01) (0.03) 0.25 (0.03) 0.26 (0.03) 0.27 (0.02) (0.03) 0.35 (0.04) 0.36 (0.03) 0.38 (0.03) (0.03) 0.43 (0.04) 0.45 (0.04) 0.47 (0.03) (0.03) 0.59 (0.03) 0.53 (0.04) 0.55 (0.04) (0.03) 0.71 (0.03) 0.69 (0.03) 0.62 (0.04) (0.03) 0.79 (0.03) 0.79 (0.03) 0.77 (0.03) (0.03) 0.85 (0.03) 0.86 (0.03) 0.86 (0.03) (0.03) 0.89 (0.02) 0.90 (0.03) 0.91 (0.03) (0.02) 0.92 (0.02) 0.94 (0.02) 0.96 (0.02)
18 Application to AAF data Nonparam etric Weibull Exp-1 Exp-2 Year CI CI SE CI SE CI SE
19 Application to AAF data
20 Conclusions An alternative to piecewise exponential distribution for modeling CI for the current status data. Proposed the use of Weibull distribution which overcomes the limitations inherent with piecewise exponential approach. Assuming the location of cut-points Deciding on the number of cut-points Assuming the constant hazard within each time period. The simulations and applications suggest that the proposed approach is reasonable and provides for a viable alternative to modeling current status data.
21 Future Work 34 observations missing in AF and 6 in both AF and FS. Imputation approach to provide more efficient estimates of the CI Manuscript evaluating the performance of imputation is currently under review in Statistical Methods in Medical Research. AF is often evaluated as a continuous measure and FS is evaluated as a binary measure (normal/abnormal) Both are correlated (Joint modeling is appropriate and needed) We are working on a manuscript that compares the Bayesian and frequentist approaches for evaluating treatment effect with mixed endpoints.

22 Thank You!?
Package simsurv. May 18, 2018
 Type Package Title Simulate Survival Data Version 0.2.2 Date 2018-05-18 Package simsurv May 18, 2018 Maintainer Sam Brilleman Description Simulate survival times from standard
Project Paper Introduction
 Project Paper Introduction Tracey Marsh Group Health Research Institute University of Washington, Department of Biostatistics Paper Estimating and Projecting Trends in HIV/AIDS Generalized Epidemics Using
A GENERAL GIBBS SAMPLING ALGORITHM FOR ANALYZING LINEAR MODELS USING THE SAS SYSTEM
 A GENERAL GIBBS SAMPLING ALGORITHM FOR ANALYZING LINEAR MODELS USING THE SAS SYSTEM Jayawant Mandrekar, Daniel J. Sargent, Paul J. Novotny, Jeff A. Sloan Mayo Clinic, Rochester, MN 55905 ABSTRACT A general
Assessing the Quality of the Natural Cubic Spline Approximation
 Assessing the Quality of the Natural Cubic Spline Approximation AHMET SEZER ANADOLU UNIVERSITY Department of Statisticss Yunus Emre Kampusu Eskisehir TURKEY ahsst12@yahoo.com Abstract: In large samples,
Model-based Recursive Partitioning for Subgroup Analyses
 EBPI Epidemiology, Biostatistics and Prevention Institute Model-based Recursive Partitioning for Subgroup Analyses Torsten Hothorn; joint work with Heidi Seibold and Achim Zeileis 2014-12-03 Subgroup analyses
TTEDesigner User s Manual
 TTEDesigner User s Manual John D. Cook Department of Biostatistics, Box 447 The University of Texas, M. D. Anderson Cancer Center 1515 Holcombe Blvd., Houston, Texas 77030, USA cook@mdanderson.org September
Nested Sampling: Introduction and Implementation
 UNIVERSITY OF TEXAS AT SAN ANTONIO Nested Sampling: Introduction and Implementation Liang Jing May 2009 1 1 ABSTRACT Nested Sampling is a new technique to calculate the evidence, Z = P(D M) = p(d θ, M)p(θ
Scalable Bayes Clustering for Outlier Detection Under Informative Sampling
 Scalable Bayes Clustering for Outlier Detection Under Informative Sampling Based on JMLR paper of T. D. Savitsky Terrance D. Savitsky Office of Survey Methods Research FCSM - 2018 March 7-9, 2018 1 / 21
Package rereg. May 30, 2018
 Title Recurrent Event Regression Version 1.1.4 Package rereg May 30, 2018 A collection of regression models for recurrent event process and failure time. Available methods include these from Xu et al.
Optimal designs for comparing curves
 Optimal designs for comparing curves Holger Dette, Ruhr-Universität Bochum Maria Konstantinou, Ruhr-Universität Bochum Kirsten Schorning, Ruhr-Universität Bochum FP7 HEALTH 2013-602552 Outline 1 Motivation
PART III APPLICATIONS
 S. Vieira PART III APPLICATIONS Fuzz IEEE 2013, Hyderabad India 1 Applications Finance Value at Risk estimation based on a PFS model for density forecast of a continuous response variable conditional on
Bayes Factor Single Arm Binary User s Guide (Version 1.0)
") Bayes Factor Single Arm Binary User s Guide (Version 1.0) Department of Biostatistics P. O. Box 301402, Unit 1409 The University of Texas, M. D. Anderson Cancer Center Houston, Texas 77230-1402, USA November
Bayes Factor Single Arm Binary User s Guide (Version 1.0) Department of Biostatistics P. O. Box 301402, Unit 1409 The University of Texas, M. D. Anderson Cancer Center Houston, Texas 77230-1402, USA November
On the Parameter Estimation of the Generalized Exponential Distribution Under Progressive Type-I Interval Censoring Scheme
 arxiv:1811.06857v1 [math.st] 16 Nov 2018 On the Parameter Estimation of the Generalized Exponential Distribution Under Progressive Type-I Interval Censoring Scheme Mahdi Teimouri Email: teimouri@aut.ac.ir
Interactive Treatment Planning in Cancer Radiotherapy
 Interactive Treatment Planning in Cancer Radiotherapy Mohammad Shakourifar Giulio Trigila Pooyan Shirvani Ghomi Abraham Abebe Sarah Couzens Laura Noreña Wenling Shang June 29, 212 1 Introduction Intensity
Package DSBayes. February 19, 2015
 Type Package Title Bayesian subgroup analysis in clinical trials Version 1.1 Date 2013-12-28 Copyright Ravi Varadhan Package DSBayes February 19, 2015 URL http: //www.jhsph.edu/agingandhealth/people/faculty_personal_pages/varadhan.html
Frequentist and Bayesian Interim Analysis in Clinical Trials: Group Sequential Testing and Posterior Predictive Probability Monitoring Using SAS
 MWSUG 2016 - Paper PH06 Frequentist and Bayesian Interim Analysis in Clinical Trials: Group Sequential Testing and Posterior Predictive Probability Monitoring Using SAS Kechen Zhao, University of Southern
Monte Carlo Hospital
 Monte Carlo Hospital Let s take a break from springs and things. This model will be inspired by a paper by Schmitz and Kwak [1972]. When a hospital decides to increase the number of beds administrators
STATISTICS (STAT) 200 Level Courses. 300 Level Courses. Statistics (STAT) 1
 200 Level Courses. 300 Level Courses. Statistics (STAT) 1") Statistics (STAT) 1 STATISTICS (STAT) 200 Level Courses STAT 250: Introductory Statistics I. 3 credits. Elementary introduction to statistics. Topics include descriptive statistics, probability, and estimation
Statistics (STAT) 1 STATISTICS (STAT) 200 Level Courses STAT 250: Introductory Statistics I. 3 credits. Elementary introduction to statistics. Topics include descriptive statistics, probability, and estimation
Fast Calculation of Calendar Time-, Ageand Duration Dependent Time at Risk in the Lexis Space
 Fast Calculation of Calendar Time-, Ageand Duration Dependent Time at Risk in the Lexis Space arxiv:1204.0798v1 [stat.me] 3 Apr 2012 Ralph Brinks Institute for Biometry and Epidemiology German Diabetes
Dose Distributions. Purpose. Isodose distributions. To familiarize the resident with dose distributions and the factors that affect them
 Dose Distributions George Starkschall, Ph.D. Department of Radiation Physics U.T. M.D. Anderson Cancer Center Purpose To familiarize the resident with dose distributions and the factors that affect them
Package FHtest. November 8, 2017
 Type Package Package FHtest November 8, 2017 Title Tests for Right and Interval-Censored Survival Data Based on the Fleming-Harrington Class Version 1.4 Date 2017-11-8 Author Ramon Oller, Klaus Langohr
Inclusion of Aleatory and Epistemic Uncertainty in Design Optimization
 10 th World Congress on Structural and Multidisciplinary Optimization May 19-24, 2013, Orlando, Florida, USA Inclusion of Aleatory and Epistemic Uncertainty in Design Optimization Sirisha Rangavajhala
Bayesian Inference for Sample Surveys
 Bayesian Inference for Sample Surveys Trivellore Raghunathan (Raghu) Director, Survey Research Center Professor of Biostatistics University of Michigan Distinctive features of survey inference 1. Primary
Estimating survival from Gray s flexible model. Outline. I. Introduction. I. Introduction. I. Introduction
 Estimating survival from s flexible model Zdenek Valenta Department of Medical Informatics Institute of Computer Science Academy of Sciences of the Czech Republic I. Introduction Outline II. Semi parametric
idem: Inference in Randomized Controlled Trials with Death a... Missingness
 idem: Inference in Randomized Controlled Trials with Death and Missingness Chenguang Wang Introduction 2016-07-04 In randomized studies involving severely ill patients, functional outcomes are often unobserved
The Bootstrap and Jackknife
 The Bootstrap and Jackknife Summer 2017 Summer Institutes 249 Bootstrap & Jackknife Motivation In scientific research Interest often focuses upon the estimation of some unknown parameter, θ. The parameter
Unified Methods for Censored Longitudinal Data and Causality
 Mark J. van der Laan James M. Robins Unified Methods for Censored Longitudinal Data and Causality Springer Preface v Notation 1 1 Introduction 8 1.1 Motivation, Bibliographic History, and an Overview of
STATISTICS (STAT) 200 Level Courses Registration Restrictions: STAT 250: Required Prerequisites: not Schedule Type: Mason Core: STAT 346:
 200 Level Courses Registration Restrictions: STAT 250: Required Prerequisites: not Schedule Type: Mason Core: STAT 346:") Statistics (STAT) 1 STATISTICS (STAT) 200 Level Courses STAT 250: Introductory Statistics I. 3 credits. Elementary introduction to statistics. Topics include descriptive statistics, probability, and estimation
Statistics (STAT) 1 STATISTICS (STAT) 200 Level Courses STAT 250: Introductory Statistics I. 3 credits. Elementary introduction to statistics. Topics include descriptive statistics, probability, and estimation
Package sp23design. R topics documented: February 20, Type Package
 Type Package Package sp23design February 20, 2015 Title Design and Simulation of seamless Phase II-III Clinical Trials Version 0.9 Date 2012-01-01 Author Balasubramanian Narasimhan [aut, cre], Mei-Chiung
Standard error estimation in the EM algorithm when joint modeling of survival and longitudinal data
 Biostatistics (2014), 0, 0, pp. 1 24 doi:10.1093/biostatistics/mainmanuscript Standard error estimation in the EM algorithm when joint modeling of survival and longitudinal data Cong Xu, Paul D. Baines
Treatment Planning Optimization for VMAT, Tomotherapy and Cyberknife
 Treatment Planning Optimization for VMAT, Tomotherapy and Cyberknife Kerem Akartunalı Department of Management Science Strathclyde Business School Joint work with: Vicky Mak-Hau and Thu Tran 14 July 2015
100 Myung Hwan Na log-hazard function. The discussion section of Abrahamowicz, et al.(1992) contains a good review of many of the papers on the use of
 contains a good review of many of the papers on the use of") J. KSIAM Vol.3, No.2, 99-106, 1999 SPLINE HAZARD RATE ESTIMATION USING CENSORED DATA Myung Hwan Na Abstract In this paper, the spline hazard rate model to the randomly censored data is introduced. The
J. KSIAM Vol.3, No.2, 99-106, 1999 SPLINE HAZARD RATE ESTIMATION USING CENSORED DATA Myung Hwan Na Abstract In this paper, the spline hazard rate model to the randomly censored data is introduced. The
Working with Composite Endpoints: Constructing Analysis Data Pushpa Saranadasa, Merck & Co., Inc., Upper Gwynedd, PA
 PharmaSug2016- Paper HA03 Working with Composite Endpoints: Constructing Analysis Data Pushpa Saranadasa, Merck & Co., Inc., Upper Gwynedd, PA ABSTRACT A composite endpoint in a Randomized Clinical Trial
Appendix A: An Alternative Estimation Procedure Dual Penalized Expansion
 Supplemental Materials for Functional Linear Models for Zero-Inflated Count Data with Application to Modeling Hospitalizations in Patients on Dialysis by Şentürk, D., Dalrymple, L. S. and Nguyen, D. V.
Statistical Analysis Using Combined Data Sources: Discussion JPSM Distinguished Lecture University of Maryland
 Statistical Analysis Using Combined Data Sources: Discussion 2011 JPSM Distinguished Lecture University of Maryland 1 1 University of Michigan School of Public Health April 2011 Complete (Ideal) vs. Observed
A Comparison of Modeling Scales in Flexible Parametric Models. Noori Akhtar-Danesh, PhD McMaster University
 A Comparison of Modeling Scales in Flexible Parametric Models Noori Akhtar-Danesh, PhD McMaster University Hamilton, Canada daneshn@mcmaster.ca Outline Backgroundg A review of splines Flexible parametric
STATISTICS (STAT) Statistics (STAT) 1
 Statistics (STAT) 1") Statistics (STAT) 1 STATISTICS (STAT) STAT 2013 Elementary Statistics (A) Prerequisites: MATH 1483 or MATH 1513, each with a grade of "C" or better; or an acceptable placement score (see placement.okstate.edu).
Statistics (STAT) 1 STATISTICS (STAT) STAT 2013 Elementary Statistics (A) Prerequisites: MATH 1483 or MATH 1513, each with a grade of "C" or better; or an acceptable placement score (see placement.okstate.edu).
Statistical Matching using Fractional Imputation
 Statistical Matching using Fractional Imputation Jae-Kwang Kim 1 Iowa State University 1 Joint work with Emily Berg and Taesung Park 1 Introduction 2 Classical Approaches 3 Proposed method 4 Application:
CHAPTER 1 INTRODUCTION
 Introduction CHAPTER 1 INTRODUCTION Mplus is a statistical modeling program that provides researchers with a flexible tool to analyze their data. Mplus offers researchers a wide choice of models, estimators,
Converting Fractions to Decimals
 Converting Fractions to Decimals There is a close relationship between fractions and decimals. In fact, fractions and decimals are just two different ways of writing numbers. For example, consider and
Pooling Clinical Data: Key points and Pitfalls. October 16, 2012 Phuse 2012 conference, Budapest Florence Buchheit
 Pooling Clinical Data: Key points and Pitfalls October 16, 2012 Phuse 2012 conference, Budapest Florence Buchheit Introduction Are there any pre-defined rules to pool clinical data? Are there any pre-defined
in this course) ˆ Y =time to event, follow-up curtailed: covered under ˆ Missing at random (MAR) a
 ˆ Y =time to event, follow-up curtailed: covered under ˆ Missing at random (MAR) a") Chapter 3 Missing Data 3.1 Types of Missing Data ˆ Missing completely at random (MCAR) ˆ Missing at random (MAR) a ˆ Informative missing (non-ignorable non-response) See 1, 38, 59 for an introduction to
Chapter 3 Missing Data 3.1 Types of Missing Data ˆ Missing completely at random (MCAR) ˆ Missing at random (MAR) a ˆ Informative missing (non-ignorable non-response) See 1, 38, 59 for an introduction to
Module I: Clinical Trials a Practical Guide to Design, Analysis, and Reporting 1. Fundamentals of Trial Design
 Module I: Clinical Trials a Practical Guide to Design, Analysis, and Reporting 1. Fundamentals of Trial Design Randomized the Clinical Trails About the Uncontrolled Trails The protocol Development The
Package bayesdp. July 10, 2018
 Type Package Package bayesdp July 10, 2018 Title Tools for the Bayesian Discount Prior Function Version 1.3.2 Date 2018-07-10 Depends R (>= 3.2.3), ggplot2, survival, methods Functions for data augmentation
OPTIMIZATION OF RELIABILITY VERIFICATION TEST STRATEGIES
 OPTIMIZATION OF RELIABILITY VERIFICATION TEST STRATEGIES SUMMARY Reliability verification can be time consuming and expensive, especially for highly reliable products. This paper presents a method for
AWELL-KNOWN technique for choosing a probability
 248 IEEE TRANSACTIONS ON RELIABILITY VOL 57 NO 2 JUNE 2008 Parametric Model Discrimination for Heavily Censored Survival Data A Daniel Block and Lawrence M Leemis Abstract Simultaneous discrimination among
Visualizing NCI Seer Cancer Data
 Visualizing NCI Seer Cancer Data Sandro Fouché Thursday, March 3, 2005 CMSC 838s Introduction I chose to use the National Cancer Institute s Surveillance, Epidemiology and End Results (NCI SEER) database
Extensions to the Cox Model: Stratification
 Extensions to the Cox Model: Stratification David M. Rocke May 30, 2017 David M. Rocke Extensions to the Cox Model: Stratification May 30, 2017 1 / 13 Anderson Data Remission survival times on 42 leukemia
Missing Data and Imputation
 Missing Data and Imputation NINA ORWITZ OCTOBER 30 TH, 2017 Outline Types of missing data Simple methods for dealing with missing data Single and multiple imputation R example Missing data is a complex
Package PTE. October 10, 2017
 Type Package Title Personalized Treatment Evaluator Version 1.6 Date 2017-10-9 Package PTE October 10, 2017 Author Adam Kapelner, Alina Levine & Justin Bleich Maintainer Adam Kapelner
The partial Package. R topics documented: October 16, Version 0.1. Date Title partial package. Author Andrea Lehnert-Batar
 The partial Package October 16, 2006 Version 0.1 Date 2006-09-21 Title partial package Author Andrea Lehnert-Batar Maintainer Andrea Lehnert-Batar Depends R (>= 2.0.1),e1071
Correctly Compute Complex Samples Statistics
 PASW Complex Samples 17.0 Specifications Correctly Compute Complex Samples Statistics When you conduct sample surveys, use a statistics package dedicated to producing correct estimates for complex sample
Data exchange between remote monitoring databases and local electronic patient record system Implementation based on international standards
 Data exchange between remote monitoring databases and local electronic patient record system Implementation based on international standards Enno T. Van der Velde, FESC Medical Physicist, dept of Cardiology
CHAPTER 7 EXAMPLES: MIXTURE MODELING WITH CROSS- SECTIONAL DATA
 Examples: Mixture Modeling With Cross-Sectional Data CHAPTER 7 EXAMPLES: MIXTURE MODELING WITH CROSS- SECTIONAL DATA Mixture modeling refers to modeling with categorical latent variables that represent
DESIGN AND REALISATION OF A FRAMEWORK FOR DEVICE ENDCOMMUNICATION ACCORDING TO THE IEEE STANDARD
 DESIGN AND REALISATION OF A FRAMEWORK FOR DEVICE ENDCOMMUNICATION ACCORDING TO THE IEEE 11073-20601 STANDARD Frohner M 1, Urbauer P 1, Bauer M 1, Gerbovics F 1, Mense A 2, Sauermann S 1 Abstract The standardization
Dose Calculation and Optimization Algorithms: A Clinical Perspective
 Dose Calculation and Optimization Algorithms: A Clinical Perspective Daryl P. Nazareth, PhD Roswell Park Cancer Institute, Buffalo, NY T. Rock Mackie, PhD University of Wisconsin-Madison David Shepard,
Illumination. Michael Kazhdan ( /657) HB Ch. 14.1, 14.2 FvDFH 16.1, 16.2
 HB Ch. 14.1, 14.2 FvDFH 16.1, 16.2") Illumination Michael Kazhdan (601.457/657) HB Ch. 14.1, 14.2 FvDFH 16.1, 16.2 Ray Casting Image RayCast(Camera camera, Scene scene, int width, int height) { Image image = new Image(width, height); for
Illumination Michael Kazhdan (601.457/657) HB Ch. 14.1, 14.2 FvDFH 16.1, 16.2 Ray Casting Image RayCast(Camera camera, Scene scene, int width, int height) { Image image = new Image(width, height); for
A Modified Weibull Distribution
 IEEE TRANSACTIONS ON RELIABILITY, VOL. 52, NO. 1, MARCH 2003 33 A Modified Weibull Distribution C. D. Lai, Min Xie, Senior Member, IEEE, D. N. P. Murthy, Member, IEEE Abstract A new lifetime distribution
Basic Medical Statistics Course
 Basic Medical Statistics Course S0 SPSS Intro November 2013 Wilma Heemsbergen w.heemsbergen@nki.nl 1 13.00 ~ 15.30 Database (20 min) SPSS (40 min) Short break Exercise (60 min) This Afternoon During the
Package MIICD. May 27, 2017
 Type Package Package MIICD May 27, 2017 Title Multiple Imputation for Interval Censored Data Version 2.4 Depends R (>= 2.13.0) Date 2017-05-27 Maintainer Marc Delord Implements multiple
weibull Documentation
 weibull Documentation Release 0.0 Jason R. Jones Jan 11, 2018 Contents 1 Installation 1 1.1 Using pip................................................ 1 1.2 Using setup.py............................................
MULTISTATE MODELS FOR ECOLOGICAL
 MULTISTATE MODELS FOR ECOLOGICAL DATA RACHEL MCCREA DICE SEMINAR CANTERBURY, OCTOBER 2015 COLLABORATORS Mike Hudson Hannah Worthington Ming Zhou Diana Cole Richard Griffiths Ruth King Eleni Matechou OUTLINE
NONPARAMETRIC SUMMARY CURVES FOR COMPETING RISKS IN R
 NONPARAMETRIC SUMMARY CURVES FOR COMPETING RISKS IN R By Pawel Paczuski 1 University of Michigan November 19, 2012 Abstract In survival analysis, when a subject may fail due to one of K 2 causes, we have
Integer Programming Chapter 9
 1 Integer Programming Chapter 9 University of Chicago Booth School of Business Kipp Martin October 30, 2017 2 Outline Branch and Bound Theory Branch and Bound Linear Programming Node Selection Strategies
Side-effects of checkpoints inhibitors
 Side-effects of checkpoints inhibitors Endocrinologic and nephrologic syndromes Jean KLASTERSKY MD, PhD Université Libre de Bruxelles (ULB) InsJtut Jules Bordet InsJtut Brussels - Belgium No conflicts
Randolph E. Bucklin Catarina Sismeiro The Anderson School at UCLA. Overview. Introduction/Clickstream Research Conceptual Framework
 A Model of Web Site Browsing Behavior Estimated on Clickstream Data Randolph E. Bucklin Catarina Sismeiro The Anderson School at UCLA Overview Introduction/Clickstream Research Conceptual Framework 4 Within-site
for Images A Bayesian Deformation Model
 Statistics in Imaging Workshop July 8, 2004 A Bayesian Deformation Model for Images Sining Chen Postdoctoral Fellow Biostatistics Division, Dept. of Oncology, School of Medicine Outline 1. Introducing
Geometric Steiner Trees
 Geometric Steiner Trees From the book: Optimal Interconnection Trees in the Plane By Marcus Brazil and Martin Zachariasen Part 2: Global properties of Euclidean Steiner Trees and GeoSteiner Marcus Brazil
OnCore Enterprise Research. Subject Administration Full Study
 OnCore Enterprise Research Subject Administration Full Study Principal Investigator Clinical Research Coordinator June 2017 P a g e 1 This page is intentionally blank. P a g e 2 Table of Contents What
Mean Tests & X 2 Parametric vs Nonparametric Errors Selection of a Statistical Test SW242
 Mean Tests & X 2 Parametric vs Nonparametric Errors Selection of a Statistical Test SW242 Creation & Description of a Data Set * 4 Levels of Measurement * Nominal, ordinal, interval, ratio * Variable Types
Photon beam dose distributions in 2D
 Photon beam dose distributions in 2D Sastry Vedam PhD DABR Introduction to Medical Physics III: Therapy Spring 2014 Acknowledgments! Narayan Sahoo PhD! Richard G Lane (Late) PhD 1 Overview! Evaluation
Handbook of Statistical Modeling for the Social and Behavioral Sciences
 Handbook of Statistical Modeling for the Social and Behavioral Sciences Edited by Gerhard Arminger Bergische Universität Wuppertal Wuppertal, Germany Clifford С. Clogg Late of Pennsylvania State University
An Excel Add-In for Capturing Simulation Statistics
 2001 Joint Statistical Meetings Atlanta, GA An Excel Add-In for Capturing Simulation Statistics David C. Trindade david.trindade@sun.com Sun Microsystems, Inc. Cupertino, CA David Meade david.meade@amd.com
Volume 5, Issue 7, July 2017 International Journal of Advance Research in Computer Science and Management Studies
 Volume, Issue 7, July 2017 International Journal of Advance Research in Computer Science and Management Studies Research Article / Survey Paper / Case Study Available online at: www.ijarcsms.com A Study
Accelerated Life Testing Module Accelerated Life Testing - Overview
 Accelerated Life Testing Module Accelerated Life Testing - Overview The Accelerated Life Testing (ALT) module of AWB provides the functionality to analyze accelerated failure data and predict reliability
Statistical Analysis of List Experiments
 Statistical Analysis of List Experiments Kosuke Imai Princeton University Joint work with Graeme Blair October 29, 2010 Blair and Imai (Princeton) List Experiments NJIT (Mathematics) 1 / 26 Motivation
SE420 - Software Quality Assurance
 SE420 - Software Quality Assurance http://dilbert.com/strips/comic/2006-01-29/ Lecture 3 Unit Testing, Part-2 January 21, 2019 Sam Siewert Reminders Assignment #2 Posted Thursday [Unit Re-Use] Explore
Media centre Electromagnetic fields and public health: mobile phones
 Media centre Electromagnetic fields and public health: mobile phones Fact sheet N 193 Reviewed October 2014 Key facts Mobile phone use is ubiquitous with an estimated 6.9 billion subscriptions globally.
Module 18: Diffraction-I Lecture 18: Diffraction-I
 Module 18: iffraction-i Lecture 18: iffraction-i Our discussion of interference in the previous chapter considered the superposition of two waves. The discussion can be generalized to a situation where
Basic Medical Statistics Course
 Basic Medical Statistics Course S0 SPSS Intro December 2014 Wilma Heemsbergen w.heemsbergen@nki.nl This Afternoon 13.00 ~ 15.00 SPSS lecture Short break Exercise 2 Database Example 3 Types of data Type
gsdesign: An R Package for Designing Group Sequential Clinical Trials Version 2.0 Manual
 gsdesign: An R Package for Designing Group Sequential Clinical Trials Version 2.0 Manual Keaven M. Anderson, Dan (Jennifer) Sun, Zhongxin (John) Zhang Merck Research Laboratories December 18, 2008 Abstract
Image-based Monte Carlo calculations for dosimetry
 Image-based Monte Carlo calculations for dosimetry Irène Buvat Imagerie et Modélisation en Neurobiologie et Cancérologie UMR 8165 CNRS Universités Paris 7 et Paris 11 Orsay, France buvat@imnc.in2p3.fr
A BRIEF SURVEY ON FUZZY SET INTERPOLATION METHODS
 A BRIEF SURVEY ON FUZZY SET INTERPOLATION METHODS Zsolt Csaba Johanyák, Szilveszter Kovács 2 Senior lecturer, 2 PhD, Associate professor Kecskemét College, Mechanical Engineering and Automation College
Regularization and model selection
 CS229 Lecture notes Andrew Ng Part VI Regularization and model selection Suppose we are trying select among several different models for a learning problem. For instance, we might be using a polynomial
Minitab detailed
 Minitab 18.1 - detailed ------------------------------------- ADDITIVE contact sales: 06172-5905-30 or minitab@additive-net.de ADDITIVE contact Technik/ Support/ Installation: 06172-5905-20 or support@additive-net.de
Radiation therapy treatment plan optimization
 H. Department of Industrial and Operations Engineering The University of Michigan, Ann Arbor, Michigan MOPTA Lehigh University August 18 20, 2010 Outline 1 Introduction Radiation therapy delivery 2 Treatment
Qualint: Test for Qualitative Interactions from Complete Data
 Qualint: Test for Qualitative Interactions from Complete Data Lixi Yu Eun-Young Suh Guohua (James) Pan October 6, 2014 1 Introduction This is a short tutorial on using the qualint function. The qualval
Nonrigid Registration using Free-Form Deformations
 Nonrigid Registration using Free-Form Deformations Hongchang Peng April 20th Paper Presented: Rueckert et al., TMI 1999: Nonrigid registration using freeform deformations: Application to breast MR images
Fundamental Data Manipulation Techniques
 The Analysis of Longitudinal Data Introduction This document describes the process of organizing longitudinal data from the HRS for the purposes of statistical analysis. We start by considering three small
DUAL energy X-ray radiography [1] can be used to separate
![DUAL energy X-ray radiography [1] can be used to separate](/thumbs/91/106229592.jpg "DUAL energy X-ray radiography [1] can be used to separate") IEEE TRANSACTIONS ON NUCLEAR SCIENCE, VOL. 53, NO. 1, FEBRUARY 2006 133 A Scatter Correction Using Thickness Iteration in Dual-Energy Radiography S. K. Ahn, G. Cho, and H. Jeon Abstract In dual-energy
IEEE TRANSACTIONS ON NUCLEAR SCIENCE, VOL. 53, NO. 1, FEBRUARY 2006 133 A Scatter Correction Using Thickness Iteration in Dual-Energy Radiography S. K. Ahn, G. Cho, and H. Jeon Abstract In dual-energy
Merging Files of Time-varying Covariates
 Merging Files of Time-varying Covariates Mark Lunt Arthritis Research UK Epidemiology Unit, University of Manchester, Stopford Building, Oxford Road, Manchester, M13 9PT, U.K. Abstract. This insert describes
Missing data a data value that should have been recorded, but for some reason, was not. Simon Day: Dictionary for clinical trials, Wiley, 1999.
 2 Schafer, J. L., Graham, J. W.: (2002). Missing Data: Our View of the State of the Art. Psychological methods, 2002, Vol 7, No 2, 47 77 Rosner, B. (2005) Fundamentals of Biostatistics, 6th ed, Wiley.
Ludwig Fahrmeir Gerhard Tute. Statistical odelling Based on Generalized Linear Model. íecond Edition. . Springer
 Ludwig Fahrmeir Gerhard Tute Statistical odelling Based on Generalized Linear Model íecond Edition. Springer Preface to the Second Edition Preface to the First Edition List of Examples List of Figures
Scan Matching. Pieter Abbeel UC Berkeley EECS. Many slides adapted from Thrun, Burgard and Fox, Probabilistic Robotics
 Scan Matching Pieter Abbeel UC Berkeley EECS Many slides adapted from Thrun, Burgard and Fox, Probabilistic Robotics Scan Matching Overview Problem statement: Given a scan and a map, or a scan and a scan,
Missing Data Analysis for the Employee Dataset
 Missing Data Analysis for the Employee Dataset 67% of the observations have missing values! Modeling Setup For our analysis goals we would like to do: Y X N (X, 2 I) and then interpret the coefficients
4.2.2 Usability. 4 Medical software from the idea to the finished product. Figure 4.3 Verification/validation of the usability, SW = software
 4.2.2 Usability Intended purpose, Market Validation Usability Usability Risk analysis and measures Specification of the overall system SW SW architecture/ of SW SW design Software design & integration
Chapter 9 Field Shaping: Scanning Beam
 Chapter 9 Field Shaping: Scanning Beam X. Ronald Zhu, Ph.D. Department of Radiation Physics M. D. Anderson Cancer Center Houston, TX June 14-18, 2015 AAPM - Summer School 2015, Colorado Spring Acknowledgement
Modelling Personalized Screening: a Step Forward on Risk Assessment Methods
 Modelling Personalized Screening: a Step Forward on Risk Assessment Methods Validating Prediction Models Inmaculada Arostegui Universidad del País Vasco UPV/EHU Red de Investigación en Servicios de Salud
Evaluating generalization (validation) Harvard-MIT Division of Health Sciences and Technology HST.951J: Medical Decision Support
 Harvard-MIT Division of Health Sciences and Technology HST.951J: Medical Decision Support") Evaluating generalization (validation) Harvard-MIT Division of Health Sciences and Technology HST.951J: Medical Decision Support Topics Validation of biomedical models Data-splitting Resampling Cross-validation
Evaluating generalization (validation) Harvard-MIT Division of Health Sciences and Technology HST.951J: Medical Decision Support Topics Validation of biomedical models Data-splitting Resampling Cross-validation
STATA Note 5. One sample binomial data Confidence interval for proportion Unpaired binomial data: 2 x 2 tables Paired binomial data
 Postgraduate Course in Biostatistics, University of Aarhus STATA Note 5 One sample binomial data Confidence interval for proportion Unpaired binomial data: 2 x 2 tables Paired binomial data One sample