Quality Assurance for Tomotherapy Systems
|
|
|
- Reginald Booker
- 5 years ago
- Views:
Transcription
1 Quality Assurance for Tomotherapy Systems NEDERLANDSE COMMISSIE VOOR STRALINGSDOSIMETRIE Report 27 of the Netherlands Commission on Radiation Dosimetry March 2017 Netherlands Commission on Radiation Dosimetry Subcommittee Tomotherapy QA March 2017
2 Quality Assurance for Tomotherapy Systems NEDERLANDSE COMMISSIE VOOR STRALINGSDOSIMETRIE Report 27 of the Netherlands Commission on Radiation Dosimetry Authors V. Althof B. De Ost N. Reynaert K. Schubert E. Sterpin J.B. van de Kamer Netherlands Commission on Radiation Dosimetry Subcommittee Tomotherapy QA March 2017 ii
3 Disclaimer regarding NCS reports The NCS frequently publishes reports for fellow professionals in which recommendations are given for various quality control procedures or otherwise. The members of the NCS board and the members of the concerning subcommittee do not claim any authority exceeding that of their professional expertise. Responsibility on how the NCS recommendations are implemented lies with the user, taking into account the practice in his/her institution. iii
4 Preface The Nederlandse Commissie voor Stralingsdosimetrie (NCS, Netherlands Commission on Radiation Dosimetry, was officially established on 3 September 1982 with the aim of promoting the appropriate use of dosimetry of ionising radiation both for scientific research and practical applications. The NCS is chaired by a board of scientists, installed upon the nomination of the supporting societies, including the Nederlandse Vereniging voor Radiotherapie en Oncologie (Netherlands Society for Radiotherapy and Oncology), the Nederlandse Vereniging voor Nucleaire Geneeskunde (Dutch Society of Nuclear Medicine), the Nederlandse Vereniging voor Klinische Fysica (Dutch Society for Medical Physics), the Nederlandse Vereniging voor Radiobiologie (Netherlands Radiobiological Society), the Nederlandse Vereniging voor Stralingshygiëne (Netherlands Society for Radiological Protection), the Nederlandse Vereniging voor Medische Beeldvorming en Radiotherapie (Dutch Society for Medical Imaging and Radiotherapy), the Nederlandse Vereniging van Klinisch Fysisch Medewerkers (Dutch Society for Medical Physics Engineers), the Nederlandse Vereniging voor Radiologie (Radiological Society of the Netherlands) and the Belgische Vereniging voor Ziekenhuisfysici/Société Belge des Physiciens des Hôpitaux (Belgian Hospital Physicists Association). To pursue its aims, the NCS accomplishes the following tasks: participation in dosimetry standardisation and promotion of dosimetry intercomparisons, drafting of dosimetry protocols, collection and evaluation of physical data related to dosimetry. Furthermore, the commission shall maintain or establish links with national and international organisations concerned with ionising radiation and promulgate information on new developments in the field of radiation dosimetry. Current members of the board of the NCS J.B. van de Kamer, Chairman T.W.M. Grimbergen, Vice-Chairman J. de Pooter, Secretary J.M.J. Hermans, Treasurer A. Reijnders F.W. Wittkämper M.K. de Fluiter-Zeeman J.R. de Jong P. Sminia K. Franken iv
5 Summary This NCS report on QA for Tomotherapy Systems is written by medical physicists from Belgium, France, Germany and the Netherlands, all experienced users of the Tomotherapy systems. Note the use of the multiform of the word system : Tomotherapy is an integrated system with sub systems for dose calculation, image acquisition, dose delivery, adaptive radiotherapy, quality assurance and transfer of the patient beam prescription (sinogram) to another Tomotherapy machine. After the publication of the AAPM report QA for Helical Tomotherapy: report of the AAPM Task Group 148 in 2010, various (sub)systems have been updated and improved, warranting an update of this code of practice. This subcommittee started its work in September Major progress has been made on automated and integrated Quality Assurance, taking advantage of arrays of detectors (third party vendors), using the build-in MVCT exit detector for QA and by the introduction of the TQA application which integrates acquisition and analysis of QA data. The introduction of the non-rotating target made beam energy more stable. The dose control system (DCS) made output more stable. Both developments had its impact on the QA program. Another field of progress concerns protocols for small field reference dosimetry, specific for machines unable to set-up a conventional reference field, like Tomotherapy. The dosimetry protocol described in this report is mainly based on the report of the IAEA/AAPM working group on a new formalism for reference dosimetry of small and non-standard fields. Dose Planning has evolved also, resulting in VoLO: a Tomotherapy specific implementation of the Collapsed Cone Superposition algorithm implemented on a Graphical Processor Unit hardware platform. This report contains a chapter on dose planning with a detailed description of these developments, its history and present-day recommended QA. Furthermore, QA of the MVCT imaging beam, the patient set up correction tools and the applications for sinogram transfer and adaptive procedures are described. The basis of this code of practice is the Tomotherapy system as it was established in Developments which were in progress while finishing this report, like dose planning by a third party vendor, advanced tools and workflow for adaptive radiotherapy, the use of the exit detector for in vivo dosimetry and a build in kv imaging system. These are left to a future report. v
6 Contents Preface... iv Summary... v Contents... vi Glossary of concepts, accessories and system components... ix 1 Introduction System overview Treatment delivery for Tomotherapy Introduction Periodic Quality Assurance TQA introduction TQA module description Mechanical alignments Beam parameters Multi leaf collimator properties Dynamic behaviour of gantry, couch and MLC Miscellaneous aspects QA measurement schedule Dose Calibration Calibration in non-reference conditions Reference dosimetry in a static field: machine specific reference field Practical implementation of reference dosimetry in a static field: defining, 4.4 Practical defining, in a Tomotherapy beam implementation of reference dosimetry in a static field: Reference dosimetry for a composite field: Plan-class specific reference field Practical implementation of reference dosimetry for a composite field:, 4.7 5,, defining Recommendations on tolerance limits and Interval MegaVolt CT imaging system vi
7 5.1.1 Overview Use of MVCT images Standard Workflow HU CT number calibration and IVDT check Geometry Orientation Scaling, rotation, distortion Location virtual isocentre to machine isocentre Overlap red and green lasers Image Quality Noise Uniformity Resolution Contrast Artefacts Dose MVCT scan Dose per scan Patient Setup Registration and positioning Red laser reference point set up Rotational setup correction Quality assurance of treatment planning system Introduction to Tomotherapy treatment planning Static beam model Dynamic jaws ( TomoEdge) Dose computation algorithm TomoHelical delivery Additional specificities of TomoDirect delivery vii
8 DCRT Optimization on non-gpu systems Optimization on GPU-systems (VoLO) End-of-planning (EOP) Quality assurance of Tomotherapy treatment planning kvct image and IVDT General dosimetric validation and QA Patient-specific delivery QA (DQA) Patient Transfer and Planned Adaptive Introduction Validating the Patient Transfer system Sinogram scaling QA of patient transfer Planned Adaptive QA on Planned Adaptive Appendix Acknowledgements References viii
9 Glossary of concepts, accessories and system components Helical Tomotherapy Radiotherapy unit dedicated to IMRT, using a linac that produces a fan shaped beam that rotates continuously around the patient while the couch transfers the patient through the field. A binary MLC is used to shape the beam segments and intensity is modulated by allowing individual leaf open times per projection. Projection A projection is one of the 51 equally spaced arc segments per rotation. In a projection the binary MLC is programmed to open one or more leaves a fraction of the time needed to travel a projection. MLC The binary Multi Leaf Collimator (MLC) is used to shape the beam segments. The MLC consists of 64 pneumatic (air driven, motorless), interlaced and binary leaves which transit the fan beam width in about 20 milliseconds Sinogram File containing data for each projection. These data may be related to imaging or leaf opening times. For the latter, the sinogram contains the fraction of the time each leaf is open during a projection. Beamlet Single beamlet corresponds to the radiation emitted through a single open MLC leaf, with the gantry at any given angle during rotation. It has a width in the transverse direction of approximately 0.6 cm (the projected leaf width) and a length dependent on the jaw setting selected for treatment Treatment plane This is the plane through the physical isocentre of the machine perpendicular to the y-axis (inside the bore). Pitch Ratio of the couch displacement for one gantry rotation to the slit width. XML file XML files are used to transfer all treatment delivery settings of a corresponding treatment plan to the treatment machine. Output The dose per unit of time. Modulation factor The maximal leaf open time divided by the average of all non-zero opening times. It is a measure of modulation complexity of the treatment. Cheese phantom A cylindrical phantom provided by Accuray consisting of Solid Water. The phantom can be used for quality assurance using ix
10 ionisation chambers and/or film. It is also used to calibrate the Hounsfield units of both the MVCT and the local kvct unit, and to access contrast and spatial resolution using dedicated plugs. DQA Delivery quality assurance: evaluation of the ability of the system to deliver a treatment plan for a patient (=sinogram) correctly. The dose distribution of this sinogram is computed on a new CT study of a phantom, and compared with measurements using this phantom. Exit detector A build in, ion chamber based CT detector, mounted at the exit side of the linac, used for CT imaging of the patient and QA applications. Planned Adaptive A software package provided by Accuray, to evaluate the impact of daily patient positioning and anatomical changes. The daily delivered dose (verification dose) is calculated on the MVCT images and can be compared to the planned dose. TQA Application for automated acquisition and analysis of Tomotherapy Quality Assurance procedures provided by Accuray. Step wedge An aluminium phantom to be used in the Step wedge modules of the TQA software EOP End Of Planning is a dose calculation in full-scatter mode performed after finishing the planning optimization phase. Gold Standard (GS) Common beam model shared by all Tomotherapy units IVDT Image value-to-density table. Calibration curve for conversion of CT Hounsfield Units to mass density. Thread effect Longitudinal oscillations of dose distributions due to helical beam junctioning. LFOF Leaf-fluence output factor. Accounts for the change in output for one leaf open, caused by the closed/open state of the adjacent leaves. JFOF Jaw-fluence output factor. Accounts for the change in output as function of the jaw size, relative to the 5 cm slit. Latency The relationship between the effective leaf open times and programmed leaf open times Leaf filter A fluence profile that represents the fluence distribution for a given open/closed leaf configuration JAM Part of the machine characterization data that lists the properties of the collimation system x
11 AOM Part of the machine characterization data that lists the properties of the beam generating system statrt Workflow enabling successively patient imaging, treatment planning and treatment delivery while the patient is lying on the treatment couch. VoLO Voxel-less Optimization. New generation of dose calculation algorithm based on GPU architecture. DMS Data Management System: application to allow for batch archiving and restoring of patient data and for transferring of patient sinograms to another Tomotherapy system. T&G effect Tongue and Groove effect: the leave sides have tongue and groove to limit MLC transmission. Because of this, opening two adjacent leaves simultaneously yields a different fluence from opening them in sequence. DAS Data Acquisition system collects and provides health signals of the machine and MVCT exit detector data. TEMS Tomotherapy Electrometer Measurement System. Part of the Tomotherapy QA package. msr field Machine specific reference field is the static field which is closest to the conventional field size and shape used for dose calibration. pcsr field Plan class specific reference field (for dose calibration): a combination of fields in a configuration representing the clinically delivered treatment DCS Dose control servo: Automatically output adjusting controls to ensure a stable output. Especially relevant for treatments of longer duration and for treatments with fixed gantry. TomoDirect A non-rotational treatment option. TomoDirect allows creation of treatment plans with the use of 2 to 12 target-specific gantry angles. During treatment delivery, all beams for each target are delivered sequentially with the couch passing through the bore at an optimized speed for each individual gantry angle. DRS The Data Receiver Server (DRS) converts and stores detector and system data. It is responsible for converting the data such that it can be approached via the ftp standard (File Transfer Protocol) Medical Physics Expert (MPE) An individual or, if provided for in national legislation, a group xi
12 of individuals, having the knowledge, training and experience to act or give advice on matters relating to radiation physics applied to medical exposure, whose competence in this respect is recognised by the competent authority (European Commission, radiation protection no 174, 2014) IAEA International Atomic Energy Agency AAPM American Association for Physicists in Medicine NCS Dutch Commission on Radiation Dosimetry xii
13 1 Introduction Helical Tomotherapy is an intensity modulated radiation therapy (IMRT) delivery technique combined with an integrated system for image guided radiation therapy (IGRT) using a fan beam megavoltage computed tomography (MVCT) capability. NCS reports 8 (in Dutch) and 9 (NCS 8, 1995; NCS 9, 1996) are the most recent NCS reports on Quality Control (QC) of Medical Linear Accelerators and are published in The AAPM Task Group report 142 (Klein et al., 2009) provides QC guidelines for more recent technology. But with the introduction of technology that is different from conventional C-arm type accelerators, these guidelines need to be extended. In 2010 Task Group report 148 (Langen et al., 2010) was published which describes Quality Assurance (QA) guidelines for helical Tomotherapy. It provides a comprehensive set of recommendations on what should be tested and the respective recommended test frequencies. Since then a number of dosimetry audits on Tomotherapy systems have been conducted (Alvarez et al., 2016; De Ost et al., 2011; Duane et al., 2006). Since publication of TG148 progress has been made on several fields. New dose calibration protocols for non-reference conditions have been developed. The graphical processor unit (GPU) has been introduced as a new hardware platform for dose calculation. The Voxel-Less Optimization (VoLO) dose calculation algorithm was released, subsequently. Treatment delivery with fixed gantry angles (TomoDirect) was introduced based on a new gantry positioning system and gantry drive. Numerous developments made the treatment delivery system more robust and reliable, such as the new High-Precision (HP) couch, the Dose Control System (DCS) and the fixed (non-rotating) target. TQA was released which offers an integrated tool for QA using the build-in exit detector. TomoEdge allows dynamic jaw movement to sharpen the dose build up cranio-caudal of a target structure. All this warranted the development of the current NCS report which is a new set of QA guidelines, actualized to the developments made on the Tomotherapy system until mid These areas of development are basic dosimetry, dose planning, the use of the exit detector for QA purposes, multiple static beam delivery, transfer of patient treatment procedures between Tomotherapy systems and adaptive radiotherapy using the Planned Adaptive application. Other areas are still under development, like dose guided radiotherapy (DGRT) using the exit detector to measure the transmitted fluence through the patient and to reconstruct the fluence applied to the patient. This new functionality is released under the name Delivery Analysis. It will not be covered in this report. In 2003 the first Tomotherapy Hi-Art came on the market. In 2010 the Tomotherapy HD was released. In 2017 the Tomotherapy Radixact will be available. In this new design, system 13
14 components have been redistributed to enable mounting of a imaging system. Already released is a fully automated adaptive workflow which uses deformable registration to allow voxel tracking and voxel dose accumulation. Possible future developments such as dynamically tracking of the anatomy and adjusting the leaves accordingly are not dealt with in this report. All Tomotherapy systems use a factory beam model. Currently two beam models are in production and one legacy model (pre TomoEDGE). Each system is adjusted in the factory such that the beam parameters match one of these models. During on-site commissioning and acceptance testing (ATP), it is verified that this is still the case. A number of ATP tests can be used as reference measurement for regular QA tests. Other QA tests should be performed before the first treatment. It is therefore recommended that a medical physics expert (MPE) on-site is actively involved in the ATP process. The system was developed at the University of Wisconsin-Madison and was later commercialized by Tomotherapy, Inc., Madison, Wisconsin. In 2011 Tomotherapy, Inc. merged with Accuray Inc., Sunnyvale, California. Accuray is the only vendor that markets and manufactures treatment units that use this delivery process. Procedures and recommendations discussed in this report are therefore specific to Tomotherapy treatment units. The units were introduced into clinical routine in In this NCS report, an overview of the Tomotherapy system and its unique aspects is provided. Delivery, imaging and treatment planning quality assurance are discussed. Quality assurance aspects are summarized according to their recommended interval in the appendix. The proposed Intervals for the individual test are defined for a system which is running under a continuous QA-Program and is not showing any systematic deviations. For machines which are newly installed, or show systematic deviations in the tests, the intervals maybe shortened. Additional QA needs to be performed after interventions on the system, including software updates. Which tests are needed should be defined together with the Field Service Engineer (FSE) considering the performed work. The acceptance test protocol (ATP) and commissioning protocol (CP) are part of the QA program but will not be part of this report. 14
15 2 System overview Figure 2.1 shows the Tomotherapy system configuration whereas Figure 2.2 shows the general lay-out of the Tomotherapy unit. The 6 MV accelerator is mounted on a slip ring gantry. A flattening filter is not used. The beam is collimated in a fan-beam shape. Timeresolved collimation is provided by a binary multileaf collimator (MLC): each leaf defines a beamlet. The size and shape of each beamlet is fixed and the fluence exiting this beamlet is either on or off (although the time of flight or latency is corrected for during dose calculation). During treatment the couch is translated through the beam plane which rotates continuously (helical mode) or is in fixed positions (static or Direct mode). Opposite the accelerator is a detector array which is used to collect data for MVCT acquisition, for QA purposes and for delivery fluence reconstruction. A beam stopper is used to reduce radiation exposure outside the patient. The distance from the source to the centre of rotation is 85 cm. The source to detector distance is 145 cm. Except for the new style 4 detector which is focussed on the source, the detector curvature is focused to a point that does not coincide with the source. This has an impact on the lateral detector response and hence on the measured transversal profile. For such a detector, its profile shows a typical dip in the central part where the rays impinge vertical in the CT detector channels and create less scattered electrons and thus less signal (Balog et al., 2003a). The diameter of the bore is 85 cm. The fan-beam has a lateral extension of 40 cm at isocentre. In the cranio-caudal, or Ydirection, the beam width is collimated by an adjustable jaw. Three sizes are available: 5 cm, 2.5 cm and 1.0 cm. Asymmetrical adjustment of the beam width is possible and available as the TomoEdge product. This will reduce the dose superior and inferior of the target volume and in between multiple targets which are separated in the sup-inf-direction. A binary 64 leaf collimator is used to divide the fan beam in the X-direction. The leaves travel cross the fan beam in the Y-direction in an interlaced manner. Leaves with even number are driven from the rear side MLC bank (+Y direction), leaves with uneven number are driven from the front side MLC bank. The leaves are driven pneumatically. This allows a rapid transitioning of a leaf in less than 0.02 sec. Opening and closing of a leaf is controlled around 51 equidistant points every rotation. This space angle of 7.1º is called a projection. The opening of a leaf is always symmetrically around the centre of the projection. The MLC is a binary system, a leaf is either open or closed. During a projection each leaf can be opened once. Intensity modulation is achieved by varying leaf opening time with a minimum of 0.02 sec (typical leaf transit time) and a maximum of sec (corresponds to the time to travel a projection using the maximum allowable gantry period of 60 sec). 15
16 Each leaf has a width of cm at isocentre. The gantry travels clockwise with constant speed and the angle naming convention is conform to the International Electrotechnical Commission standard, i.e. the gantry angle is zero if the beam points downward in the vertical direction. The treatment plane is inside the bore and for patient set up purposes a virtual isocentre is defined 70 cm outside the bore. A fixed green laser system (outside the bore) is used to project this virtual isocentre with lines in coronal, axial and sagittal orientations. The patient reference point, which is defined during the treatment planning process, is marked on the patient skin. A movable red laser system consists of five units in the room (two coronal, two axial and one sagittal laser). The position of the red laser lines is plan specific and these lines are used to set up the patient using the patient marks. Radiation delivery is controlled by a custom encoder that is integrated with the gantry to provide angular position information during rotation. This custom encoder is called the tick fence and is essentially comprised of a ring of 2880 holes, through which positional signals are received and read by optical sensors. Radiation delivery is terminated after the programmed number of ticks has passed. Treatment plan parameters such as gantry rotation speed and MLC dynamics, but also linac pulse rate and the read out of the build-in exit detector, are all tick-based and synchronized through this tick fence. This removes the possibility for an erroneous variation of dose with gantry angle, when the gantry slows down or speeds up. Couch motion however is controlled fully independently from the tick fence. Counting the number of ticks is equivalent with time only if gantry speed conforms to the programmed value (in seconds). In helical mode the system operates fully in tick domain. In static mode (fixed gantry) the system operates fully in time domain. In static mode gantry positioning is achieved through RSF encoder tape (RSF Inc.) with counts per 360 degrees. During beam on, dose rate checks are applied to each of the two monitor chambers independently, such that a dose rate violation detected by either chamber will interlock treatment. The dosimetric effect induced by a dose rate deviation cannot be estimated easily. Due to the sequential nature of dose delivery, only the voxels which are in the beam during this deviation are affected. The effect will also depend on the MLC pattern during this period. The monitor unit (MU) readings that are displayed on the operator screen are derived from the monitor chamber signals. One MU represents the machine output expressed in cgy/min measured at a depth of 1.5 cm with an SAD of 85 cm and a 5x40 cm2 static field. This MU scaling is performed by the vendor during ATP, using solid water slabs with an insert for an A1Sl ion chamber, and should be approved by the MPE responsible for the machine. The final and determinative dosimetric calibration is performed by measuring, with a calibrated 16
17 ion chamber, a planned dose distribution on a phantom. Initial beam instability is anticipated by closing all MLC leaves the first 10 s of every planned delivery. Figure 2.1 Tomotherapy system configuration. More planning stations are allowed. Beside the dose planning it can also support licensed products as DMS, DQA and Planned Adaptive. 17


18 Figure General layout of Tomotherapy unit: (1) machine isocentre (2) virtual isocentre,, distance between both isocentres isocentres is 700 mm. m. The arrows show the X, Y, Z coordinate convention. 3 Treatment delivery for Tomotherapy 3.1 Introduction The Tomotherapy beam delivery is unique in combining slip ring technology, binary MLC and moving treatment couch. Therefore, a number of QA tests are Tomotherapy specific. QA items and also the pre pre-treatment treatment check on a phantom (DQA) can be performed using film, ionisation ation chamb chamber er and arrays of detectors detectors.. The latter can be done using devices such as Delta 4 (Feygelman et al., 2010), 2010), MapCheck (Jursinic et al., 2010), 2010) Tomodose array (Langen et al., 2005b) 2005b),, ArcCheck (Templeton et al., 2015) 2015),, Octavius (Van Esch et al., 2007) or making 18
19 use of the on-board exit detector (Althof et al., 2012; Balog et al., 2003a; Choi et al., 2014; Van de Vondel et al., 2009). Data from the exit detector are accessible via the Tomotherapy TQA application. This application collects detector- and system data by accessing the DRS computer in the Tomotherapy machine via FTP. The intent of this chapter is to describe a comprehensive set of QA items, usable for both helical and direct procedures, which need to be addressed periodically to maintain the Tomotherapy delivery system. 3.2 Periodic Quality Assurance QA tests are described for mechanical alignment, beam parameters, multi leaf collimator properties, miscellaneous aspects and the synchronized dynamic behaviour of gantry, couch and MLC. Quality assurance aspects are summarized according to their recommended interval in the appendix. Measurements and procedures are described in the Accuray user manuals. References are also made to the Task Group 148 report (Langen et al., 2010), which gives a comprehensive overview from the user point of view TQA introduction Tomotherapy Quality Assurance (TQA) is a tool to support a Tomotherapy QA program. The application reads and analyses detector- and system data after a TQA procedure has been run on the machine. TQA consists of several modules to measure various QA items. The tool is intended to monitor changes in system performance that may provide early indications for maintenance or dosimetric validation. TQA is considered as a supplementary quality assurance tool that allows both professionals in the clinic and Accuray Inc. to forecast the need for preventive maintenance before an issue affects the normal functioning of the Tomotherapy Treatment System. Accuray calls this tool supplementary, because physics quality assurance checks with films and calibrated ionisation chambers remain the primary means of determining the accuracy of the treatment system and the acceptability of a patient treatment procedure. However, for a number of items beside TQA no validated alternative is easily available. This is especially true for dynamic parameters (e.g. MLC properties, cone shape variation per pulse, some dynamic jaw movements) or the behaviour of the detector itself. Moreover, some items need exit detector data to provide data to the beam model (e.g. leaf fluence output factors, leaf latency values, air scan calibration). Data Acquisition System (DAS) Most TQA modules make use of data from the built-in exit detector and from system data, which is collected by the Data Acquisition System (DAS). DAS data can only be extracted 19
20 from the system before a new procedure has been selected because this selection will clear the just collected data files. The following TQA modules also use external detectors: Linac Longitudinal Alignment and Jaw Sweep (A17 ionisation chamber and TEMS software with the Tomo electrometer), and the two modules to measure Field Width (fixed and dynamic) using A1Sl ionisation chamber and TEMS software with the Tomo electrometer (Standard Imaging). A TQA module will process DAS data automatically (auto run). Detector data is extracted from the DAS by FTP. The DAS input files are time-stamped. This time stamp is used to plot data points on the trending graphs. In a manual run, data is submitted by the operator to the TQA server. For off line analysis, the module s input file can be downloaded from the TQA server and then resubmitted to TQA. The data of a run is stored in an xml output file. This file can be shared with Accuray Inc. for further analysis. The TQA analysis can also be performed on treatment or physics procedures that were delivered without using TQA. Reference file Most modules require a reference file to process results. This reference file (*.sig) can be generated by any procedure run. The reference is not created from beam model data (e.g. tabulated MLC latency values) or numerical values (e.g. nominal couch speed). The result of a module run is compared against the reference run of this specific module to produce differential results. These differential results are used to monitor constancy over time. It is important to underline that TQA offers a consistency check only. References can be reset, but to maintain traceability of results and trending data, Accuray Inc. recommend to control (to limit) the frequency of replacing a reference by a new one. Before a new reference is set, the user must establish, whenever possible, a direct link between parameters measured using TQA and corresponding physics measurements. If system properties are out of tolerance, they should be tuned back within specs of the beam model. Only after this procedure, a reference run should be made. This will avoid an unnoticed drift in the values of the QA parameters measured by TQA. If this procedure cannot be followed, it is recommended to keep the first made reference file (closely after ATP or commissioning) on the TQA server. This allows re-analysing TQA data relative to this first time reference. Alert levels 20


21 Two alert levels are defined for each item. Alert level 1 indicates that a data item is outside normal operating tolerances and should be monitored, but may not require immediate attention. Alert level 2 indicates that a data item is significantly ficantly outside normal operating tolerances and require requires immediate attention. The alert levels are set to default values by Accuray Inc. Default alert tolerances may be changed but we recommend to accept the default levels provided by the company. In some instances the default alert levels need reviewing, for example in module System Monitor the responsible field service engineer should review these levels for his specific system. Not all items are provided with alert levels, either because the correct number number is not known or the parameter is not suited to be monitored using an alert level. level. In that case inf could be filled in. The analysis is still performed but without showing alert levels. For some items the authors autho of the current report recommend alert levels based on their experience and research, research, as depicted in Figure 3.1. Figure Part of the numerical analysis of a measurement with the Helical Stepwedge. For this particular example the authors suggest to replace the alert levels 1 and 2 for the MLC Flash Center Difference from inf inf (=unknown) to 5 and 20 ms respectively. Alerts s generated by TQA should NOT be viewed as an indication that the system does not function. TQA enables proactive diagnosis of system health before downtime occurs. Because a TQA measurement is easily performed and automatically analyzed analyzed,, TQA tends to increase ease the frequency of QA checks. Moreover, a any ny TQA module incorporates several tests at once, not all of them necessarily have to be measured with the same frequency. The user can design his own measurement schedule in TQA (Daily, Weekly, Monthly and Annually ally or event driven (post-service (post service checks or other events)). No data is provided by Accuray Inc. on the sensitivity, reproducibility and accuracy of the TQA tool. Accuray warns against misinterpretation misinterpretation of the results. For instance cone shape is sensitive for a change in energy, but this may not be the only cause. In this example, tthe 21
22 MPE should always perform ionisation chamber measurements at different depths in water (equivalent material) to confirm TQA results. Furthermore, as an example, because TQA analysis of beam energy is based on comparison of measured attenuation profiles of the step wedge phantom, a large set-up error of the phantom on the couch will cause not only an alert violation on translation, but also on the attenuation profile. Althof et al (Althof et al., 2012) present an in-house developed analysis tool using the same static Stepwedge phantom procedure as TQA. A comparison is made to standard physical measurements using ionisation chamber and film which showed that the static Stepwedge procedure is an accurate and effective tool for QA measurements. For detailed information about the algorithms used for analysis of the TQA data see the TQA manual. Tick fence The tick fence is a delivery safety system, as briefly mentioned in chapter 2. Leaf modulation, linac pulse rate and on-board exit detector read-out, are all synchronized with gantry position. The tick fence imposes implications on the interpretation of measurements performed in helical mode using the exit detector. In fact, variations in gantry period cannot be measured by the Stepwedge Helical module (see paragraph 3.2.2) because a gantry that rotates faster, will also speed up the sampling of the exit detector by the same amount. As a result, the gantry movement is presented as being constant, provided the tick fence works correctly. Therefore, a variation in the QA item gantry period difference, is not an indication about gantry behaviour, but it points towards a failure of the tick fence system, which is valuable in itself. Some QA parameters measured in helical mode are presented in the TQA analysis in units of time. In fact this is incorrect. This should be interpreted as units of ticks, which can be converted to time, assuming a constant tick/sample ratio. This is only correct if the gantry speed is constant. Because couch speed is not controlled within the tick fence system, it would be useful to have a method to measure synchronicity between gantry and couch. Of course there are secondary build-in system checks and interlocks on couch speed and position TQA module description This paragraph lists all available TQA modules. Each module is characterized by: Purpose, Set up, Parameters, Interval and Description. A complete overview of all QA items (including 22
23 TQA) with measurement frequencies, parameters and tolerances (alert levels), is given in the tables in the appendix. TQA module: Basic dosimetry Purpose: Rotational Variation (RotVar) procedure, no absorber in the beam. It measures and analyses the signal of monitor chamber 1 (MC1), the exit detector output (central channel) and the transversal profile (cone shape; all detector channels). Set up: No absorber in the beam path Parameters: All leaves open, 1 cm slit (J7), sample rate is 33.3 ms (sampling at 300 Hz with a compression factor 10). Beam on time is 200 sec, gives a total of 6000 pulses. Estimated time to complete the procedure, including the analysis of the results, is 10 min. Interval: Daily Description: raw and normalized detector signal of the central channels and monitor chamber 1 (MC1) output, output ramp up (number of pulses to reach the average output level), exit detector cone profile, gamma index (comparison normalized just measured cone profile versus normalized reference cone profile), pulse by pulse showing MC1 and cone shape variation. If monitor chamber data does not match exit detector output, there may be an issue with dose monitors, energy, target condition, jaw collimation or the detector array. The sensitivity of the exit detector channels may decrease up to 2.5%/year (depends on detector type). Therefore the ratio exit detector average to Dose1 will drift accordingly. TQA module: System monitor Purpose: To evaluate overall technical system performance using any XRT procedure type, including a patient treatment. This TQA module is recommended on a daily basis for instance together with the TQA module Basic Dosimetry. It can be applied on an ad-hoc basis (in case of acute problems in system performance). Parameters: The analysis includes health signals like system temperature, flow meter data, water and air pressure etc. These monitored items do not represent calibrated, traceable measurements. Tolerances are set by the vendor, and it is recommended to adhere to these. Interval: Daily TQA module: Air scan Purpose: Is recommended to perform daily and is used for two purposes. First, to normalize detector data in the image reconstruction process to ensure MVCT image quality (Monitor 23
24 Chamber 1 offset and Exit Detector signal offset average). Secondly to evaluate rotational jaw stability to detect hardware degradation of the collimation system. Set up: No absorber in the beam path Parameters: Jaw position variations can be inferred from MC1 and exit detector data and are analysed in three sections of the detector array. The result is depicted as the Peak to Peak Fluence Variation (mm). Jaws are set to the imaging beam size (J1 or J4). Interval: Daily Description: All leaves open, 6 gantry rotations (10 sec per rotation), raw data, and no absorber in the beam. TQA module: Daily QA Purpose: A compilation of tests from other modules. Provides an overall assessment of system health. A 300 sec procedure with no data compression (raw data). Set up: No absorber in the beam path Interval: Weekly - although a daily run does not increase workload significantly, a weekly frequency is found adequate looking at the type of tests performed in this module. Description: DQ/RotVar as in module Basic Dosimetry, but with the 5 cm slit (J48), 10 sec gantry, 8 rotations, all leaves open. Gives information on signals from MC1 and exit detector (central channels and cone shape). DQ/RotVar with the imaging beam jaw setting (J1) but with the treatment beam AOM settings. Analysis as in Basic Dosimetry. DQ/RotVar with the 1 cm slit (J7). Analysis as in Basic Dosimetry. DQ/ Linac transverse alignment, as in the module with this name but in less time. Uses Tongue & Groove to analyse the transverse alignment of the linac compared to the collimation system. DQ/Y-axis and exit detector alignment: This part of the module assumes the detector is rigidly attached to the gantry drum. The detector output ratio is calculated for two half open 5 cm fields. One field has a front jaw setting of -2.4 and a back jaw setting of 0. The other field has a front jaw setting of 0 and a back jaw setting of 2.4. The output ratio of detector channels for both jaw settings, calculated at three positions (far left versus far right, and centre) should be within a given tolerance. The difference between far left and far right is also a measurement of jaw twist. Once a reference data set is established, any change may indicate a change in jaw position or in beam coincidence with the axis of gantry rotation. This module does not replace the film 24
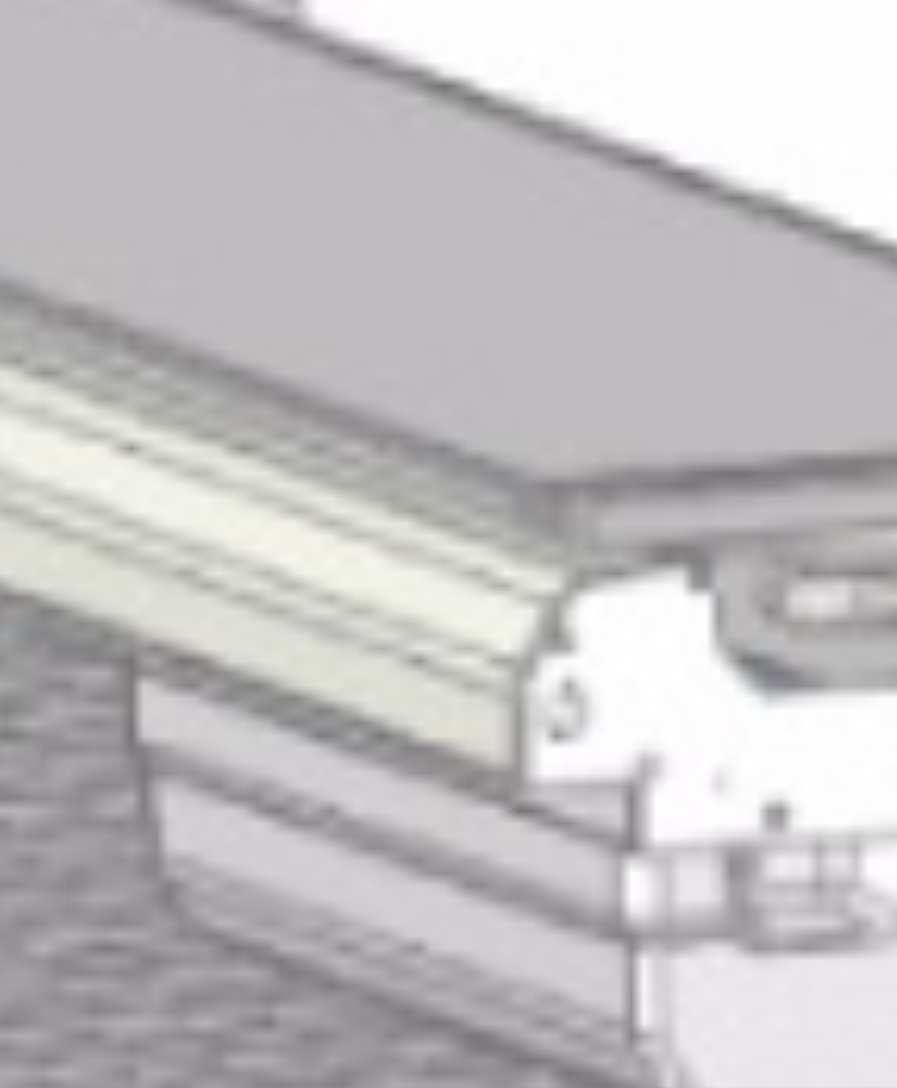
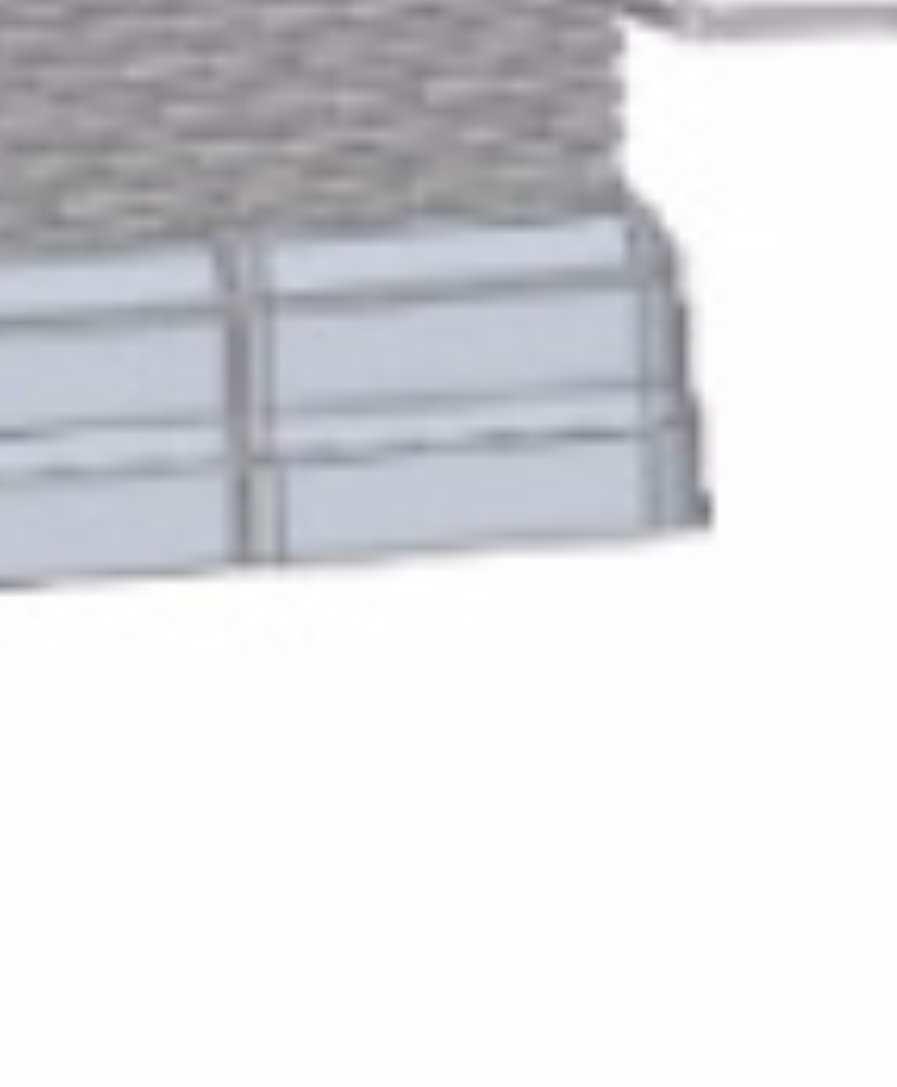
25 procedure Y-Axis beam centring and alignment (section 3.2.3), but can be used as a constancy tool for this parameter. DQ/Dynamic Jaw Sweep: Measures the dynamic behaviour of the jaws. With one jaw parked at maximum extended position, the other jaw quickly sweeps across its range (and vice versa). The jaw position is monitored every 2 ms and then compared to the expected position on the OBC every 100 ms. The data is plotted against time. The location of the 50% profile value is determined and compared to reference data. Also the variability in slit size is trended (max back/front jaw encoder error). DQ/Leaf Latency: is a measure of MLC dynamics using two slit sizes (J7 and J20). A group of 8 leaves is opened/closed during different fractions of the projection time. A time analysis of leaf movement is made using the raw detector data (3 ms time resolution). DQ/All leaf latency is a test of adequate air pressure under maximum demand on the air supply. TQA module: Stepwedge static Purpose: Monitors output, jaw collimation, couch speed, green laser alignment, beam energy spectrum consistency, detector response consistency. Parameters: Gantry at zero degrees, all leaves open, no modulation. Slit size 1 cm, couch speed 1.5 mm/sec, 220 sec beam on, compression factor 10. Set up: Stepwedge phantom is aligned at the green lasers on the couch with the steps facing the gantry. See figure 3.2. Interval: Weekly 25


")
.")
.")


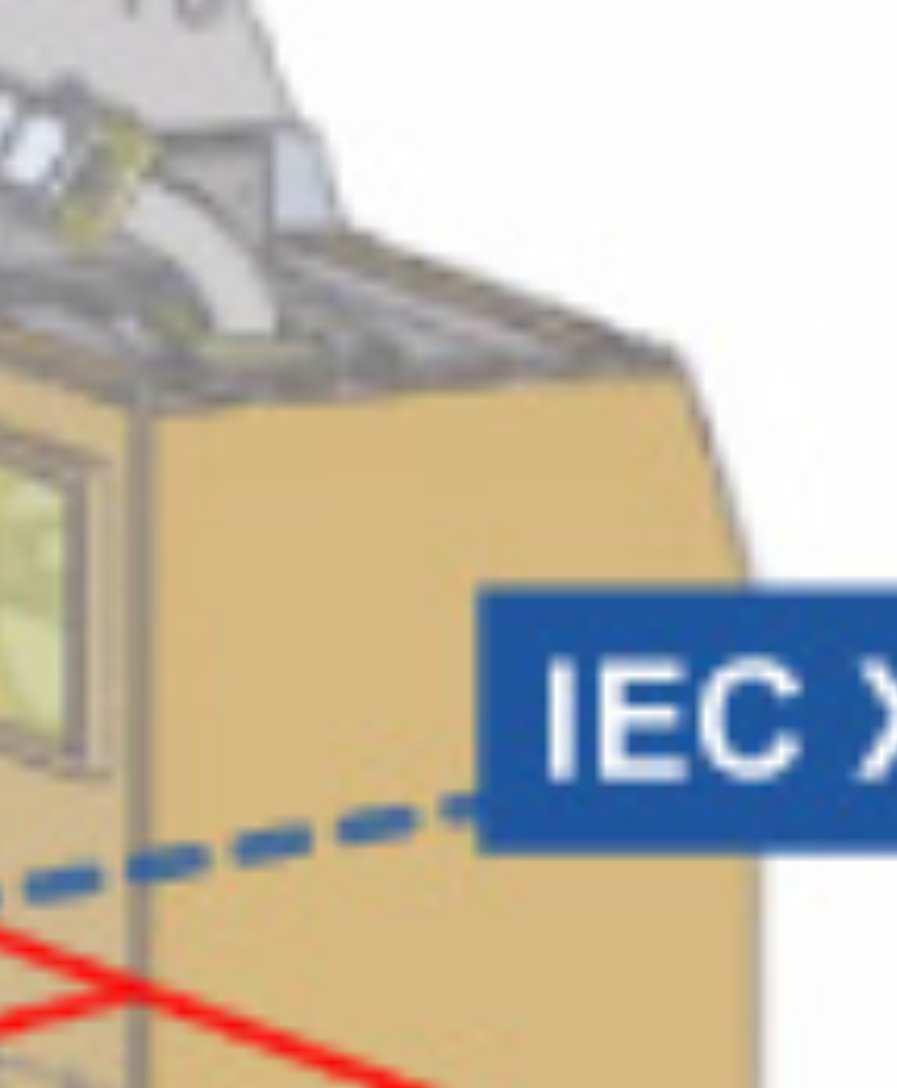
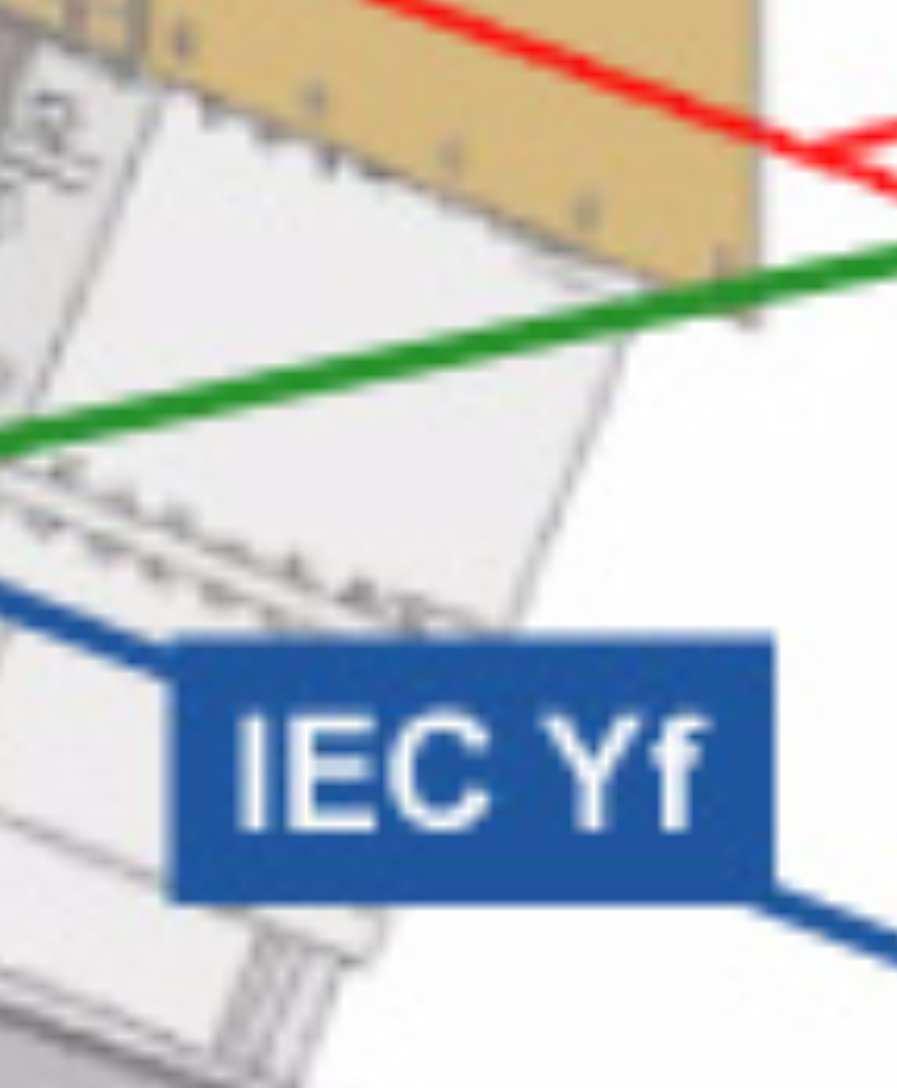
26 Figure Measurement set up of the stepwedge and the measured stepwedge time profile Description Description: The Step wedge is positioned on the couch according to the green lasers (these lasers are fixed in space and define the virtual isocenter. See also chapter 2: System Overview ) Overview ). Each average of 10 detector read outs provides an image image of the Stepwedge profile subtracted from the open beam cone profile profile. The position of the centre of this Step wedge image provides a measure of lateral position consistency (IECx) of the green lasers, the width of the image provides vertical position con consistency sistency (IECz). The location of the step gradient centres provides a longitudinal position consistency (IECy). The distance between the half--value value locations between each step quantifies couch speed. Because the system does not rotate, the tick fence is not not used and the couch speed is measured in time domain. The Edge slope Average Ratio measures the slope of the step edges. This is correlated with field width. If the step wedge is not set up at the same height as the reference, procedure results may imply that the field width is off. The slope of the attenuation (measured by analysis of the step profile profile) is determined to check energy constancy. Energy difference is calculated by comparing the slope of a linear fit through the natural log of the step wedge profile data with a reference slope (Figure Figure 3.3). 3 26

, phase), gantry period and timing of MLC open/close open/close. Parameters Parameters:: Field width 1 cm, couch speed 1.")

 the attenuation profiles with reference profiles (the step center ) center ),, forms the basis of this TQA analysis.")
27 An ionisation isation chamber may be inserted into the base of the step wedge to measure dose. These data are not analysed by this module. Figure The static stepwedge time profile reflects the attenuation of the stepwedge levels, measured with the on board exit detector. TQA module: Stepwedge Helical Purpose Purpose:: It monitors output, jaw collimation, green laser alignment, beam energy spectrum consistency consistency,, detector response, response, gantry position (the phase), phase), gantry period and timing of MLC open/close open/close. Parameters Parameters:: Field width 1 cm, couch speed 1.0 mm/sec, modulated leaf motion, 200 sec beam on, gantry period 20 sec, nr rotations 10, compression factor 10. Set up: Stepwedge phantom is aligned at the green lasers on the couch with the steps facing the gantry Interval: Weekly Description Description: Attenuation tenuation profiles profiles are (periodically) unique at a given gantry angle. Comparison of (the position of the center of) the attenuation profiles with reference profiles (the step center ) center ),, forms the basis of this TQA analysis. Variation in gantry phase angle around the levels of the stepwedge, may point towards a mismatch between couch and gantry position. Note 1: The Stepwedge Helical module does not provide metrics about gantry gantry period differences, in the case of a correct correct functioning of the tick fence. See S thee item Tick fence in paragraph Report TG148 (paragraph V.B.3) describes a synchronicity measurement between leave motion and gantry position, and between couch and gantry position position,, using film. See also this report, paragraph A combined measurement of synchronicity 27
28 between couch, leaf and gantry could in principle be performed with an 3D detector array like ArcCheck (Sun Nuclear). Note 2: MLC flash centre and MLC flash width are presented in msec. Strictly speaking, this is incorrect and should be given in unit of ticks. Implicitly it is assumed that ticks and time are equivalent. Such equivalence assumes a correct and constant gantry speed. Please refer to the item Tick fence in paragraph Note 3: The slope of the attenuation, as measured by analysis of the step profile, is determined to check energy stability. However, the result of this analysis depends heavily on set up variations of the phantom, couch and gantry speed and signal variation by couch absorption. It is therefore recommended to measure beam energy constancy with the static Stepwedge module. Note 4: If the tick fence fails, the gantry position and timing of leaf motion will be incorrect. The tick fence consists of 2880 ticks, which is 8 ticks/degree. This committee advises to use an alert of 1º in gantry angle difference when using the Step wedge helical module (10 rotations) which corresponds to a tick counting error of, on average, 0.8 tick/rotation. TQA module: Linac longitudinal alignment Purpose: This TQA module tests the alignment of the linac photon source in relation to the jaw collimation in IEC y. Detector: Ion chamber with a long active volume and a homogenous response. The vendor recommends the Exradin A17. Set up: The long axis of the ionisation chamber is positioned along the Y direction. Interval: After replacing or disturbing any component that may affect this alignment. Otherwise annually. Tolerance: The source position should agree with its nominal position (established at factory commissioning) within 0.2 mm for a TomoEdge system and 0.3 mm for a non-edge system (vendor s specification). Parameters: The test involves comparing ionisation chamber measurements (A17 ionisation chamber) at machine isocentre for different jaw settings. Description: The slit has an opening of 2 mm that is centred over different positions along the longitudinal (IEC Y) axis. By using an ionisation chamber with a uniform response over a long collection volume, the chamber does not have to be moved between procedures. The chamber signal is plotted as a function of axial jaw shift. When the source is aligned with the y-jaw, the maximum output should be observed at zero jaw shift, and output should fall off 28


")


 2010).")

 effect.")

29 equally on either side. The signal peak peak is determined by a parabolic fit to the data. An example da data ta set from this procedure is shown in Figure 3.4. Figure The response of the ionisation ion chamber as function of the longitudinal position of a small 2mm slit relative to the source. Analysis may show a difference in source position relative to the commissioned factory situation situation,, revealing a necessary jaw actuator shift. shi TQA module: Linac Transverse Alignment Purpose Purpose: This TQA module tests the alignment of the linac photon source with respect to the MLC in the lateral (IEC X) direction. Set up:: No absorbers in the beam path Interval: After replacing or disturbing any component that may affect this alignment is replaced or moved. Otherwise annually. Tolerance Tolerance: out-of-focus focus within 2% which corresponds to a source position offset of 0.34 mm (Langen et al., 2010) 2010). Description Description:: The centring of the radiation source in x is measured using the Tongue and Groove (T&G) effect. This effect is caused by the T&G design of the leaves that prevents a direct path for radiation to pass through when a adjacent djacent leaves are closed. A consequence of this design is a difference in fluence if two adjacent leaves open in sequence or simultaneously. The T&G effect is most symmetrical if the MLC is focused to the source in 29


 2010). Figure 3 3.")


30 the x direction. The exit detector array is used to collect output profiles with all even evennumbered MLC leaves opened and subsequently with all odd-numbered odd numbered MLC leaves opened. This delivery sequence will maximize the T&G effect. The TQA application will add the odd odd-numbered numbered leaf profiles and even even-numbered numbered leaf profiles and divide the result by an output profile that is collected with all MLC leaves open. This normalized T&G profile should be symmetric about the centre if the source is properly aligned with the MLC. Figure 3.5 shows normalized T&G data. An out-of out of focus value is calculated based on the right right-left asymmetry of the profile. The result of this calculation is presented in % out out-of-focus. focus. For the exact formula see the Accuray TQA manual or TG148 (Langen et al., 2010) 2010). Figure Normalized tongue and groove data to analyze the alignment of the photon source in the lateral (IECX) direction. Measured with the TQA module Linac Transverse Alignment. TQA module: Jaw Sweep (dynamic jaws) Purpose Purpose:: This module tests the movement of the dynamic jaws, the jaw fluence output factors and tthe he alignment of the linac photon source in relation to jaw collimation (as in module Linac longitudinal alignment). alignment Detector Detector: A17 ionisation isation chamber and TEMS electrometer Set up:: Position the long axis of the A17 in the Y direction, w with ith the triaxial cable facing away from the gantry. Setup the correct in/out and height position. Parameters Parameters:: Beam on time is 600 sec, couch and gantry are st static, atic, all leaves open. Interval: weekly Description Description:: Jaw fluence output factors are measured for 4 slit widths: J2, J7, J14 (in between, non non-clinical clinical width) and the J20. Back and front jaw sweep measures the fluence profile of an individual jaw as it opens and closes. Symmetric open/close measures the same for simultaneously opened back and front jaws. Time skew measures the variation in position in time when the jaws are opened and closed quickly. The differences in the detector signal time profile to a reference profile is shown and should be monitored (See Figure 3.6).. 30


31 Figure Graphical result of the TQA module Jaw Sweep. Several jaw sweep patterns are measured for 4 slit widths. The measured profiles overlap the reference profiles. TQA module: Field width (fixed jaws) Purpose Purpose:: Measurement of longitudinal field size and shape for all clinical slit widths. Detector Detector:: A1Sl ionization chamber and TEMS electrometer Set up:: A solid water slab is positioned on the couch with the long axis in the Y direction. The A1Sl is inserted and a 0.5 cm slab of solid water is positioned on top of this configuration. Parameters Parameters:: All leaves open,, couch 1 mm/sec, 200 sec beam on. on Tolerance Tolerance: 1% Interval: rval: Monthly Description Description:: Topographic procedure: An A1SL chamber is positioned positioned in the slabs at depth of cm, with the chamber axis parallel with the plane of rotation. The beam profile is collected by the TEMS. The field width is determined at FWHM. Th The e difference to the reference is converted to jaw encoder units to assist adjustment of the machine collimation system. This procedure can be omitted when the Field width dynamic jaws is performed. TQA module: Field width (dynamic jaws) Purpose Purpose:: Measurement longitudinal field size and shape for a number of symmetric and asymmetric slit widths. Detector Detector:: A1Sl ionization chamber and TEMS electrometer Set up:: A solid water slab is positioned on the couch with the long axis in the Y direction. The A1Sl 1Sl is inserted and a 0.5 cm slab of solid water is positioned on top of this configuration. Parameters Parameters:: All leaves open,, couch 1 mm/sec, 720 sec beam on. on 31


32 Tolerance Tolerance: 1% Interval: Monthly Description: The same procedure as with the fixed jaws. The number of of commissioned field widths has increased from 3 to 10. Beside the symmetric fields also a number of asymmetric fields are measured. See Figure 3.7. Figure Gamma analysis of the J14 topographic profile. Measured with the TQA module Dynamic Field Width, using an ion ionisation chamber Mechanical alignments This paragraph describes measuremen measurements s of QA items covering beam alignment, beam properties and output. Alignment source in Y Measurement procedu procedure re is described in section 3.2.2, 3.2.2, TQA module Linac longitudinal alignment. Alignment source in X Measurement procedure is described in section 3.2.2, TQA module Linac transverse alignment. lignment. Y-Axis Axis beam centring and alignment Procedure Purpose Purpose: The alignment procedure of the yy-jaw jaw with the beam plane assures that the central beam axis intersects the rotational axis perpendicularly, that the beam diverges symmetrically around the plane of the gantry rotation and that there is no rotation of the jjaw 32
33 around a vertical axis (twist). Detector: film, CT detector Set up: film on couch, couch is fixed in height, couch is not in isocentre, irradiated from 0 and 180 Interval: After replacing or disturbing any component that may affect this alignment is replaced or moved. Otherwise annually. Tolerance: The deviation of the beam axis from perpendicular at isocentre should be 0.5 mm or less. The jaw twist should be less than 0.5 (vendor s specification). Description: A filmless alternative using the exit detector is available in TQA module Daily QA : the Y-jaw and exit detector alignment. The reference for this filmless TQA procedure should be acquired in the same measurement session as the film procedure described in this section. A film is positioned horizontally between solid water plates (depth of 2 cm) and is positioned below the isocentre (as far as possible to increase sensitivity). The isocentre is defined by the stationary green lasers. The Y-collimation is set to a nominal clinical field and the gantry is positioned at 0. The MLC field is defined such that only leaves at one lateral side of the central axis are open during exposure. After the first irradiation, the gantry is rotated 180 and a second irradiation is delivered using the same treatment slit width and MLC configuration. Figure 3.8 illustrates this test procedure. To verify that the beam divergence is centred on the plane of gantry rotation, the centre of both fields is measured, using film analysis QA package RITg148 from RIT Inc. The position of the linac in Y direction and the CAX-Y result from this analysis, are related by a ratio of 18. For example, with a film located 25 cm below isocentre, a 0.3 mm difference between the beam centres on the film would translate into a beam divergence at isocentre of 0.51 mm. Offset tolerance is ±0.5 mm and ±0.1 mm when the Central Axis Y-axis Misalignment Procedure is used as the measurement to establish a reference for the TQA module daily QA. 33


 The")


34 Figure Schematic overview of the test setup for the yy-divergence divergence test with a schematic of a the film results. In the picture on the right hand side, the beam does not diverge symmetrically to the axis of rotation. This situation would require an adjustment of the jaw encoders. (courtesy of TG148 report on Tomotherapy Quality Assurance) The jaw twist is measured on the same film. The centre lines of both profiles are detected. The half of the slope between both centre lines equals the physical jaw twist. See Figure 3.9. Figure Illustration of jaw twist film results (courtesy of TG148 report on Tomotherapy Quality Assurance) 34


.")


.")


35 Treatment field centring Purpose Purpose: To measure the coincidence of the centre positions of the available field widths Detector Detector: film Set up:: perpendicular to beam axis, in isocentre isocentre,, build up, gantry at 0 Interval: After replacing or disturbing any component that may affect this alignment is replaced or moved or on other indications. indications. Tolerance Tolerance: Field centres centres should agree within 0.5 mm at isocentre (vendor s specification). Description Description: Two y-jaw y jaw widths at a time can be checked on the same film. As an example see Figure 3.10:: the leaf pattern is such that for jaw width 2.5 cm 3 blocks of each 7 leaves are opened and for jaw width 5 cm four blocks or each 7 leaves open.. The film is irradiated with both leaf settings. From the profiles profiles the field centres centres for both jaw widths can be analysed analysed. Figure Film for test of clinical beam axial centring centring.. (courtesy of TG148 report on Tomotherapy Quality Assurance) MLC alignment: position and orientation of leaf bank relative to centre of rotation Detector Detector: film Set up:: perpendicular to beam axis, in isocentre isocentre, gantry at 0 and 180 Interval: After replacing or disturbing any component that may affect this alignment is replaced or moved. Otherwise on indication indication. Tolerance Tolerance:: MLC lateral offset less than 1.5 mm and twist less than 0.5 (vendor s specification). The value of the lateral offset is taken into account during planning. Description Description: This test checks the lateral lateral alignment of the MLC bank relative to the centre of rotation. Two paired central MLC leaves and two paired off centre leaves are opened. Film is exposed at 0. Gantry is rotated to 180. Now only the paired off centre leaves are opened. The result should resemble the image shown in Figure The central exposed area should be centred between both outer areas. Both outer areas should be parallel. Off Offset set and twist measured from the film is magnified by a factor of 2, because misalignments are added from each of the two exposures. The results should therefore be divided by 2. 35
 ionisation isation chambers (2) on board exit detector Set up:: (1) solid water slabs and two ioni ionisation ation chambers in n 10 and 20")

 the PDD curve. The TQA module Stepwedge Helical is not suited to measure the energy nergy accurately but it can be used as a tripwire.")
36 Figure MLC alignment/twist test. (courtesy of TG148 report on Tomotherapy Quality Assurance) Beam parameters Beam energy - PDD Detector Detector: (1) ionisation isation chambers (2) on board exit detector Set up:: (1) solid water slabs and two ioni ionisation ation chambers in n 10 and 20 cm depth (2) TQA with Stepwedge static Interval: weekly Tolerance Tolerance: 2% Note: The reference for any field measurement of beam quality, should reference to a corresponding measurement in water. This water PDD should be within specs of the PDD used in the beam model. Description Description: Two methods are described to perform a field measurement. (1) Point measurements in water equivalent material at two depths 10 and 20 cm (solid water slabs are part of the QA package of the vendor) and (2) using u the TQA Stepwedge static module module, beam qualit quality y is monitored by measuring a (derivate of) the PDD curve. The TQA module Stepwedge Helical is not suited to measure the energy nergy accurately but it can be used as a tripwire.. The Stepwedge Static module measures the beam attenuation with filters of different effective thickness (the levels of the Stepwedge) pushed through the beam by the moving couch. The on on-board board exit detector detects the transmitted fluence. From the Stepwedge measurement a PDD20/10 value is obtained. In TG TG-142 (Klein et al., 2009) the tolerance for beam quality variations is 1% for the PDD20/10 and the recommended interval of beam quality test should be monthly. In NCS 9 (NCS 9, 1996) the tolerance is 1% and the interval is annually. For the Tomotherapy system using a rotating target (Siemens linac) an increased tolerance value of 2% for the PDD20/10 and a weekly measurement is recommended because of beam quality changes that occur due to target wear (Althof et al., 2012; Staton et al., 2009) 2009). Staton found dose deviations between planned and delivered treatment up to 4.5% due to target wear. The rotating targets are bei being ng replaced in the field by non-rotating non targets which are much less sensitive for target wear wear. The TG-142 TG 142 tolerance of 1% for the PDD20/10 for beam quality variations is recommended for these non-rotating rotating targets.. 36
37 Only if a rotating target is in use, it may be necessary to tune beam quality over time. This adjustment can only be done within a limited range, making timely replacement of this type of target recommended. Trends in PDD ratio allow predicting target replacement. Kampfer (Kampfer et al., 2011) suggests performing target replacement if the PDD20/10 has drifted by 1.5% to a lower value. Althof (Althof et al., 2012) shows that in the DQA procedure of a helical treatment a 2% change in PDD results in on average 3% difference in measured and planned point dose, measured on a high dose, low dose gradient position. It is expected that the TomoDirect technique, using a limited number of beam directions, is more sensitive on changes in beam energy spectrum. On an annual basis, agreement with the beam model should be verified for each commissioned treatment slit width by measuring the PDD in a water tank. Cone (Transverse) beam profile Detector: exit detector or ionisation chamber Set up: TQA (no absorber) or water tank measurement Interval: TQA daily and water tank annually Tolerance: 2% Description: By design Tomotherapy units are not equipped with a flattening filter and the transverse beam profiles are cone shaped. TG-142 (Klein et al., 2009) specifies a beam profile consistency tolerance of 1% for monthly beam profile tests, measured within 80% of the transverse field size. Cone profiles are monitored in several TQA modules using the onboard exit detector. Because exit detector efficiency changes with off-axis distance, the detector data are not used to measure the shape of the beam profile as it is used in the beam model, but to test its consistency to a reference. Inherent to the use of the on-board exit detector system is the assumption that the off-axis detector response remains constant over time. Althof et al (Althof et al., 2012) reports 3 year trend data from two Hi-Art machines. A decrease in sensitivity relative to the monitor chamber up to 2.5% per year for the central channel was reported. No data was available for the other detector channels. However, the trend data did not show profile changes that could not be explained by target wear or failure of a specific channel. The exit detector profiles should be referenced to water tank profiles annually. Longitudinal beam profiles Detector: ionisation chamber 37
38 Set up:: TQA modules Field Width (static, (static, dynamic): profile with solid water slabs and A1Sl ionisation isation chamber. Water tank, set up the same as during commissioning. See Figure Interval:: TQA Field Width: monthly. Water tank: annually Tolerance Tolerance:: 1% in FWHM, gamma analysis on profiles Figure Example of longitudinal beam profiles measured in a water tank and the respective modeled beam profiles. Data were acquired at an SSD of 85 cm and at depths of 15, 50, 100, 150, and 200 mm. (courtesy of TG148 report on Tomotherapy Quality Assurance) Description Description: The constancy of the longitudinal profile shape and size is particularly important for helical Tomotherapy. Tomotherapy. The dose to the patient is the integration of the longitudinal profile with couch motion (Balog et al., 2003b) 2003b).. Typically, the dose delivered will change approximately ± 2% if the nominal 10 mm field width changes by 2%. Monitoring onitoring of the beam s FWHM is therefore recommended. Agreement of the measured profiles with the beam model, using water ta tank nk data, should be verified annually. The field width can be influenced by wear in the collimation system. Wiggling of the jaws in longitudinal direction is measured in the TQA module Daily QA using normalized variations in output measured with the exit detector. The rotational jaw variation is expressed in the parameter Peak Peak-to to-peak Peak Fluence Variation (mm). IIf this parameter is >0.4 mm mm, jaw position errors may affect the accuracy of treatment procedures (vendors specification). Output helical Detector Detector:: Monitor Chamber (MC), Ionization Chamber (IC) Set up:: MC: no absorber. IC: cheese phantom phantom, solid water slabs Interval:: MC: daily, IC: weekly 38
39 Tolerance: 3% in homogenous part of dose distribution, 5% otherwise. Description: It is assumed that all Tomotherapy units are equipped with the Dose Control System (DCS). With this system the dose rate is controlled by a feedback loop where output is regulated such that MC reading is constant or within a small window. Strictly speaking the MC reading is not an output reading because a malfunctioning of the MC can give rise to a wrong output while the MC reading is constant. However monitor chamber 2 will interrupt radiation in such a situation. Moreover the absolute readings of the exit detector channels and the ratio MC over central detector channel will also give a strong indication of a problem in the output. In this report we will therefore still assume that MC reading is a measure of the output. Due to DCS, variation in output as function of gantry angle or duration of radiation is minimal. Consistency of the output should be monitored on a daily basis using the TQA Basic Dosimetry module which reads and analyses the monitor chamber 1 signal. The system is used in helical mode. This can be done easily in the morning after warm up of the system. Helical output is monitored weekly using a DQA type of measurement on the cheese phantom with several ionisation chambers. At least one of them needs to be positioned in a homogeneous and high dose region of the planned dose distribution. The measured values can be compared with the values obtained from the Tomotherapy dose planning system. Output static Detector: Ionization Chamber (IC) Set up: Solid water slabs or a (cylindrical) water phantom, e.g. as described in chapter 4 on Dose Calibration, section 6 Interval: weekly when using TomoDirect, otherwise monthly Tolerance: 3%. Description: This measurement is a test for output consistency at several (e.g. 4) fixed gantry angles. Every week the measurement is performed at a different gantry angle. If TomoDirect is available, the measured values can be compared with the values obtained from the Tomotherapy dose planning system. If TomoDirect is not available this measurement cannot be predicted by a dose planning calculation. In order to use such an output measurement (corrected by temperature and pressure and calibration factor) as a reference, it should be cross-correlated with measurements that are linked to a dose calculation (e.g. the TomoPhantom5Sets of equivalent phantom procedure). The measurement can be combined with a PDD measurement with ionisation chambers at two depths. 39
40 3.2.5 Multi leaf collimator properties Replacement of the MLC After replacement of an MLC bank, measurements must be performed to obtain: the positioning in lateral direction relative to the source, the position relative to the exit detector, leaf filters (=longitudinal fluence profiles per leaf), latency and LFOF values. The procedure to perform all measurements is available for the Accuray FSE or the first line engineering team. The service application TDAT analyzes the measurements and produces data to update that part of the system that is called the JAM (Jaw Accelerator Machine): LeafTAGLower, -higher, -both, latency data and leaf filter data. Latency describes the relationship between the effective open times and programmed open times of the Multi-Leaf Collimator (MLC). Leaf fluence output factors describe how Multi-Leaf Collimator leaves affect the signals of adjacent leaves in a variety of positions. Lateral position of the linac compared to the centre of the MLC is checked by measuring the T&G profile, as described in TQA module Daily QA. The procedure to calibrate the position of the MLC relative to the detector ( Fixture Scan and Pin Scan ) is described in the T-SVC00159 physics document. This procedure models leaf profiles (leaf filters) in greater detail and is necessary for a system equipped with a mint drive in order to use TomoDirect. It is recommended that all reference output plans in use in the clinic, be re-optimised and calculated so as to utilise the latest Latency/LFOF/filter parameters. QA procedure after MLC bank replacement or replacement of isolated leaves Procedures to measure LFOF and latency are available for the responsible MPE and/or first line support. Analysis of the results and the update of the JAM is checked and approved by Accuray. If the latencies and/or the leaf fluence output factors of the new MLC differ too much from the old values, the MLC is registered as non-equivalent, disabling all treatment plans of patients currently under treatment. The so-called self-transfer corrects the existing sinograms, taking into account the new MLC properties and avoids re-planning. Note that the self-transfer can only be used if the MLC is effectively registered as non-equivalent. See chapter 7 on Patient Transfer for more info. If Patient Transfer is not successful, it is recommended to re-plan every patient. To accept the new MLC, a repeat DQA or a repeat reference treatment performed with a measurement one week or less before the MLC replacement, can be performed. If these results deviate more than 2% from the results acquired with the old MLC, a self-transfer of 40
41 the existing treatment plan procedures could be performed within the Data Management application. Monitoring MLC properties Monitoring MLC properties is performed with TQA. These TQA tools can be found in module DailyQA and Stepwedge Helical, as presented in section Leakage Leakage through the closed MLC bank and through the linac shielding should be assessed after MLC, jaw or linac replacement. It allows for detection of manufacturing errors or errors in the placement of shielding material. Leakage can be measured using film. Leakage is approximately 0.3% relative to the open field Dynamic behaviour of gantry, couch and MLC We recommend using the TQA modules Stepwedge helical and Stepwedge static to measure the behaviour of dynamic parameters couch, MLC and gantry. These modules do not provide information about the synchrony of MLC and gantry. Note: deviations in dynamic behaviour cannot easily be pinpointed to just one parameter. For example, one cannot tell if the gantry is too fast or the couch too slow. Gantry rotation couch translation Detector: film Set up: a film with 1.5 cm build up is placed on the couch. Interval: annually Tolerance: difference between film maxima within 1 mm Description: A rotational irradiation is used with the nominal 1.0 cm beam and a pitch of 1 for 13 rotations. The control sinogram is set to open all the leaves for half a rotation on the second, seventh, and 12th rotation. The resulting film is scanned and a profile is produced along the direction of table travel. The resulting profile should show maxima 5 cm apart to within 1 mm. Note: TQA module Helical Stepwedge can in principle be used to measure gantry couch synchronicity, making use of gantry phase angle differences measured at the stepwedge level transitions (see paragraph 3.2.2). Gantry angle leaf dynamics 41
42 Detector: film Set up: Two films parallel to the rotation plane and separated on either side of the virtual isocenter by 3 cm Interval: annually Tolerance: gantry angles within 1 Description: A delivery sequence is defined that specifies a slice width of 2.5 cm and a pitch of 0.1 for a minimum of 40 rotations. The control sinogram is set to open the middle two leaves _32 and 33_at projections centred at 0, 120 and 240. Using a horizontal line marked on the films during setup, the resulting star pattern can be checked for the correct initial angles at the start of treatment and the ability to reproduce this pattern after 24 rotations. Gantry angle consistency Detector: Exit detector Interval: weekly Tolerance: gantry period: 0.02%, phase shift: 0.7º Description: Use TQA module Stepwedge helical. The stepwedge is positioned on the couch according to the green lasers. The parameter Gantry phase angle measures how accurately the measured rotational data is in phase with the reference data. The phase of the stepwedge attenuation centres is compared to a reference set of centres. From this, the phase angle difference, in degrees, is determined. This method supersedes the method recommended in TG148 (see procedure above: Gantry angle leaf dynamics) only for the gantry angle consistency but not for a measurement of gantry leaf dynamics. The Gantry period parameter measures the consistency of the gantry rotation speed by comparing the number of pulses per rotation to reference values. This parameter will only deviate from the reference value given in units of time, whatever the actual gantry speed is, if the tick fence fails (see the item Tick fence in paragraph 3.2.1). Couch speed uniformity Detector: Exit detector Interval: weekly Tolerance: 0.2% Description: See the description of the Stepwedge static TQA module in section MLC timing of leaf movement 42
43 Detector: Exit detector Interval: weekly Tolerance: flash centre: 5 ms, flash width: 5 ms Description: Measures the timing of leaf movement. See the description of the Stepwedge helical module in section MLC flash centre difference determines the centre of several exposures caused by short MLC flashes. The results are compared to the reference data to determine if the flash centre has shifted (in ms). MLC flash width difference measures the width of each centre of exposure. It verifies that the leaves are open and closed for the correct amount of time (in ms) Miscellaneous aspects Interrupted treatment procedures Detector: film or detector array Interval: monthly Tolerance: 1 mm Description: Position film or array of detectors (f.i. ArcCheck) on the couch. Start treatment. Interrupt treatment at random position. The couch is automatically retracted to the start position. Do not move the film or array of detectors on the couch. Generate a completion procedure and irradiate this procedure. Analyse the abutment region. Abutment should be within 1 mm. The dosimetric error will then be within 6% (Althof et al., 2012). The local MPE should access the suitability of the array of detectors to perform this measurement accurately QA measurement schedule In TQA the user can design his own measurement schedule. The appendix shows the (T)QA schedule recommended by this NCS subcommittee. The abbreviation SWS stands for Step wedge static and SWH stands for Step wedge helical. Some QA items are measured in more than one TQA module. As an example: while monthly measurement would suffice for the Exit-detector-average-signal to Dose 1, this item is addressed daily because the item is part of TQA module Basic Dosimetry, which is performed daily because of the MC1 output measurement. The column at the most right side in the table shows in which TQA modules a parameter is measured. Monitor chamber output and cone shape variation are also addressed in several TQA modules, but with different jaw settings. As an example: in module Daily QA the J48 (5 cm slit) is used to measure the cone shape, but the J7 (1 cm slit) jaw variation is more sensitive 43
44 for position variation of the focus point and the J1 (MVCT slice width) jaw detector output variation provides a clearer indication of jaw motion. See the TQA manual for more information on this type of details. From measured QA items, trend parameters are presented by the TQA application automatically. This is useful in accessing the relevance of a deviation in a single measurement to the long term behaviour of a parameter. For instance the trend parameter MC1 standard deviation of the output, is a measure of output variation consistency. Trend parameters are not described separately in this report. In case no alert levels are known or no alert level is applicable, the alert level is assigned inf, in line with the TQA manual. Some recommendations are based on the experience of this NCS subcommittee. 44
45 4 Dose Calibration 4.1 Calibration in non-reference conditions This paragraph is mainly based on the report of the IAEA/AAPM working group on a new formalism for reference dosimetry of small and non-standard fields (Alfonso et al., 2008) in combination with the code of practice for the absorbed dose determination in high energy photon and electron beams (NCS 18, 2008). The NCS18 formula for the absorbed dose to water at the reference depth in water for a user beam Q in absence of the ionisation chamber is given by formula 4.1. =,,,! (4.1), The absorbed dose to water at the reference depth in water for a user beam Q in absence of the ionisation chamber under reference geometry (field 10 cm x 10 cm at focus-water-distance of 100 cm)., Reading of the electrometer corrected to ambient reference conditions and for the effects of recombination, polarity and the influence of the electrometer,, The calibration coefficient for the absorbed dose to water for a reference photon beam quality Q0 traceable to a primary or secondary standard. Accounts for the effects of the differences between the beam quality Q and the!, reference beam quality Q0. If no KQ is available for the chosen ionization chamber, cross calibration with a chamber with a known KQ in the NCS-18 reference setting, is needed. This formulism cannot be used as such for a Tomotherapy machine because the physical limitations of the machine do not permit a broad 10 cm x 10 cm field. The maximum field size allowed is 5 cm (in longitudinal direction) x 40 cm (in the transverse direction). A maximum distance of 28 cm from isocentre (at 85 cm) to the lowest couch position is possible, so the classical reference distance of 100 cm is reachable, but the geometry does not allow a measurement at the reference depth of 10 cm in appropriate backscatter conditions. In addition; the Tomotherapy machine has no flattening filter: the depth dose differs from the depth dose for the same nominal energy on a gantry-based accelerator. 45
46 In the IAEA/AAPM report (Alfonso et al., 2008), a formalism is described for small static field reference dosimetry, specific for machines unable to set-up a conventional reference field. Since the Tomotherapy machine will be most frequently used in helical mode, the use of a static reference field does not seem the best methodology. Nevertheless, also static Tomotherapy fields will be used for patient treatments when using the direct mode. In this view, measurements in a static reference field will be a valuable part of the routine machine QC. For standardization of composite field reference dosimetry, a plan-class specific reference field is used, recommended to be closer to the patient specific clinical fields. For helical Tomotherapy a composite field means a helical and modulated field. In addition, this calibration procedure for a helical Tomotherapy treatment unit is then integrated in the fluence based planning and delivery methodology. A composite field can be used to link the measured dose for this field to the dose predicted by the planning system. Note: Tomotherapy dose delivery is controlled by time (more specific: ticks of the gantry rotation) and not by monitor units. Therefore, a monitor unit calibration as in conventional linacs is not appropriate. Of course the monitor chamber plays a crucial role in the interlocking and safety system. 4.2 Reference dosimetry in a static field: machine specific reference field The concept of a machine specific reference field (msr) is applicable to machines that cannot establish the conventional reference conditions. Formula 4.2 is applicable for msr dosimetry and is traceable to a 10 cm x 10 cm reference field. For Tomotherapy a 5 cm x 10 cm field is recommended as static msr field (Langen et al., 2010). $"#, "# = $"#, "# $"# "#,,!,! $"#,$ %$ "#, (4.2) The absorbed dose to water at the reference depth in water for a user beam Qmsr and reference field fmsr in absence of the ionisation chamber The electrometer reading of the dosimeter in fmsr corrected for any difference $"# "# between the ambient air conditions affecting the ionisation chamber at the time of measurement and the standard ambient air conditions for which the calibration coefficient applied (temperature, pressure, ion recombination and polarity effects.,, The calibration coefficient for the absorbed dose to water for a reference photon 46
47 beam quality Q0! Accounts for the effects of the differences between the beam quality Q and the, reference beam quality Q0 Factor to correct for differences in condition of field size, geometry, phantom! $"#,$ %$ "#, material and beam quality of the conventional reference field fref and the machine specific reference field fmsr. This factor accounts for differences in response of an ionisation chamber in the fields fref and fmsr and is defined as $"#,$ %$! "#, = +()* +()* &,'()* / -'()* +*.+ +*.+ &,' / -' (4.3) More details on this factor can be found in the paper of Alfonso, Thomas and Sterpin (Alfonso et al., 2008; Edmond Sterpin et al., 2012b; Thomas et al., 2005b). 4.3 Practical implementation of reference dosimetry in a static field: defining =,,, in a Tomotherapy beam First, one has to focus on beam quality. Because of the absence of a flattening filter the energy spectrum of a Tomotherapy beam will be softer. The following recipe can be used to obtain!,! $"#,$ %$ "#, (valid in a 10*10cm beam at SSD=100cm) from a PDD measurement in a 5*10cm field at SSD=85cm. Please be aware that a PDD measurement is used to define the beam quality, in contrast with NCS -18 where TPR20,10 is used. Step 1 Create a 5 cm x 10 cm field using i.e. the basic create function (TomoHD Manual, 2015) on the operation station of the Tomotherapy machine for a welldefined irradiation time. Close the MLC s for the first 10 seconds to allow the beam to stabilize. Step 2 Define the percentage depth dose (PDD) at 10 cm depth in water for this field, SSD 85 cm and position of the chamber corrected for the effective point of measurement: this is the PDD(10)Qmsr. Because this measurement will be performed in an unflattened beam it is important to use a small ionisation 47
Q PDD msr measured in the fmsr to the")

: 2010) %ddq ddq = 1.335805.( %dd(10)qms r) 3 244.493.")
) Figure 4.")


48 chamber. Step 3 Use equation 4.4 to convert the PDD(10)Q PDD msr measured in the fmsr to the PDD PDD(10) in the virtual 10cm x 10cm field (fref) as defined by Thomas (Thomas et al., 2005b) of figure 19 from TG148 (Langen et al., 2010): 2010) %ddq ddq = ( %dd(10)qms r) ( %dd(10)qms r) 2 ) (%dd(10)Qmsr (4.4)) Figure 4.1 (copied figure 19 from TG148): the relationship between Q and Qmsr as measured with an ionisation chamb chamber tabulated in TG51. The values listed in table 4.1 are taken from TG51 (Almond et al., 1999) can be used to substitute the composite factor!,! $"#,,$ %$ "#,. In the TG51 report kq factors are tabulated for different chamber types as function of kq for cylindrical ion ionisation isation chambers commonly used. The tabulated values can be interpolated linearly in Q. Table 4.1 (copied table I from (Langen et al., 2010)). 2010) Values of for photon beams as a function of the beam quality, equivalent to the factor!,! $"#,$ $ %$. "#, 48


")
 for the Exradin A1SL ioni ionisation")


 2011).")

49 PDD(10)x for cylindrical ioni ionisation ation chambers commonly used for clinical reference dosimetry. The tabulated valu values es can be interpolated linearly in PDD(10)x This table includes the value (originally in this table denoted as: kq) as calculated by Thomas (Thomas et al., 2005b) for the Exradin A1SL ioni ionisation chamber. The value for a static 5 cm x 10 cm Tomothera Tomotherapy py beam equals between and for most common cylindrical ionis ionisation ation chambers. For other chambers references can be found (Sterpin et al., 2012; Zeverino et al., 2011) 2011). Remark 1 : when using a solid water phantom from the material provided by Accuray one needs to be aware that at the isocentre,, at 10 cm depth, the use of this solid water accounts for a factor Dw,solid water/ Dw,water =0.995 ± (1SD) as calculated with MC calculations (De Ost et al., 2011) 2011). 49
50 4.4 Practical implementation of reference dosimetry in a static field: defining Step 1, Create a 5 x 10 cm field using for example the basic create function (TomoHD Manual, 2015) on the operation station of the Tomotherapy machine for a welldefined irradiation time. Close the MLC s for the first 10 seconds to allow the beam to stabilize. Step 2 Set up the water phantom and position the ionisation chamber at a distance of 85 cm SSD on a depth of 10 cm water. Allow the chamber to equilibrate at the water temperature. Step 3 Take ionisation readings per time unit at positive and negative polarization voltage of the chamber to define the polarity correction kpol. Take ionisation readings per time unit at high (U2) and low voltage (U1) of the chamber to define the recombination correction ks as described in NCS report 18- appendix 2 (NCS 18, 2008). Valuable information on this topic can also be found in Palmans (Palmans et al., 2010) where the need for a correct determination of the recombination correction is expressed, especially for the ion chambers smaller than the Farmer type chambers.. Step 4 Record pressure and temperature and correct your reading: /01 = Step 5 = 19 (4.5) 1 ;!#! 01!%<%!= (4.6) < Calculate the dose to water per time unit at the depth of measurement: $"#, "# 4.5 Calculate the corrected ionisation chamber reading: $"# "# Step = $"# "#,,!,! $"#,$ %$ "#, (4.7) Reference dosimetry for a composite field: Plan-class specific reference field Secondly the concept of a plan-class specific reference field is used to standardize composite field dosimetry. The plan-class specific reference (pcsr) field is a reference field for a class of combinations of fields in a configuration representing the clinically delivered treatment. The pcsr field must deliver a homogeneous dose to an extended and simple geometrical target volume. 50
51 For Tomotherapy the treatment machine cannot establish a conventional reference field and the dosimetry of the plan-class specific reference field is referred to a machine specific reference field. An extra conversion correction is needed between the msr and the pcsr fields: D@ABC >,?@ABC D@ABC?@ABC = DFBC,DCGD,>,?E!?,?E!?FBC,? D@ABC,DFBC!?@ABC,?FBC (4.8) Factor to correct for the differences between the conditions of field size,! $= #,$"# = #, "# geometry, phantom shape/material and beam quality between fmsr and fpcsr This value is equal to for most commonly used ionisation chambers (NCS 18, 2008). 4.6 Practical implementation of reference dosimetry for a composite field: defining Step 1 HI, HI Take a CT scan of a water equivalent phantom with dimensions large enough in relation to the volume (see step 2) you will treat. The phantom should be scanned without the ionisation chamber present. Step 2 Create a cylindrical target volume in this phantom around and exceeding the active ionisation chamber volume. In TG148 a target volume of diameter 8 cm and 10 cm in length is recommended, together with a 5 cm treatment slit width and a pitch of (Palmans et al., 2010). Step 3 Make a dose plan to generate a uniform dose distribution to this target volume and define the dose to the active volume of the ionisation chamber. Step 4 Place the phantom with the appropriate ionisation chamber on the treatment couch; MVCT-scan the phantom to check the setup. Deliver the plan on the machine. Step 5 Ionization measurements must be collected for the prepared plan. And dose must calculated with D@ABC >,?@ABC With! D@ABC?@ABC =,! $"#,$ %$ "#, DFBC,DCGD,>,?E!?,?E!?FBC,? D@ABC,DFBC!?@ABC,?FBC (static 5 cm x 10 cm field) determined using the recipe described in section 4.3! $= #,$"# = #, "# (4.9) =1.003 for Tomotherapy 5x10cm (Langen et al., 2010). 51

 and for rotational deliveries (middle).")

52 Step 6 Compare calculated and measured output. Step 7 If a systematic deviation is found in the machine specific reference field and the plan class reference field, the Accuray field service engineer or a trained in house engineer must adjust the output and the output measurements must be repeated. Maybe a DCS calibration is necessary afterwards. Figure 4.2 Water phantoms as used for the measurement of the beam output for a static MSR field (left) and for rotational deliveries (middle). The perspex water filled cylindrical phantom allows a couch top-free positioning into the bore of the Tomotherapy system. Right: the cylindrical water phantom positioned on the couch for the plan specific reference field measurements. Dosimetric validation test The standard cylindrical solid water phantom (the so-called cheese phantom) is useful for dosimetric validation. In this phantom A1SL chambers (or any other calibrated chamber that fits) can be placed on various locations in a horizontal or vertical plane. Plans designed to treat on-axis and off-axis cylindrical targets should be generated for each clinically used slit width, using a normal dose grid. The targets must have a significantly larger volume than the sensitive volume of the ionisation chamber. Multiple point dose measurements must be performed in high and low dose regions. Plans should be generated for both helical and direct treatment mode. There is no fundamental difference between the plans generated for dosimetric validation and the pcsr field. Some validation procedures are also generated by Accuray (TomoPhant or TomoDirectPhant). By using these latter plans and corresponding phantoms, we do not use the local IVDT (image value to density table) but the one generated by Accuray. The acceptability criteria for IMRT plans recommended by the NCS (NCS 22, 2013) are 3%/3mm. Audits are a valuable factor in dosimetric validation of a system. It is recommended to participate in local, national or international audits before the treatment unit is used for patient treatments and on regular basis once the system is in clinical use (Alvarez et al., 2016; De Ost et al., 2011; Duane et al., 2006). 52
53 4.7 Recommendations on tolerance limits and Interval Table 4.2 Recommendations Daily Consistency of rotational output using exit 2% detector Weekly Consistency with TPS rotational Output pcsr 3% Monthly Consistency static output with IC 2% Annually Reference dosimetry pcsr field 1% 53
54 5 MegaVolt CT imaging system Overview The MVCT imaging system of the Tomotherapy system uses the linac, which is used for the treatment of the patients, as the source of radiation. For the MVCT image acquisition, the linac runs with a pulse rate of 80 Hz and is slightly detuned. This results in a reduced energy of about 3.5 MeV and a lowered dose rate, depending on the selected pitch (Jeraj et al., 2004). The linac is controlled by the DCS system and furthermore the CT-detector signal is normalized with the signal of the monitor chambers to ensure a constant baseline signal during the scan. The CT detector is located on the opposing side of the ring gantry at a distance of approximately 145 cm, depending on the type of the detector. There are four different types of CT-detectors in the field, all containing xenon filled ionisation chambers, and with 520 to 540 detector channels being in the imaging beam (Chao, 2015). Except for the latest generation of the CT-detectors, which is manufactured by Accuray itself, the radius of the detector is not consistent with the distance from the target, resulting in a defocusing of the detector. This effect results in a typical dip in the central part of the profile, which is accounted for by the normalization of the measured signal with an airscan (section 3.2.2). During an airscan procedure the imaging beam is measured on the detector without any material in the beam. It is recommended to acquire the airscan on a daily basis. For the MVCT scan the beam is collimated by the jaws to an effective slice width of ~4mm (FWHM) at the isocentre (Accuray 2010). The lateral limitation of the beam results in a Field of View (FOV) of 40cm. The image reconstruction algorithm needs 180 of rotation for the reconstruction of one image. Thus, two image slices are generated per full rotation of typically 10 sec. The user can choose to double the number of reconstructed slices per rotation. The slice width will be divided by two, accordingly. The slice width is dependent on the pitch of the selected scan procedure, for example a pitch of 1 results in a couch movement of 4mm during one rotation and therefore one image has a slice thickness of 2mm. Predefined pitches of 1, 2 and 3 are available and can be selected as fine, normal and coarse under the imaging tab at the operator station. Additionally, for each slice thickness the slice separation can be selected to be either the same as the slice thickness, or to be half of it. A smaller slice separation results in a better resolution in the sagittal and coronal images reconstructed from the axial slices. However, for the use of the images in the registration process, the displayed axial MVCT images are interpolated to fit the images from the planning CT scan. A filtered back 54
55 projection algorithm with a 512x512 matrix is used for the reconstruction of the images, resulting in images of the same dimension (Accuray, 2013a). Due to the higher energy of the MVCT compared to a conventional CT scanner, the soft tissue contrast is reduced but still useful for the process of image registration. If materials with a high Z-value are present in the scan region, the resulting artefacts are small compared with those obtained with a kv imaging beam Use of MVCT images The main use of the MVCT images is the registration process with the planning CT, where the patient is set up in the correct position. Furthermore, the anatomy of the patient at the time of treatment is checked. If a change in patient anatomy is observed, the MVCT scan can be used to recalculate dose and adapt the following treatments to the new situation. This process is facilitated by the Tomotherapy Planned Adaptive application (see chapter 7). When materials with a high Z-value are close to the target volume it might be favourable to perform the treatment planning on basis of an MVCT scan, because of the reduced artefacts. In this case the MVCT images can be exported to a third party product for contouring and then be reimported on the Tomotherapy system for the planning process Standard Workflow During the treatment planning process, the positions of the red lasers are set to the markers visible on the planning CT scan. When the patient treatment plan is selected, either manually or via a record-and-verify system, the scan tab is opened and the scan region, the acquisition pitch and the reconstruction interval are chosen. Once the procedure is approved, the gantry starts to rotate and the red lasers move to the positions specified in the treatment plan. In the treatment room the patient is immobilized on the treatment couch and positioned in accordance with the red lasers. After the scan is completed the registration parameters are selected under the Register tab. Normally, the process starts with an automatic registration, where the following parameters need to be selected. First, a density threshold value, which identifies the voxels used for the registration process, is selected. The options are bone (density > 1.1 g/cm³), bone&tissue (density > 0.3 g/cm³) and full image (no threshold). The next selection deals with the resolution of the images during the registration process. The options are superfine (no down sampling), fine (down sampled by a factor of 2 in left-right and anterior-posterior direction) and standard (down sampled by a factor of 4 in left-right and anterior-posterior direction) 55
56 (Accuray, 2013b). Furthermore, the user can chose which degrees of freedom (3 translations and 3 rotations) are considered for the registration. The most frequently used option is to use all translations plus the roll correction (IEC-Y axis), since these corrections can be easily applied by means of a couch translation and gantry rotation. Finally an option to consider the case that the patient is not completely covered by 40cm FOV, called incomplete Field of View can be selected. Once the automatic registration is done, manual corrections are possible. There is no option to limit the region for the automatic registration. Therefore, fine adjustments might be needed since, in general, the focus of the registration should be on the region of the target volume and critical organs at risk. When the registration is approved and applied to the treatment procedure, the red lasers are performing the same movement as the couch with the patient. Therefore the red lasers should again be located on the markers of the initial setup, enabling the operator to check whether the patient has been moved correctly. Once the new position is approved (this can also be done from the control room without checking the lasers), the treatment of the patient can start HU CT number calibration and IVDT check See chapter QA on Planned Adaptive, were the MVCT is used for dose calculation. 5.2 Geometry The further use of MVCT patient images, acquired either for the setup of the patient and/or for adaptive recalculations, depends on a correct geometry in the images. This applies to correct dimensions, correct orientation and correct localization of an imaged object. For the description of the tests it is assumed that the virtual isocentre is linked to the machine isocentre. If the internal procedure is such that the couch height is compensated for the couch sag caused by the patient weight, the associated weight should be placed on the couch top, or a correction in the vertical direction needs to be applied for the evaluation of the image location with respect to the isocentre. Alternatively, the couch height can be set in the bore at the machine isocentre using the green laser which projects a cross through the isocentre from the backend of the bore. 56
57 5.2.1 Orientation Procedure: A phantom with a characteristic shape to clearly identify the left or right side (IEC X), the top or bottom (IEC Z) and start or end (IEC Y) of the phantom is scanned. In the Registration tab of the Operator station and the planned adaptive software, but also in the Dose Planning and in the Patient Transfer application, the correct orientation in the image stack is checked. For the IEC Y direction a sagittal or coronal reconstruction can be used. Parameter and tolerance: The correct orientation of the images should be recorded for every IEC direction. Interval: Annually or after a software update Comment: When a phantom has a symmetry, which makes it difficult to identify the correct orientation, additional markers or objects can be placed in the scanned region of the phantom Scaling, rotation, distortion Procedure: A phantom with well-defined points at well-known distances is scanned with a slice thickness of 2mm (fine, 1mm slice separation). The selected scan range should be long enough compared to the inherent inaccuracy due to the slice thickness. At the operator station the measuring tool in the registration tab can be used to measure the distances of the markers in the scanned image. The markers should cover the image in order to be sensitive for distortions in the image. At least two of the markers should be in a horizontal, or a vertical, configuration. This configuration is checked in the registration tab by the use of the displayed lasers, or the slice indicators. For a well-defined point of the couch, it is checked that the location of the point in the image does not move when scrolling through the acquired images. This way it is checked that the image stack is not rotated around the two axis located in the image plane. A minimal rotation of the image stack around the IEC X axis might occur due to the couch sag. Parameter and tolerance: A set of distances, covering at least every cardinal direction is recorded. The results should be within 1mm. By the use of additional markers, or additional details in the phantom, it should be recorded that the image is free of distortions. The fact that the image stack is not rotated needs to be recorded. Depending on the used phantom and markers, displacement of these markers can be defined, corresponding to certain rotations. Interval: Annually or after a software update. 57
58 Comments: If surfaces and interfaces of phantoms are used instead of markers, the measurements should be performed with well-defined values for level and window in the image. When symmetric positions are measured with respect to the isocentre, this test can be combined with the test for the location of the images relative to the isocentre Location virtual isocentre to machine isocentre Procedure: A marker is placed at the virtual isocentre using the green laser system and a scan with sufficient scan length around the isocentre is performed. The deviation of the marker from the isocentre, displayed in the image by green lines (available in the registration tab on the operator station) is measured. Parameter and tolerance: The deviations in the three cardinal directions are recorded. The results should be within 1mm. Interval: monthly. Comment: Alternatively a larger phantom can be used, if positioned symmetrically to the isocentre. In this case the distances from the displayed isocentre to the edges of the phantom must be identical Overlap red and green lasers Procedure: In their zero position the red lasers should overlap the green lasers. This is checked visually. Parameter and tolerance: The deviations in the three cardinal directions are recorded. The results should be within 1mm. Interval: weekly. 5.3 Image Quality The image quality of the MVCT scans needs to be sufficient for the intended use, such as the registration with the treatment planning CT scan for patient setup, adaptive recalculations, or contouring for StatRT. The reference values for the image quality are usually determined during the ATP of the system. There are two classes of artefacts, which can be present in the MVCT images. The first class contains the so called button artefact and the zipper artefact. For both artefacts correction algorithms are implemented in the Tomotherapy software. The correction only applies to the display of the images on the operator station, while the images stored in the database are 58
59 not corrected. The second class of artefacts is the ring artefact and the streak artefact, which are due to defective parts in the machine and are also well known in CT technology. On occurrence, corrective measures on the machine will be undertaken Noise Procedure: A MVCT scan of a homogeneous, water equivalent phantom with a minimum diameter of 20 cm is acquired. In the slices a large enough ROI (approx.100cm²) is contoured and the standard deviation of the HU values is determined. This will serve as a measure of noise in the image (Meeks et al., 2005). Parameter and tolerance: The standard deviation of the selected ROI is recorded. The value should be in the order of 35 HU, the reference noise level should be determined during or immediately after the ATP process by the MPE. Interval: Monthly. Comment: Since the Tomotherapy-Software does not have a tool for a statistical evaluation of HU values of a ROI, a transfer to a third party software is necessary (e.g. ImageJ). The ROI should be located in a region of the phantom which is free of artefacts and density fluctuations. Specifically the centre of the images should be avoided because of the button artefact Uniformity Procedure: A MVCT scan of a homogeneous, water-equivalent phantom with a minimum diameter of 20 cm is acquired. 5 small ROIs (diameter of approx. 1cm and a length of approx. 10 slices) are contoured, one in the centre and the other four are located in the cardinal directions close to the border of the phantom. The mean value of the HU for each of the 5 ROIs is determined. Parameter and tolerance: The maximum value of the deviation of the peripheral ROIs from the central ROI is recorded. The value should be less than 25 HU, limiting errors in dose computation to < 2.5%. Interval: Monthly. Comment: Since the Tomotherapy-Software does not have a tool for a statistical evaluation of HU values of a ROI, a transfer to a third party software is necessary (e.g. ImageJ). The ROIs should be located in a region of the phantom that is free of artefacts and density fluctuations. Specifically, the exact centre of the images should be avoided because of the button artefact. 59
60 5.3.3 Resolution Procedure: A MVCT scan of a phantom containing a high contrast resolution pattern is acquired. The representation of the high contrast resolution pattern in the images is evaluated. The user decides up to which resolution the pattern is visible. Parameter and tolerance: The size of the detectable object or an equivalent indicator (e.g. lines or rows) is recorded. The vendor specifies an object size of 1.6 mm, which should be detectable (Accuray, 2013c). The reference should be determined during the ATP. Interval: Monthly. Comment: Usually the high contrast resolution plug, which comes with the cheese phantom, is used for this purpose. The resolution specified by the vendor corresponds with the third row of the holes (from large to small). The evaluation of this test is observer dependent. The values for window and level, used for the reference, and the reference images should be available to the observer Contrast Procedure: A MVCT scan of a phantom with a density of approximately 1 g per cm³ containing homogeneous regions with densities slightly different from 1 g per cm³ is acquired. The increments in density should enable the observer to judge which differences in density are detectable in the images. Parameter and tolerance: The density of the plugs (above and below 1 g per cm³), which can be detected in the images, is recorded. The reference should be determined during the ATP. Interval: Monthly and after every software change and after every work on the beam line or the detector. Comment: Usually the cheese phantom with the included density plugs is used for this purpose. The evaluation of this test is observer dependent. The values for window and level, used for the reference, and the reference images should be available to the observer Artefacts Procedure: A MVCT scan of a homogeneous phantom with a sufficient diameter is acquired. The images are inspected for the ring- and streak-artefact. The appearance of the buttonand zipper-artefact is analysed qualitatively. Parameter and tolerance: The images are evaluated for the presence of ring or streak artefacts. The magnitude of the button and zipper artefact is compared with the reference 60
61 images from the ATP. It is recorded that the artefacts have not become more prominent than during ATP. Interval: Monthly and after every software change and after every work on the beam line or the detector. Comment: The artefact correction should be turned off for this test, since the tests should be able to detect a change in the performance of the imaging system. For the button and zipper artefact the values for window and level, used for the reference, and the reference images should be available to the observer. For the ring and streak artefact images with examples should be available to the observer to help identifying the artefacts. 5.4 Dose MVCT scan Although the dose delivered to the patient by the MVCT scan is small compared to the therapeutic dose given during treatment, it is important to ensure that the dose is not higher than reasonably achievable. Doses of less than 3 cgy (typically 1.5 cgy) are specified by the vendor in the centre of the cheese phantom for a scan length of 10 cm Dose per scan Procedure: A phantom containing a calibrated ionisation chamber is placed on the couch and a scan of the region +/- 5 cm from the ionisation chamber is made. This is considered a typical clinical relevant scan length. Accuray specifies a minimum of 7 slices centred around the chamber. The measurement should be performed for the smallest pitch used in clinical routine (scan setting fine ). The setting of the measurement, such as used phantom, ionisation chamber and position of the ionisation chamber and the phantom, should be the same as during the measurement of the reference values. Parameter and tolerance: The dose measured by the ionisation chamber is recorded. The dose should be less than 3 cgy. Interval: Monthly. Comment: The measurement can easily be integrated in the setup process of the individual plan verification measurement. For the exact measurement of the dose delivered by the imaging beam, correction factors for this beam quality would be needed. However, since the dose delivered by the MVCT is about a factor 100 smaller than the prescribed dose per fraction, the percentage deviations in beam energy correction factors are of limited interest. The absolute values of the deviations should 61
62 be recorded. Typical doses delivered to the patient by a MVCT scan are in the range of 1-2 cgy (Shah et al., 2008). 5.5 Patient Setup Registration and positioning The main use of the MVCT is for the correct setup of the patient before the treatment. For this purpose the acquired MVCT scan is registered with the treatment planning CT scan and translational and rotational correction parameters are determined. The translational shifts are applied to the patient by couch movements, supported by the system, while the Rollcorrection (around IEC-Y axis) is applied by a phase shift of the gantry rotation. The other two rotations cannot be corrected by the system and can therefore be excluded from the registration process. The moveable red laser system provides an option to double check the repositioning of the patient. Accurate repositioning of couch and red lasers is essential for a successful treatment of the patient. Procedure: A MVCT scan of a phantom containing multiple well-defined points inside the phantom is acquired. The points should have external markers on the phantom, which are easily detectable in the MVCT scan. If a dedicated phantom with detectable markers inside the phantom is used, the external markers are only needed for the laser and therefore don t need to be detectable in the MVCT scan. The coordinates of the points need to be well known. Reference values can be obtained by the use of the planning kvct scanner. The phantom is positioned on the couch with one of the points (start point) located in the isocentre by using the green laser. The scan region needs to cover one of the other points (target point), which will then be registered to the isocentre. Once the scan is completed, the Registration tab is selected and the display of the lasers is turned on. By using the manual registration option the target point is moved to the isocentre position. If the target point is not detectable itself, this is done with help of the external markers. When this is done, the registration is applied and a treatment procedure is loaded. On the PCP, or the corresponding window at operator station, setup is selected to move the phantom in the registered position. In the treatment room the user verifies that the target point has moved to the isocentre (green lasers) and that the start point is marked by the red lasers. Parameter and tolerance: The shifts, which are determined during registration, are compared with the reference distances between the points. Additionally, the correct movement of the red lasers (to the starting point) and the end-position of the target point (isocentre = green lasers) is recorded. All deviations should be less than 1 mm. 62
63 Interval: Weekly. Comment: If only two points are used, the start and target point should be alternated. The MVCT slices are reconstructed for the positions of the slices of the reference planning CT data set. If markers are not located in a reconstructed slice and therefore difficult to register, it is possible to move the complete data set in IEC-Y direction. Once the correct IEC-X and IEC-Z position are found the correct IEC-Y position must be adjusted Red laser reference point set up The red laser system is used to set up the patient before the start of the MVCT scan. The range of movement in this step is larger than at registration. The coordinates for the lasers are obtained during the planning process, where the lasers are set according to markers on the patient. Although the final setup of the patient is normally determined by the use of the MVCT scan, the red lasers are of particular interest, when patient positioning is performed without a MVCT scan. Procedure: A treatment procedure or a MVCT scan for Patient (or a calibration procedure) with well-defined laser positions is loaded on the operator station. In the treatment room the laser positions relative to the virtual isocentre (green lasers) are measured. Parameter and tolerance: The measured positions are compared with the values stored in the procedure. The deviation should be less than 1mm. Interval: Monthly. Comment: The full range of the lasers (+/- 18 cm) should be tested Rotational setup correction During the registration process not only translational shifts can be detected. It is also possible to detect rotational setup errors. While the rotations around the IEC-X and IEC-Z axis are difficult to account for, it is quite simple to correct for rotations around the IEC-Y axis (roll). This can be performed by a simple offset to the gantry angle of the treatment procedure. This offset angle can be set manually or automatically during the registration process. Procedure: A number of methods can be used to measure the applied roll correction. 1) A procedure with a static beam under a well-defined angle is generated. This procedure is applied to a phantom that is able to detect the gantry angle. In a next step, the phantom is exposed by the same procedure, but this time a representative roll correction is applied in the registration tab. The angle between the two beam lines is measured and compared to the applied correction angle. 2) If available, the TQA Helical Stepwedge procedure can be used 63
64 to detect a shift in the gantry phase by applying a roll correction in the registration tab. See chapter TQA module description. 3) A film located in the treatment plane can be used as a phantom. Angles can be measured mechanically, or by using software tools. Parameter and tolerance: The measured angle between the two beam lines is recorded and compared to the one set under the registration tab. Tolerance is 1º. Interval: Monthly. Comment: The used angles should be in the order of clinically relevant corrections and should be both positive and negative. 64
65 6 Quality assurance of treatment planning system The particularity of the Tomotherapy delivery system makes most of the traditional commissioning tasks for quality assurance of TPS not applicable. To understand the particular issues for Tomotherapy treatment planning quality assurance, adequate knowledge of the various steps involved in the dose delivery computation and treatment preparation processes is required. Several TPSs have now the capability to generate Tomotherapy treatment plans: the original Tomotherapy treatment planning system, Precision from Accuray and RayStation from RaySearch. The treatment planning system under consideration here is the one that has been historically and, until recently, exclusively delivered with the Tomotherapy system. Experience must be gained for the other systems before making recommendations. The first task of this chapter is providing a global overview of the TPS before moving to more practical considerations regarding quality assurance. Some TPS features vary from one version to another. To make the argument precise, information on the version number is given for features not available for all versions. Only versions above number 2 are accounted for in the present document since former versions are no longer installed on existing units. 6.1 Introduction to Tomotherapy treatment planning All Tomotherapy systems follow the same treatment planning workflow for all individual patient/phantom cases through successive panels selected by the user. Before moving to a given panel, all tasks from the previous panels must be properly completed by the user. The various steps involved can be summarized as follows: 1. Image import, replacement of CT imaging couch by Accuray treatment couch. 2. Definition and/or correction of imported target volumes and organs-at-risk. 3. Definition of global treatment planning parameters (patient isocentre (version 4 of HiArt systems, version 1.x and higher for TomoHD)), red lasers positioning, TomoHelical or TomoDirect (version 4 of Hi-Art, version 1 and higher for TomoHD systems), patient Image Value-to-Density Tables (IVDT) selection, pitch, field size, modulation factor. 4. Optimization 5. End of planning (EOP) and fractionation (machine treatment plan generation). 65
66 The second point is beyond the scope of the present report. Red laser positioning is linked to imaging (chapter 5). Quality assurance for IVDT curve will be detailed in chapter 7. The objective of the following subsections is to provide the necessary information for a thorough understanding of the optimization and end of planning processes Static beam model Tomotherapy systems share three gold standard beam models (GS), depending on the brand of the linac and the date of the release of the machine. The original one is for the Siemens linac ( legacy model). The second for the first TwinPeak linac (the TP model) and the third for the TwinPeak+1 linac ( TP+1 model). TP and TP+1 models can be extended to dynamic jaws. Static dose distributions for all three models are very close to each other, as shown in Figure 6.1. For a given configuration of the system, the manufacturer tolerances for reproducing the corresponding GS are: ratio measured/modelled within for 10mm-200mm depths for percent depth-dose. Longitudinal profiles symmetric: ±1% of reference FWHM, and gamma 2% in vertical / 1% FWHM in horizontal (0.1 mm for 1 cm slit). Longitudinal asymmetric: no tolerance on FWHM and gamma 2%/0.5 mm. Lateral (cone) profile: ±1% of reference FWQM and gamma 2%/1mm. However, some model parameters are unitdependent. These include leaf fluence output factors (LFOF) and leaf filters, leaf latencies and jaw fluence output factors (JFOF). Leaf-fluence output factors account for the fact that the output for a single open leaf is not the same as the output for the same leaf but with the adjacent leaves opened. Leaf latencies are approximate measurements of the effect on output of the non-instantaneity of leaf opening/closing (Westerly et al., 2009). Since for all current treatment modalities the treatment couch is moving in the longitudinal direction, the dose is directly proportional to the energy-fluence integrated over the longitudinal direction. Jaw fluence output factors account for fluence reduction due to both field size reduction and partial screening of the source by the jaws (Hundertmark et al., 2011). Partial screening is significant for the 1 cm field (output reduction in the order of 10% (Sterpin et al., 2010)). The 2.5 and 1cm jaw fluence output factors are defined with respect to the 5 cm nominal field output, the latter being shared by all Tomotherapy machines. Deviations from the TPS in output for standard helical deliveries generated by 1 or 2.5 cm fields compared to the one generated by the 5 cm field may need correction to some extent. Fine-tuning of the jaw positions may be performed by applying an offset to the encoder count driving the position of the jaws for every commissioned field size. An additional global output correction may need to be performed until measured and computed dose distributions match for standard helical 66
67 deliveries generated with all commissioned field sizes. However, the measured longitudinal profiles must still match the GS within the aforementioned tolerances. The methodology described in this last paragraph aims to correct small inconsistencies of a few percent in dose output with jaw size. Comparison of PDDs for the three beam models 1 TP TP+1 Legacy 0.9 Figure 6.1 Comparisons of standard beam models for the Siemens linac ( legacy ) and both versions of TwinPeaks linacs ( TP and TP+1 ). Field size is 40x5 cm2 in a water phantom at source-surface distance of 85 cm. Dose profiles are acquired at 1.5 cm depth. Deviations are below 1%/1 mm, with respect to the TP+1 profiles. Dose (normalized) Depth (mm) Dynamic jaws ( TomoEdge) TomoEdge requires specific modelling of the jaws that are of asymmetric widths at the superior and inferior edges of the target volumes. Treatment plans for multiple targets can take advantage of this improved dose gradient if these are separated by at least one field width in the longitudinal direction. 67
68 A beam model is built based on fits to (standardized) measurements of several dose profiles acquired for several jaw positions. Examples of such profiles are shown in Sterpin et al. (Sterpin et al., 2011). The model can then be used for all jaw positions by interpolation and shifting of the fitting functions. It is worth pointing out that the TPS does not optimize jaw motion based on clinical constraints. The trajectory of the jaws is determined before optimization and is based on the contours of the PTV volume as described in Chen (Y. Chen et al., 2011) The Dose computation algorithm dose calculation algorithm of the Tomotherapy TPS is a collapsed-cone convolution/superposition (C/S) model. The principles of the algorithm may be found in Ahnesjo (Ahnesjö and Aspradakis, 1999). For CPU-based Tomotherapy TPS, more specific information on the Tomotherapy C/S algorithm may be found in Lu (Lu et al., 2005) and manufacturer manuals. For the TPS running VoLO (GPU-based), an abundant literature on the physics underlying the C/S algorithm may be found elsewhere ((Chen et al., 2012; Q. Chen et al., 2011; Lu, 2010; Lu and Chen, 2010)). The performance of Tomotherapy C/S in patient inhomogeneities was evaluated in several studies (Ardu et al., 2011; Sterpin, 2015; Sterpin et al., 2009; Zhao et al., 2008) and was found to be at the level one can expect for a collapsed-cone based algorithm. The equivalence in terms of accuracy between clusterbased and GPU-based dose calculation algorithms has been studied in Chen et al. To make the GPU-based dose engine efficient, changes to the C/S algorithm have been performed. The impact of these changes on dose calculation accuracy was studied using MC simulations by Chen et al. (Chen et al., 2012) and demonstrated negligible for homogenous/heterogeneous phantoms and a large set of patient cases. For all optimization modalities and EOP dose calculation, the user may select three different dose calculation grids in the transverse plane, coarse, normal and fine. The y-axis remains at the resolution of the planning data set. In the fine resolution mode, the dose calculation grid is the same as the kvct image. In normal resolution, dose is computed over 4 voxels of the imported kvct image and in coarse resolution, the dose is computed over 16 voxels. Although it is possible to keep the same resolution as the original image (see Tomotherapy user documentation), the imported kvct image is usually down-sampled to the typical 256x256 grid (times the number of slices). However, for very large CT data sets, the user may choose to down-sample down to 128x128 because of computer memory limitations. Users may also consider removing slices using a DICOM editor. It is important here to 68
69 remember that the selection of the dose calculation resolution grid selection will work the same way, whatever the resolution of the kvct image after importation. Therefore, a normal dose grid will compute dose on 128x128 voxels for a 256x256 imported image and on 64x64 voxels for a 128x128 imported image. Therefore, if a normal dose calculation grid is the usual setting in a given centre, we recommend using the fine calculation resolution if the original image was down-sampled down to 128x128 to keep the same overall calculation resolution for both a 256x256 and 128x128 imported KVCT image. The clinical impact of the chosen resolution depends on target volume size and shape, prescription levels and the location of organs-at-risk relative to the target volumes. The dose calculation time scales with the number of voxels TomoHelical delivery Helical Tomotherapy has unique delivery settings due to the combined use of CT architecture and a binary multileaf collimator (MLC). Treatment parameters are the slit width, the pitch and the modulation factor. As mentioned before, three commissioned slit widths are typically available (5, 2.5 and 1 cm). The size of the slits controls both the speed and longitudinal conformity. Everything else being equal, the treatment time is roughly inversely proportional to the selected slit width. Therefore, faster treatment time may be obtained using larger slit widths but at the cost of a degraded longitudinal conformity, except for the superior-inferior dose build towards a target volume due to the dynamic properties of the collimation system as available in TomoEdge. The pitch is defined as the ratio of the couch displacement for one gantry rotation to the slit width. Because of the translation of the couch across the longitudinal field, helical beam junctioning effects may occur (the thread effect), especially off-axis because of the divergence of the beam. Those effects result in ripples in the dose distribution, more or less pronounced depending on the off-axis distance (for a slit width of 2.5, the magnitude of the ripples is limited to 3% for pitches lower than 0.5). Kissick et al (M W Kissick et al., 2005) provided a simple formula from both experimental and theoretical data to minimize the magnitude of those ripples, that is, selected pitches should follow a rule 0.86/n where n is an integer larger than one. A more complete theoretical approach of the thread effect may be found in Chen (M. Chen et al., 2011). Smaller pitches enable less significant thread effect. Therefore, one should consider using smaller pitches for tumours located off-axis if the thread effect is a concern. In versions 4.x and higher, the machine isocentre may be easily moved during treatment planning to minimize the thread effect. More quantitative information may be found in the aforementioned references. 69
70 However, small pitches may lead to shorter leaf opening times since a given transversal slice will be longer within the aperture or slit opening and a voxel within this slice may therefore be exposed during more gantry rotations. Inaccuracies in the modelling of leaf latencies may increase dose inaccuracy for short leaf opening times as shown by Westerly (Westerly et al., 2009). Pitch values should be selected such that the gantry period is higher than 12 s (minimum allowed period). To allow higher pitches without a significant thread effect, the tumour target volume should be placed close to the isocentre of the machine. The modulation factor is defined as the longest leaf opening time divided by the average of all nonzero leaf opening times. Since the modulation factor provided by the user is the maximum one allowed for the optimizer, the final modulation factors obtained at the end of the planning process will, in general, be lower. A higher modulation factor may result in a longer maximum leaf opening time, which is related to the treatment time. On the other hand, a higher modulation factor allows a larger range of beamlet intensity levels to the optimizer. The gantry rotation period is automatically selected by the system as the fastest gantry speed possible to achieve the desired dose prescription. However, there are a few constraints. The gantry period can take values between 12 s (for versions 4.x or versions 1.x on TomoHD) and 60 s. The treatment dynamics may influence outcome for mobile tumours because of the potential interference between beam and patient motions, i.e. the so-called interplay effect. For one single fraction, this effect has been shown to be relatively moderate both theoretically (Kissick et al., 2008; Michael W Kissick et al., 2005) and using 4D Monte Carlo simulations where deviations of maximum 4.4% (D95, single fraction) were observed for a small lung tumour with a large motion amplitude (Edmond Sterpin et al., 2012a; Wanet et al., 2014). The interplay effect can be further minimized using slow scan speeds. Moreover, it tends to average out for multiple fractions. Techniques to ensure regular breathing (e.g. by audiocoaching) may also mitigate the interplay effect Additional specificities of TomoDirect delivery In TomoDirect (only available in version 4 and higher or version 1.x or higher of TomoHD), pitch has no longer a meaning since there is no gantry rotation, although it keeps the same name in the TPS. The pitch here is the couch distance travelled per projection, projection being defined here as the interval of time for each control point of the MLC. The system sets the pitch by default to one tenth of the slit width. The user can also choose several fields with arbitrary gantry angles and attach each one of them to the target volume of his choice. Moreover, the transverse size of the fields is set by default to only cover the target volume 70
71 but can be enlarged by the user (which is useful for breast irradiation). In terms of quality assurance, one major difference with helical delivery is the potential higher sensitivity of treatment accuracy with output stability with gantry position. In continuous gantry rotation, variations in output may cancel each other as long those follow a periodic pattern. For Tomotherapy systems equipped with the Dose Control System (DCS), the static and rotational output is stabilized. The non-rotational nature of TomoDirect makes calculation accuracy more sensitive to the position of the Accuray treatment couch in the kvct image for some angles of the gantry. The TPS warns the user when accuracy may be significantly sensitive to the exact position of the treatment couch. Since it is very difficult to reproduce from planning to treatment the position of the patient with respect to the treatment couch, we do not recommend overruling the TPS warning DCRT For both TomoHelical and TomoDirect, there is the 3DCRT option available. Briefly, 3DCRT is a very simplified IMRT procedure that does not allow interactive optimization. The user can only block some organs at risk, improve homogeneity to target structures and force normal tissue homogeneity (no hot spots). For the latter, an external contour (patient outline) with the label external must be available. The optimization consists of one single iteration. Because of the very unlikely use of this feature in European facilities, the QA of this option is disregarded in the current report Optimization on non-gpu systems When the beam parameters specified above are defined, the user may select the optimization panel, define the constraints and start the optimization process. For current versions up to version 4 and TomoHD systems included, the user can choose between three optimization options: TERMA, beamlet and full scatter. Before moving to EOP (section 6.1.9), the user must perform a get full dose iteration, which calls the same algorithm as in full scatter optimization mode. TERMA optimizes dose distributions fast by disregarding during the dose computation process the convolution of the TERMA with the energydeposition kernels. However, such an optimization scheme does not provide acceptable accuracy of the dose distributions and can only be used as an initial guess or for a very fast optimization for emergency/palliative cases as is the case in the StatRT. The most typical optimization workflow starts with the beamlet optimization mode. The workflow is illustrated in Figure 6.2. In the beamlet optimization mode, the impinging fluence, modulated by the MLC, is modelled as beamlets (single element of a beam used 71
72 during optimization) around the control points of the MLC (projections). The beamlets intersecting the target volumes, with an initial weight of unity, are pre-computed in a range of a fraction of an hour to several hours depending on the computer hardware installed and the size of the PTV. When the pre-computation is completed, fast optimization (typically a few seconds per iteration) of the weights of each beamlet may be performed. Depending on the versions of the software, dose calculation and beam modelling can be different. Table 6.1 summarizes some of the differences between versions that may impact planning quality and user experience. In version 2.x, beamlets are compressed and truncated (low dose threshold), that is, energy is not strictly conserved. The compression of the beamlets is needed for storage. Moreover, the MLC is assumed to be ideal without taking into account tongue-and-groove and LFOF. Versions 3.x include more information in the compressed beamlets while versions 4.x use a beamlet compression technique that conserves the mean energy. Moreover, LFOF and a square leaf filter are included during beamlet optimization in versions 4.x for Hi-Art and versions 1.x for TomoHD. Optimization in full-scatter mode computes the dose for all iterations like a get full dose iteration. It is seldom used, because of the significant time needed for each iteration (typically around 2 min on most systems around the year 2015). The level of complexity of the full dose computation changed significantly with the versions, as summarized in Table 6.1. In versions 2.x, MLC details were not taken into account implicitly during dose calculation in full scatter. However, the full beamlet information is used. This results in a higher dose to all structures. Dose is renormalized to match the prescription point for the target volume. However, the user may still notice an, usually small, change of DVHs between the final beamlet optimization iteration and a get full dose iteration with a slight modification of the dose to critical structures. In versions 3.x, the MLC is still assumed as ideal during a get full dose iteration. Starting from version 4.x,TomoHD systems with a mint drive installed, all the available MLC details are implicitly included during dose calculation through a leaf filter that contains tongue-and-groove, realistic penumbra and LFOF information. In versions 4.1.x and later, the gantry rotation is super sampled with 153 positions of the gantry per rotation instead of 51. Taking into account more gantry positions may have a significant impact for small off-axis targets with small modulation factor (Edmond Sterpin et al., 2012c; Tudor and Thomas, 2013). Before version 4.1.x, the effect of continuous rotation, if any, may only appear during DQA with differences between measurements and C/S, especially at the edges of the tumour volume. In version 4.1.x and later, degradation of the DVH may occur after a get full dose iteration because of the super sampling of the gantry positions. 72
73 Table 6.1 Summary of relevant features for different versions of the TPS software for treatment plan optimization and dose calculation (CPU systems). Version 2.x Version 3.x Version 4.0.x Version 4.1.x and up Version TomoHD 1.x and up Beamlet pre-computation Compression and truncation Compression and truncation (more information) Compression with mean energy conservation Beamlet iteration Ideal MLC LFOF (square leaf-filter) Get full dose - full scatter iteration No MLC details End-of-planning Remove small leaf opening times. Additional MLC details (including leaf latencies) in procedure sinogram Full MLC modelling (leaf-filter) Full MLC modelling (leaffilter). 153 gantry angles Remove small leaf opening times. MLC details implicitly included. Leaf latencies incorporated in procedure sinogram 73
. One iteration over ten is performed in full scatter mode, with 153 gantry angles.")
74 6.1.8 Optimization on GPU-systems (VoLO) In GPU-systems (Chen et al., 2012; Lu, 2010), the workflow is essentially the same, except that there is no beamlet pre-computation anymore. Nine iterations over ten are computed using a fast pencil-beam algorithm (Lu and Chen, 2010). One iteration over ten is performed in full scatter mode, with 153 gantry angles. For a wide set of target sizes and off-axis positioning, this ensures that discretization of gantry motion in the TPS has no significant impact on accuracy (Hardcastle et al., 2012; Edmond Sterpin et al., 2012c; Tudor and Thomas, 2013). Following this workflow, the get Full Dose step will therefore bring no modification to the dose calculation obtained after the last full scatter iteration. TomoEdge is available only on systems equipped with VoLO dose calculation algorithm. It is important to note that convolution kernels are not stored as such like in CPU systems but fitted with two exponentials. Chen et al (Chen et al., 2012) has shown that this approximation does not impact significantly dose calculation accuracy. Precomputa on of beamlets Beamlet mode itera on No Optmiza on accepted? Yes Get Full Dose Plan accepted? Yes End-of-planning Figure 6.2 Typical workflow of treatment plan optimization and plan acceptance for non-gpu Tomotherapy TPS 74
75 6.1.9 End-of-planning (EOP) During EOP, the TPS performs two operations. Treatment fractions are generated ( fractionation ) and final dose calculation is performed. During fractionation, the gantry period is actually determined. An illustration of the sequences performed during EOP is shown in Figure 6.3, with the specificities of each version of the TPS software. In all versions, the EOP dose calculation performs most of the operations of the get full dose but after removing very small leaf opening times (< 20 ms) from the sinogram. This may result in minor modifications of the DVHs, usually a slight decrease of dose to some volumes. In the EOP process, procedure sinograms are created from optimization sinograms. The procedure sinograms correct for most of the MLC details not included during optimization. In versions 2.x and 3.x, the MLC was assumed as ideal during optimization. During fractionation, T&G and LFOF information are included in the sinogram in such a way that the MLC will effectively reproduce the ideal behaviour assumed during optimization. On the other hand, such operations are not necessary for versions 4.x and TomoHD systems since MLC details were already included during the get full dose operation. One last effect to take into account is the leaf latencies. Leaf latencies are modelled in the Tomotherapy TPS by assuming the relationship between the actual and planned leaf open times is linear. The exact nature of this relationship is empirically determined by using the MVCT detectors to measure actual leaf open times as a function of programmed leaf open times for eight MLC leaves at projection intervals ranging from 200 to 1000 ms and between 10-90% of the total projection interval. The use of a larger (than the minimal) gantry period (can be accomplished by choosing a larger pitch), increases the fidelity of leaf openings by increasing the range of leaf open times that fall in the linear region of the latency curve. A large number of small leaf open times give rise to dose inaccuracies which can be measured in a DQA measurement (Westerly et al., 2009). Leaf latencies corrections can only be computed during fractionation because the final gantry rotation period must be known to apply the correction. In versions 2.x and 3.x, leaf latencies are not taken into account during final dose calculation. As it was the case for other MLC details, the leaf latency correction is included in the procedure sinogram such that during actual treatment, the MLC effectively reproduces the ideal behaviour as assumed during optimization and EOP. In version 4.x and TomoHD systems, it is different. EOP computes dose distributions directly from procedure sinograms. Hence, EOP dose includes corrections for leaf latencies implicitly during dose calculation. However, the operation is neutral in terms of dose distributions. Leaf latency correction is performed to create the procedure sinogram and the inverse of the same 75
 may be reflected in the dose")
76 correction is applied during EOP. However, since the procedure sinogram can now directly be used for dose computation, a change in leaf latencies (because of a replacement of the MLC, for instance) may be reflected in the dose distributions. This will unlikely happen during the preparation of a treatment (the MLC data should change between get full dose operation and EOP), but may occur if a DQA dose calculation is performed days after the preparation of the treatment. This has the advantage that a user may analyse the effect of a change in leaf latencies parameters on the dose distributions using the DQA tool provided (see paragraph 3.1 and 6.2.2). Finally, another minor difference between EOP and get full dose for all versions is the computation of dose in the air surrounding the patient body contour. Therefore, isodose curves appear outside the body volume, which is not the case for dose distributions obtained during optimization. Versions 2.x and 3.x Versions 4.x Op miza on sinogram (no MLC details included) Op miza on sinogram (MLC details included) Frac ona on (gantry period) Frac ona on (gantry period) Small leaf openings removed, leaf latencies correc on Small leaf openings removed Procedure sinogram Dose calcula on Leaf latencies inverse correc on, implicit account of MLC details Inclusion of MLC details, leaf latencies correc on Procedure sinograms and genera on of delivery procedures Dose calcula on and genera on of delivery procedures Figure 6.3 Sequence of operations performed during the EOP process depending on the version of the Tomotherapy TPS. 76
77 6.2 Quality assurance of Tomotherapy treatment planning For Tomotherapy the philosophy is to tune each new machine to the gold standard. Still, proper quality assurance needs to be performed carefully, both globally and patient-bypatient kvct image and IVDT The consistency of CT information throughout the CT acquisition, contour delineation, treatment planning and treatment delivery processes must be guaranteed as for any other TPS. Table 3.2 of TG-53 (Fraass et al., 1998) lists image information consistency tests that should be performed. Information may also be found in NCS report 15 (Netherlands Commission on Radiation Dosimetry, 2005). A well-defined phantom may be used for this task. Hounsfield units, number of pixels, pixel sizes, slice thickness and image size must be verified. Geometrical location and image orientation consistency between CT scanner and the TPS must be ensured as well for all allowed scan orientations, such as head first supine, feet first supine, head first prone and feet first prone. The transfer of contours and structures from third-party software must be checked thoroughly. It can be performed using a phantom with structures of known sizes and locations. The conversion of CT number (Hounsfield Unit) to mass density can be performed using the proper IVDT. IVDT uses linear interpolation between known couples HU - mass densities. Important is to insert a proper value for the HU value for air to avoid reconstruction artefacts in the outer regions of the FOV. Those couples may be acquired on a given CT scanner with the standard cylindrical Solid Water phantom provided with every Tomotherapy unit with the inserts of different densities (provided in the QA package). The consistency between the CT (or MVCT) scanner procedure used for image acquisition and the IVDT selected for treatment planning must be ensured for every patient. The uncertainties of the actual densities of the inserts and the interpolation may cause discrepancies between the converted mass density and the actual value close to water. Since the patient is mainly a water-like medium, this may cause differences between computed and delivered dose distributions that cannot be detected during quality assurance of dose distributions in a homogeneous phantom. Ideally, a water point (mass density of 1 g/cm3) should be defined with the best accuracy achievable. One way to perform this operation is to scan a rectangular water tank filled with water. Currently Tomotherapy systems are shipped with a real water insert for the Cheese Phantom. The obtained HU number can then be associated with a mass density of 1 g/cm3. When acquiring the IVDT curve with the standard cylindrical Solid Water phantom with multiple inserts of various 77
78 densities, we do not recommend using inserts with densities close to water (within ±100 HU). For a detailed description see chapter All tests related to kvct geometry should be performed annually and after an upgrade and/or an update of the system related to CT acquisition and transfer General dosimetric validation and QA Tomotherapy TPS implicitly generates IMRT plans. The manufacturer implemented a QA module into the TPS called DQA ( Delivery Quality Assurance ). This module allows the user to compute dose distributions with the same set of treatment plan parameters, like sinogram, jaw settings, couch speed, gantry period etc, used during the planning phase, with a phantom of user s choice. The standard cylindrical Solid Water phantom distributed with each Tomotherapy unit allows placing films and ionisation chambers in various positions. Other phantoms from other vendors (for a list see chapter 3.1) are also well suited for treatment planning verification. Measured and computed dose distributions may be compared for ionisation chamber measurements or after film processing in the DQA module. Gamma-analysis of differences between computed and measured dose distributions may be performed as well. For general dosimetric QA of the TPS, one may use the standard treatment plans generated by the vendor made on the cheese phantom (former called TomoPhant 5 sets ), with a cylindrical dose distribution on-axis and off-axis for all the commissioned field widths. Similar standard treatment plans may be generated for TomoDirect and TomoEdge plans for all commissioned field widths. The user may also define other treatment plans to his convenience, with on-axis or off-axis targets and various sizes. However, for general dosimetric QA, it is recommended to use simple geometries with homogeneous doses on sufficiently large volumes (i.e. much larger than the size of the ionisation chamber) to avoid strong influence of the position of the detectors in the homogeneous region. More extreme configurations like targets close to the phantom surface (within build-up, build-down regions) should be avoided. A normal or fine calculation grid resolution should be chosen. Ion chamber measurements should be performed in high-dose and low-dose regions. For verification of dose-gradients, films are better suited. For the homogeneous dose regions, during commissioning of the machine, an acceptance criterion of 3% for TomoHelical deliveries and 4% for TomoDirect deliveries in homogeneous regions are recommended. With DCS enabled, the output of TomoDirect is more stable for all angles and thus the recommended tolerance is also 3%. Any systematic deviation from these acceptance criteria during daily, monthly or annual checks should be investigated. A difference of more than 5% 78
79 requires an immediate action. In high dose-gradients, a 3 mm spatial agreement criterion is recommended as stated by Van Dyk (Van Dyk, 2008; Van Dyk et al., 1993) and TG-119 report (Ezzell et al., 2009). Dosimetric verification of helical standard treatment plans should be performed weekly for one configuration (2.5 cm field size, off-axis target) and after any upgrade/update of the TPS for all commissioned field sizes. A modification of the MLC should be followed by a dosimetric validation for all commissioned fields to check proper accounting for newly generated MLC and leaf latencies data. In that case, new optimization and generation of the treatment plans or the use of the Transfer application (chapter 3.2.5), should be performed to force the sinograms to take into account modifications of MLC data. Measured differences between procedures generated with the old MLC model and the new treatment plans should be within tolerances to ensure consistency of treatment delivery for patients currently undergoing their therapy. The number of procedures selected to undergo this additional QA is at the discretion of the MPE. At the time of the present report, there is treatment planning QA specific to the TomoEdge feature. The latter is verified in regular plans by checking the penumbra in the longitudinal direction. Research is welcome to design QA tests of the treatment planning system that would be sensitive and specific to the modelling of the jaws. The accuracy of the C/S algorithm regarding inhomogeneity corrections should be assessed as well. Anthropomorphic or homemade phantoms are suited for that purpose. Several examples of inhomogeneous phantoms and potential test configurations may be found in literature (Ardu et al., 2011; Zhao et al., 2008) Patient-specific delivery QA (DQA) For patient-specific DQA, there is no significant difference in the methodology than the one described in Figure 6.4. However, since generated dose distributions are often more complex than in standard treatment plans ( TomoPhant 5 sets ), the acceptance criteria should be adapted. It has been historically recommended to perform patient specific QA with measurements for each patient-plan. This requirement involves a significant workload, which may be more difficult to justify for some centres that observe no significant deviations between planned and measured dose distributions for years of operation. Thus, other approaches might be considered like a random selection of the treatment plans subject to QA and also the introduction of software-based patient specific QA (Handsfield et al., 2014; Siochi et al., 2013). Accepted criteria provided in literature for IMRT plans should also be used for Tomotherapy. Gamma analysis with acceptance criteria 3% in dose and 3 mm in distance (3%/3mm), 79
80 global dose difference, are often recommended in literature (Ezzell et al., 2009; NCS 22, 2013). Venselaar et al (Venselaar et al., 2001) proposed also a 4%/3 mm criterion in high dose regions and high-dose gradients, respectively, and a 5% tolerance in low dose regions. From various publications and the experience of the NCS subcommittee, the recommended tolerance for chambers placed in homogeneous regions is 3% of prescribed dose. Gammaanalysis comparing computed and measured dose distributions using film should be performed with a 3%/3 mm criteria with a passing rate of 90%, using at least a normal calculation grid resolution. The average gamma value is also a good metric for quantifying differences between measured and calculated dose distributions. We recommend an average gamma value below 0.5 (or preferably 0.3). Up to version 5.x, it is not possible to define in the DQA a ROI for gamma-analysis. Therefore, points not relevant for evaluating treatment plan quality (e.g. points outside phantom geometry) are taken into account. A visual inspection of gamma-results may determine if points failing gamma-test are originating mostly from those outlying points. Ideally, third-party software where ROIs can be defined should be used. Film dose may be scaled to the value obtained with ionisation chamber readings. Another method for normalization of film dose was described by Thomas (Thomas et al., 2005a), which can be implemented as long ionisation chamber readings shows acceptable deviations in homogeneous regions. For arrays, one could use acceptance criteria from the following references (Geurts et al., 2009; Jursinic et al., 2010; Van Esch et al., 2007; Xu et al., 2010). Discrepancies larger than 5% for point measurements in homogeneous regions should lead to immediate investigation before patient treatment. Discrepancies higher than 3% but below 5% and gamma-passing rate below 90% should be investigated but the treatment may be started/continued, at the discretion of the physicist and/or physician. The decision depends mainly on the position of the chambers with respect to dose distribution and the number of readings out of tolerance. Visual inspection of comparisons of measured and computed dose profiles may also help diagnosis. The discrepancies may have several origins: phantom setup errors, chambers placed close to high dose-gradients, machine output stability, machine output drift, energy drift, thread effect etc. As mentioned in section 6.1.5, dose calculation accuracy versus measurements may be compromised by small leaf-opening times (small pitches). A re-optimization of the treatment plan with a higher pitch might be worth doing if all aforementioned potential issues were not the cause of the considered discrepancy. It is important to determine if the discrepancies observed are either general or specific to the patient treatment plan. The standard treatment plans mentioned in Figure


81 may be used for that purpose. A verification of machine output using an msr static field is also to be considered if the deviations with standard treatment plans are out of tolerances. Figure Workflow for general dosimetric QA and patient patient-specific specific QA. Solid lines refer to action when QA tests succeed while broken lines correspond to unsuccessful tests. More than 5% dose errors in homogeneous dose regions requires immediate action. When standard standar d treatment plan DQA fails by more than 5%, all treatments should be delayed until the source of discrepancies is corrected. 81
Tomotherapy Physics. Machine Twinning and Quality Assurance. Emilie Soisson, MS
 Tomotherapy Physics Machine Twinning and Quality Assurance Emilie Soisson, MS Tomotherapy at UW- Madison Treating for nearly 5 years Up to ~45 patients a day on 2 tomo units Units twinned to facilitate
IMRT and VMAT Patient Specific QA Using 2D and 3D Detector Arrays
 IMRT and VMAT Patient Specific QA Using 2D and 3D Detector Arrays Sotiri Stathakis Outline Why IMRT/VMAT QA AAPM TG218 UPDATE Tolerance Limits and Methodologies for IMRT Verification QA Common sources
Quality assurance of a helical tomotherapy machine
 INSTITUTE OF PHYSICS PUBLISHING Phys. Med. Biol. 49 (2004) 2933 2953 PHYSICS IN MEDICINE AND BIOLOGY PII: S0031-9155(04)71892-8 Quality assurance of a helical tomotherapy machine J D Fenwick 1,2,WATomé
TG-148 overview. Introduction. System Overview. System Overview. QA for Helical Tomotherapy: Report of the AAPM Task Group 148. Conflict of Interest:
 QA or Helical Tomotherapy: Report o the AAPM Tas Group 148 Members: Conlict o Interest: r. John Balog owns TomoTherapy stoc. Katja Langen (Co-chair) Nio Papaniolaou (Co-chair) Walter Grant Richard Crilly
THE WIRELESS PHANTOM PERFORM ACCURATE PATIENT QA IN LESS TIME THAN EVER!
 THE WIRELESS PHANTOM PERFORM ACCURATE PATIENT QA IN LESS TIME THAN EVER! Confidence in complex treatments Modern radiation therapy uses complex plans with techniques such as IMRT, VMAT and Tomotherapy.
PET-CT in Radiation Treatment Planning
 PET-CT in Radiation Treatment Planning TA van de Water, Radiotherapeutic Institute Friesland, Leeuwarden JA van Dalen, Isala, Zwolle ACKNOWLEDGEMENTS A. van der Schaaf (University of Groningen, University
MapCHECK 2 & 3DVH. The Gold Standard for 2D Arrays
 MapCHECK 2 & 3DVH The Gold Standard for 2D Arrays Your Most Valuable QA and Dosimetry Tools THE GOLD STANDARD FOR 2D ARRAYS The MapCHECK 2 is the world s most selected independent 2D measurement array.
MapCHECK 2 & 3DVH The Gold Standard for 2D Arrays
 MapCHECK 2 & 3DVH The Gold Standard for 2D Arrays Your Most Valuable QA and Dosimetry Tools THE GOLD STANDARD FOR 2D ARRAYS The MapCHECK 2 is the world s most selected independent 2D measurement array.
TOMOHD. Product Specifications
 TOMOHD Treatment System Product Specifications 1. Complete Treatment System Dimensions Height Width Length Weight 8 ft., 3.25 in. (252.1 cm) 9 ft., 2.50 in. (280.6 cm) 15 ft., 2.25 in. (463.0 cm) 10,000
ImPACT. Information Leaflet No. 1: CT Scanner Acceptance Testing
 ImPACT Information Leaflet No. 1: CT Scanner Acceptance Testing Version 1.02, 18/05/01 CONTENTS: 1. SCOPE OF LEAFLET 2. GENERAL PRINCIPLES OF ACCEPTANCE AND COMMISSIONING 2.1 PHANTOMS 2.2 EXPOSURE AND
Table of Contents. About AQUA
 User Manual About AQUA Table of Contents 1 About AQUA... 6 1.1 Radiation Therapy... 6 1.1.1 Workflow manager... 6 1.1.2 Reports... 7 1.1.3 Tests... 7 1.1.4 Many Ways to Work... 7 1.2 Technology... 7 1.3
DAILY LINAC QA BEAM QA
 BEAM QA DAILY LINAC QA The QA BeamChecker Plus allows for fast, reliable, and uncomplicated daily QA of Varian, Elekta, Siemens, and Accuray Treatment Machines. The QA BeamChecker Plus is specifically
IAEA-TECDOC-1583 Commissioning of Radiotherapy Treatment Planning Systems: Testing for Typical External Beam Treatment Techniques
 IAEA-TECDOC-1583 Commissioning of Radiotherapy Treatment Planning Systems: Testing for Typical External Beam Treatment Techniques Report of the Coordinated Research Project (CRP) on Development of Procedures
IMSURE QA SOFTWARE FAST, PRECISE QA SOFTWARE
 QA SOFTWARE FAST, PRECISE Software for accurate and independent verification of monitor units, dose, and overall validity of standard, IMRT, VMAT, SRS and brachytherapy plans no film, no phantoms, no linac
ph fax Deming Way Middleton WI USA
 www.standardimaging.com 800-261-4446. ph 608-831-0025. fax 608-831-2202 3120 Deming Way Middleton WI 53562-1461 USA 2007 Standard Imaging, Inc. 1239-21 (03.07) beam qa LINAC AND TOMOTHERAPY QA The NEW
Quick Reference Datasheet For All RIT113 Packages
 Quick Reference Datasheet For All RIT113 Packages For Rotational Therapies, IMRT & TG142 Highlights and selected product information only. A complete TG142 brochure is available. For more information on
Dynalog data tool for IMRT plan verification
 Dynalog data tool for IMRT plan verification Poster No.: R-0051 Congress: 2014 CSM Type: Scientific Exhibit Authors: V. Sashin; FOOTSCRAY/AU Keywords: Computer applications, Radiation physics, Experimental,
ADVANCING CANCER TREATMENT
 The RayPlan treatment planning system makes proven, innovative RayStation technology accessible to clinics that need a cost-effective and streamlined solution. Fast, efficient and straightforward to use,
TomoTherapy Related Projects. An image guidance alternative on Tomo Low dose MVCT reconstruction Patient Quality Assurance using Sinogram
 TomoTherapy Related Projects An image guidance alternative on Tomo Low dose MVCT reconstruction Patient Quality Assurance using Sinogram Development of A Novel Image Guidance Alternative for Patient Localization
Raising the Bar in IMRT QA
 MapCHECK 2TM Raising the Bar in IMRT QA The leader in quick and precise measurement of modulated radiotherapy beams Benefits Proven solution for film-less rotational delivery and IMRT QA - More than 1500
CLASS HOURS: 4 CREDIT HOURS: 4 LABORATORY HOURS: 0
 Revised 10/10 COURSE SYLLABUS TM 220 COMPUTED TOMOGRAPHY PHYSICS CLASS HOURS: 4 CREDIT HOURS: 4 LABORATORY HOURS: 0 CATALOG COURSE DESCRIPTION: This course is one of a three course set in whole body Computed
Clinical implementation of photon beam flatness measurements to verify beam quality
 JOURNAL OF APPLIED CLINICAL MEDICAL PHYSICS, VOLUME 16, NUMBER 6, 2015 Clinical implementation of photon beam flatness measurements to verify beam quality Simon Goodall, a Nicholas Harding, Jake Simpson,
Volumetric Modulated Arc Therapy - Clinical Implementation. Outline. Acknowledgement. History of VMAT. IMAT Basics of IMAT
 Volumetric Modulated Arc Therapy - Clinical Implementation Daliang Cao, PhD, DABR Swedish Cancer Institute, Seattle, WA Acknowledgement David M. Shepard, Ph.D. Muhammad K. N. Afghan, Ph.D. Fan Chen, Ph.D.
FAST, precise. qa software
 qa software FAST, precise Software for accurate and independent verification of monitor units, dose, and overall validity of standard, IMRT, rotational or brachytherapy plans no film, no phantoms, no linac
7/31/2011. Learning Objective. Video Positioning. 3D Surface Imaging by VisionRT
 CLINICAL COMMISSIONING AND ACCEPTANCE TESTING OF A 3D SURFACE MATCHING SYSTEM Hania Al-Hallaq, Ph.D. Assistant Professor Radiation Oncology The University of Chicago Learning Objective Describe acceptance
Disclosure. Outline. Acknowledgments. Ping Xia, Ph.D., Page 1. LINAC and MLC QA for IMRT. Received research support from Siemens Medical Solutions
 LINAC and MLC QA for IMRT Ping Xia, Ph.D., Department of Radiation Oncology Disclosure Received research support from Siemens Medical Solutions University of California San Francisco Therapy Series (SAM)
INTERNATIONAL STANDARD
 INTERNATIONAL STANDARD IEC 60601-2-44 2001 AMENDMENT 1 2002-09 Amendment 1 Medical electrical equipment Part 2-44: Particular requirements for the safety of X-ray equipment for computed tomography Amendement
SPECT QA and QC. Bruce McBride St. Vincent s Hospital Sydney.
 SPECT QA and QC Bruce McBride St. Vincent s Hospital Sydney. SPECT QA and QC What is needed? Why? How often? Who says? QA and QC in Nuclear Medicine QA - collective term for all the efforts made to produce
Analysis of Radiation Transport through Multileaf Collimators Using BEAMnrc Code
 American Journal of Biomedical Engineering 216, 6(4): 124-131 DOI: 1.5923/j.ajbe.21664.3 Analysis of Radiation Transport through Multileaf Collimators Using BEAMnrc Code Ankit Kajaria 1,*, Neeraj Sharma
3D SCANNER. 3D Scanning Comes Full Circle. Your Most Valuable QA and Dosimetry Tools
 3D SCANNER 3D Scanning Comes Full Circle Your Most Valuable QA and Dosimetry Tools BETTER OUTCOMES THROUGH TECHNOLOGY The 3D SCANNER is different by design. 3D SCANNER has been developed from the ground
RITtrend allows you to effectively manage all your physics QA data in one powerful and customizable package.
 So much is asked of medical physicists these days We Can Help Automated Radiation Therapy Phantom Analysis in Seconds QC for Therapy OBI s and CT simulators. Radia s Catphan/OBI module performs analysis
Delta 4 PT. True Volumetric Pre-treatment Verification. The difference is clear
 Delta 4 PT True Volumetric Pre-treatment Verification The difference is clear ScandiDos innovators in advanced volumetric dosimetry solutions ScandiDos ScandiDos is the innovative company that introduced
Facility Questionnaire PART I (General Information for 3DCRT and IMRT)
") Facility Questionnaire PART I (General Information for 3DCRT and IMRT) The following items are required before you can enter cases on any RTOG protocol that requires data submission to the Image-Guided
Facility Questionnaire PART I (General Information for 3DCRT and IMRT) The following items are required before you can enter cases on any RTOG protocol that requires data submission to the Image-Guided
8/2/2017. PerFRACTION from Sun Nuclear Automated Transit Dosimetry for In-Vivo QA
 PerFRACTION from Sun Nuclear Automated Transit Dosimetry for In-Vivo QA Jennifer R. Clark, M.S., DABR Conflict of Interest Statement: I am an employee of Sun Nuclear Corporation Outline: Platform overview
Initial Clinical Experience with 3D Surface Image Guidance
 Initial Clinical Experience with 3D Surface Image Guidance Amanda Havnen-Smith, Ph.D. Minneapolis Radiation Oncology Ridges Radiation Therapy Center Burnsville, MN April 20 th, 2012 Non-funded research
Thank-You Members of TG147 TG 147: QA for nonradiographic
 Thank-You Members of TG147 TG 147: QA for nonradiographic localization and positioning systems Twyla Willoughby, M.S. Medical Physicist Clinical AAPM Meeting March 2013 Department of Radiation Oncology
Automated Image Analysis Software for Quality Assurance of a Radiotherapy CT Simulator
 Automated Image Analysis Software for Quality Assurance of a Radiotherapy CT Simulator Andrew J Reilly Imaging Physicist Oncology Physics Edinburgh Cancer Centre Western General Hospital EDINBURGH EH4
Preface. Med. Phys. 35(9), , Mechanical QA. Radiation Survey Mechanical tests Light radiation Table, Collimator, Gantry Jaws.
, , Mechanical QA. Radiation Survey Mechanical tests Light radiation Table, Collimator, Gantry Jaws.") AAPM-SAM-2012-Das (1) Beam Data Collection and Commissioning for Linear Accelerators: Technical Considerations and Recommendations Preface Indra J. Das, PhD, FAAPM, FACR, FASTRO Department of Radiation
AAPM-SAM-2012-Das (1) Beam Data Collection and Commissioning for Linear Accelerators: Technical Considerations and Recommendations Preface Indra J. Das, PhD, FAAPM, FACR, FASTRO Department of Radiation
New Technology in Radiation Oncology. James E. Gaiser, Ph.D. DABR Physics and Computer Planning Charlotte, NC
 New Technology in Radiation Oncology James E. Gaiser, Ph.D. DABR Physics and Computer Planning Charlotte, NC Technology s s everywhere From the imaging chain To the planning system To the linac To QA..it..it
C a t p h a n / T h e P h a n t o m L a b o r a t o r y
 C a t p h a n 5 0 0 / 6 0 0 T h e P h a n t o m L a b o r a t o r y C a t p h a n 5 0 0 / 6 0 0 Internationally recognized for measuring the maximum obtainable performance of axial, spiral and multi-slice
Design and performance characteristics of a Cone Beam CT system for Leksell Gamma Knife Icon
 Design and performance characteristics of a Cone Beam CT system for Leksell Gamma Knife Icon WHITE PAPER Introduction Introducing an image guidance system based on Cone Beam CT (CBCT) and a mask immobilization
Code of practice: Create a verification plan for OCTAVIUS Detector 729 in Philips Pinnacle³
 Technical Note D655.208.03/00 Code of practice: Create a verification plan for OCTAVIUS Detector 729 in There are basically three ways to carry out verification of IMRT fluences. For all options, it is
Slide 1. Technical Aspects of Quality Control in Magnetic Resonance Imaging. Slide 2. Annual Compliance Testing. of MRI Systems.
 Slide 1 Technical Aspects of Quality Control in Magnetic Resonance Imaging Slide 2 Compliance Testing of MRI Systems, Ph.D. Department of Radiology Henry Ford Hospital, Detroit, MI Slide 3 Compliance Testing
Machine and Physics Data Guide
 WWW..COM Machine and Physics Data Guide STANDARD IMAGING, INC. 3120 Deming Way Middleton, WI 53562-1461 May / 2008 2008 Standard Imaging, Inc. TEL 800.261.4446 TEL 608.831.0025 FAX 608.831.2202 www.standardimaging.com
UNCOMPROMISING QUALITY
 ION CHAMBERS UNCOMPROMISING QUALITY Designed with over 30 years of scientific integrity for a broad range of dosimetry measurements in diverse radiation beams Farmer-type Chambers For absolute dosimetry
ICARO Vienna April Implementing 3D conformal radiotherapy and IMRT in clinical practice: Recommendations of IAEA- TECDOC-1588
 ICARO Vienna April 27-29 2009 Implementing 3D conformal radiotherapy and IMRT in clinical practice: Recommendations of IAEA- TECDOC-1588 M. Saiful Huq, Ph.D., Professor and Director, Dept. of Radiation
The MSKCC Approach to IMRT. Outline
 The MSKCC Approach to IMRT Spiridon V. Spirou, PhD Department of Medical Physics Memorial Sloan-Kettering Cancer Center New York, NY Outline Optimization Field splitting Delivery Independent verification
Basic Radiation Oncology Physics
 Basic Radiation Oncology Physics T. Ganesh, Ph.D., DABR Chief Medical Physicist Fortis Memorial Research Institute Gurgaon Acknowledgment: I gratefully acknowledge the IAEA resources of teaching slides
ADVANCING CANCER TREATMENT
 3 ADVANCING CANCER TREATMENT SUPPORTING CLINICS WORLDWIDE RaySearch is advancing cancer treatment through pioneering software. We believe software has un limited potential, and that it is now the driving
Goals. Scope/exclusions. Outline: follow outline of MPPG (plus rationale & some implementation experiences)
") AAPM MEDICAL PHYSICS PRACTICE GUIDELINE # : Commissioning and QA of Treatment Planning Dose Calculations: Megavoltage Photon and Electron Beams Jennifer Smilowitz (Chair), University of Wisconsin-Madison
AAPM MEDICAL PHYSICS PRACTICE GUIDELINE # : Commissioning and QA of Treatment Planning Dose Calculations: Megavoltage Photon and Electron Beams Jennifer Smilowitz (Chair), University of Wisconsin-Madison
Hugues Mailleux Medical Physics Department Institut Paoli-Calmettes Marseille France. Sunday 17 July 2016
 Hugues Mailleux Medical Physics Department Institut Paoli-Calmettes Marseille France Sunday 17 July 2016 AGENDA 1. Introduction 2. Material 3. Optimization process 4. Results 5. Comments 6. Conclusion
Real-time monitoring of linac performance using RT plans and logfiles
 Real-time monitoring of linac performance using RT plans and logfiles NCCAAPM Wisconsin Dells 7 April 2017 Mark Wiesmeyer, PhD, DABR Technical Product Manager Technical talk with insights and results based
4 Measurement. and Analysis. 4.1 Overview and Underlying Principles 4-1
 Measurement and Analysis.1 Overview and Underlying Principles.1.1 Introductory Remarks The physics and setup for film dosimetry have been described in the previous chapters. The measurement setup for IMRT
3D Scanning Comes Full Circle
 3D SCANNER TM 3D Scanning Comes Full Circle Relative 3D Dosimetry offering the easiest setup, most objectivity, and best consistency available Cross-Plane Advanced Design Ring and diameter drive mechanism
MEDICAL EQUIPMENT: COMPUTED TOMOGRAPHY. Prof. Yasser Mostafa Kadah
 MEDICAL EQUIPMENT: COMPUTED TOMOGRAPHY Prof. Yasser Mostafa Kadah www.k-space.org Recommended Textbook X-Ray Computed Tomography in Biomedical Engineering, by Robert Cierniak, Springer, 211 Computed Tomography
S. Guru Prasad, Ph.D., DABR
 PURPOSE S. Guru Prasad, Ph.D., DABR Director of Medical Physics IAEA Consultant NorthShore University Health System and University of Chicago, Pritzker School of Medicine Current TPS utilize more information
Version 5.6. Quick Start Guide
 WWW..COM Version 5.6 Quick Start Guide STANDARD IMAGING, INC. 3120 Deming Way Middleton, WI 53562-1461 Jul / 2018 2018 Standard Imaging, Inc. TEL 800.261.4446 TEL 608.831.0025 FAX 608.831.2202 DOC # 80714-05
3DVH : SUN NUCLEAR On The Accuracy Of The corporation Planned Dose Perturbation Algorithm Your Most Valuable QA and Dosimetry Tools *Patent Pending
 3DVH : On The Accuracy Of The Planned Dose Perturbation Algorithm SUN NUCLEAR corporation Your Most Valuable QA and Dosimetry Tools *Patent Pending introduction State-of-the-art IMRT QA of static gantry
Evaluation of AutoQA Lite TM Image Quality Measurement Software
 Evaluation of AutoQA Lite TM Image Quality Measurement Software Andrew J Reilly Imaging Physicist Oncology Physics Edinburgh Cancer Centre Western General Hospital EDINBURGH EH4 2XU Phone: 0131 537 1161
The team. Disclosures. Ultrasound Guidance During Radiation Delivery: Confronting the Treatment Interference Challenge.
 Ultrasound Guidance During Radiation Delivery: Confronting the Treatment Interference Challenge Dimitre Hristov Radiation Oncology Stanford University The team Renhui Gong 1 Magdalena Bazalova-Carter 1
Automated Quality Assurance for Image-Guided Radiation Therapy
 JOURNAL OF APPLIED CLINICAL MEDICAL PHYSICS, VOLUME 10, NUMBER 1, WINTER 2009 Automated Quality Assurance for Image-Guided Radiation Therapy Eduard Schreibmann, a Eric Elder, Tim Fox Department of Radiation
CT Protocol Review: Practical Tips for the Imaging Physicist Physicist
 CT Protocol Review: Practical Tips for the Imaging Physicist Physicist Dianna Cody, Ph.D., DABR, FAAPM U.T.M.D. Anderson Cancer Center August 8, 2013 AAPM Annual Meeting Goals Understand purpose and importance
Computational modelling and analysis: IOP Medical Physics Group
 Computational modelling and analysis: IOP Medical Physics Group Using Bespoke Matlab Software for the Collection and Processing of Dynalog Files from the Varian Millennium 120 MLC system following delivery
Acknowledgments. Ping Xia, Ph.D., UCSF. Pam Akazawa, CMD, UCSF. Cynthia Chuang, Ph.D., UCSF
 Page 1 Quality Assurance of IMRT Delivery Systems - Siemens Lynn J. Verhey, Ph.D. Professor and Vice-Chair UCSF Dept. of Radiation Oncology AAPM 22 Annual Meeting, Montreal Acknowledgments Ping Xia, Ph.D.,
Photon beam dose distributions in 2D
 Photon beam dose distributions in 2D Sastry Vedam PhD DABR Introduction to Medical Physics III: Therapy Spring 2014 Acknowledgments! Narayan Sahoo PhD! Richard G Lane (Late) PhD 1 Overview! Evaluation
IHE Radiation Oncology Technical Framework Supplement. Treatment Delivery Plan Content (TDPC) Rev. 1.1 Trial Implementation
 Rev. 1.1 Trial Implementation") Integrating the Healthcare Enterprise 5 IHE Radiation Oncology Technical Framework Supplement 10 Treatment Delivery Plan Content 15 Rev. 1.1 Trial Implementation 20 Date: November 16, 2016 Author: IHE
Integrating the Healthcare Enterprise 5 IHE Radiation Oncology Technical Framework Supplement 10 Treatment Delivery Plan Content 15 Rev. 1.1 Trial Implementation 20 Date: November 16, 2016 Author: IHE
GafChromic Protocol Multi-Channel Film Dosimetry + Gamma Map Analysis
 GafChromic Protocol Multi-Channel Film Dosimetry + Gamma Map Analysis Micke A. Ashland Inc. Advanced Materials Ashland proprietary patented technology GafChromic Film for Dose Measurement Radiotherapy
Feasibility study of performing IGRT system daily QA using a commercial QA device
 JOURNAL OF APPLIED CLINICAL MEDICAL PHYSICS, VOLUME 12, NUMBER 3, summer 2011 Feasibility study of performing IGRT system daily QA using a commercial QA device Jean L.Peng, 1 Darren Kahler, 2 Jonathan
A secondary monitor unit calculation algorithm using superposition of symmetric, open fields for IMRT plans
 Louisiana State University LSU Digital Commons LSU Master's Theses Graduate School 2013 A secondary monitor unit calculation algorithm using superposition of symmetric, open fields for IMRT plans Adam
Dose Calculation and Optimization Algorithms: A Clinical Perspective
 Dose Calculation and Optimization Algorithms: A Clinical Perspective Daryl P. Nazareth, PhD Roswell Park Cancer Institute, Buffalo, NY T. Rock Mackie, PhD University of Wisconsin-Madison David Shepard,
Qalitätssicherung an Multileafkollimatoren. Dr. Lutz Müller Würzburg jan 2004
 Qalitätssicherung an Multileafkollimatoren Dr. Lutz Müller Würzburg jan 2004 IMRT Verification - present Target Volume Constraints Inverse Planning Algorithm Fluence Map Leaf Sequencer Leaf & Gantry sequence
Digital Imaging and Communications in Medicine (DICOM) Supplement 176: Second Generation Radiotherapy. Additional RT Treatment Modalities
 Supplement 176: Second Generation Radiotherapy. Additional RT Treatment Modalities") sup176_pc_newrtradiations.doc: Sup 176: 2 nd Generation RT Additional RT Treatment Modalities Page 1 2 4 Digital Imaging and Communications in Medicine (DICOM) 6 Supplement 176: Second Generation Radiotherapy
sup176_pc_newrtradiations.doc: Sup 176: 2 nd Generation RT Additional RT Treatment Modalities Page 1 2 4 Digital Imaging and Communications in Medicine (DICOM) 6 Supplement 176: Second Generation Radiotherapy
Monte Carlo methods in proton beam radiation therapy. Harald Paganetti
 Monte Carlo methods in proton beam radiation therapy Harald Paganetti Introduction: Proton Physics Electromagnetic energy loss of protons Distal distribution Dose [%] 120 100 80 60 40 p e p Ionization
Calibration and quality assurance for rounded leaf-end MLC systems
 Calibration and quality assurance for rounded leaf-end MLC systems Maria N. Graves, a) Antoinette V. Thompson, b) Mary K. Martel, Daniel L. McShan, and Benedick A. Fraass Department of Radiation Oncology,
URGENT IMPORTANT FIELD SAFETY NOTIFICATION
 Subject: Incorrect Movement of the Treatment Table Product: MOSAIQ Scope: Sites affected will be those: 1. Running MOSAIQ and, 2. Treating on linear accelerators with the RATM license Notification Released:
Integrated proton-photon treatment planning
 Pinnacle 3 Proton Planning Integrated proton-photon treatment planning Philips Pinnacle 3 Proton Planning specifications Pinnacle 3 Proton Planning is designed to simplify treatment planning for proton
Evaluation report. X-ray tomographic image guided radiotherapy systems CEP10071
 Evaluation report X-ray tomographic image guided radiotherapy systems CEP10071 March 2010 Contents 2 Summary... 3 Introduction... 6 Product description... 9 Methods... 14 Technical performance... 23 Purchasing...
Proton dose calculation algorithms and configuration data
 Proton dose calculation algorithms and configuration data Barbara Schaffner PTCOG 46 Educational workshop in Wanjie, 20. May 2007 VARIAN Medical Systems Agenda Broad beam algorithms Concept of pencil beam
Data. ModuLeaf Mini Multileaf Collimator Precision Beam Shaping for Advanced Radiotherapy
 Data ModuLeaf Mini Multileaf Collimator Precision Beam Shaping for Advanced Radiotherapy ModuLeaf Mini Multileaf Collimator Precision Beam Shaping for Advanced Radiotherapy The ModuLeaf Mini Multileaf
Acceptance Testing and Commissioning of Monte Carlo Dose Calculation Systems. Bruce Curran University of Michigan Medical Center Ann Arbor, MI
 Acceptance Testing and Commissioning of Monte Carlo Dose Calculation Systems Bruce Curran University of Michigan Medical Center Ann Arbor, MI Disclosure Some of the work discussed in this talk was supported
Image Acquisition Systems
 Image Acquisition Systems Goals and Terminology Conventional Radiography Axial Tomography Computer Axial Tomography (CAT) Magnetic Resonance Imaging (MRI) PET, SPECT Ultrasound Microscopy Imaging ITCS
A method for determining multileaf collimator transmission and scatter for dynamic intensity modulated radiotherapy a
 A method for determining multileaf collimator transmission and scatter for dynamic intensity modulated radiotherapy a Mark R. Arnfield, b) Jeffrey V. Siebers, Jong O. Kim, Qiuwen Wu, Paul J. Keall, and
Advanced Radiotherapy
 Advanced Radiotherapy IBA Concept for IMRT Verification Dr. Lutz Müller 1 IMRT Verification BIS BIS ADAS Fluence Model Delivered fluence Target Volume Constraints Inverse Backprojection Fluence Map Leaf
A SYSTEM OF DOSIMETRIC CALCULATIONS
 A SYSTEM OF DOSIMETRIC CALCULATIONS INTRODUCTION Dose calculation based on PDD and TAR have Limitations The dependence of PDD on SSD Not suitable for isocentric techniques TAR and SAR does not depend on
Use of Monte Carlo modelling in radiotherapy linac design. David Roberts, PhD Senior Physicist Elekta
 Use of Monte Carlo modelling in radiotherapy linac design David Roberts, PhD Senior Physicist Elekta Contents Overview of Elekta What we do Where we use Monte Carlo Codes and resources Example : Agility
Transitioning from pencil beam to Monte Carlo for electron dose calculations
 Transitioning from pencil beam to Monte Carlo for electron dose calculations Jessie Huang-Vredevoogd (jyhuang4@wisc.edu) University of Wisconsin NCC AAPM October 12, 2019 1 Topics to cover Background RayStation
Digital Imaging and Communications in Medicine (DICOM) Supplement 176: Second Generation Radiotherapy. Additional RT Treatment Modalities
 Supplement 176: Second Generation Radiotherapy. Additional RT Treatment Modalities") Modalities Page 1 2 4 Digital Imaging and Communications in Medicine (DICOM) 6 Supplement 176: Second Generation Radiotherapy Additional RT Treatment Modalities 8 10 12 14 16 DICOM Standards Committee,
Modalities Page 1 2 4 Digital Imaging and Communications in Medicine (DICOM) 6 Supplement 176: Second Generation Radiotherapy Additional RT Treatment Modalities 8 10 12 14 16 DICOM Standards Committee,
Evaluation of 3D Gamma index calculation implemented in two commercial dosimetry systems
 University of Wollongong Research Online Faculty of Engineering and Information Sciences - Papers: Part A Faculty of Engineering and Information Sciences 2015 Evaluation of 3D Gamma index calculation implemented
Assesing multileaf collimator effect on the build-up region using Monte Carlo method
 Pol J Med Phys Eng. 2008;14(3):163-182. PL ISSN 1425-4689 doi: 10.2478/v10013-008-0014-0 website: http://www.pjmpe.waw.pl M. Zarza Moreno 1, 2, N. Teixeira 3, 4, A. P. Jesus 1, 2, G. Mora 1 Assesing multileaf
Introduction to Biomedical Imaging
 Alejandro Frangi, PhD Computational Imaging Lab Department of Information & Communication Technology Pompeu Fabra University www.cilab.upf.edu X-ray Projection Imaging Computed Tomography Digital X-ray
HIGH-SPEED THEE-DIMENSIONAL TOMOGRAPHIC IMAGING OF FRAGMENTS AND PRECISE STATISTICS FROM AN AUTOMATED ANALYSIS
 23 RD INTERNATIONAL SYMPOSIUM ON BALLISTICS TARRAGONA, SPAIN 16-20 APRIL 2007 HIGH-SPEED THEE-DIMENSIONAL TOMOGRAPHIC IMAGING OF FRAGMENTS AND PRECISE STATISTICS FROM AN AUTOMATED ANALYSIS P. Helberg 1,
MEDICAL IMAGING 2nd Part Computed Tomography
 MEDICAL IMAGING 2nd Part Computed Tomography Introduction 2 In the last 30 years X-ray Computed Tomography development produced a great change in the role of diagnostic imaging in medicine. In convetional
1. Learn to incorporate QA for surface imaging
 Hania Al-Hallaq, Ph.D. Assistant Professor Radiation Oncology The University of Chicago ***No disclosures*** 1. Learn to incorporate QA for surface imaging into current QA procedures for IGRT. 2. Understand
TPS COMMISSIONING. Laurence Court University of Texas MD Anderson Cancer Center 4/3/2017 1
 TPS COMMISSIONING Laurence Court University of Texas MD Anderson Cancer Center 4/3/2017 1 Conflicts of interest Court receives funding from NIH, CPIRT, Varian and Elekta 4/3/2017 2 Resources your first
A DOSIMETRIC MODEL FOR SMALL-FIELD ELECTRON RADIATION THERAPY A CREATIVE PROJECT (3 SEMESTER HOURS) SUBMITTED TO THE GRADUATE SCHOOL
 SUBMITTED TO THE GRADUATE SCHOOL") A DOSIMETRIC MODEL FOR SMALL-FIELD ELECTRON RADIATION THERAPY A CREATIVE PROJECT (3 SEMESTER HOURS) SUBMITTED TO THE GRADUATE SCHOOL IN PARTIAL FULFILLMENT OF THE REQUIREMENTS FOR THE DEGREE MASTER OF
A DOSIMETRIC MODEL FOR SMALL-FIELD ELECTRON RADIATION THERAPY A CREATIVE PROJECT (3 SEMESTER HOURS) SUBMITTED TO THE GRADUATE SCHOOL IN PARTIAL FULFILLMENT OF THE REQUIREMENTS FOR THE DEGREE MASTER OF
ISO ISO ISO OHSAS ISO
 ISO 9001 ISO 13485 ISO 14001 OHSAS 18001 ISO 27001 Pro-NM Performance 08-101 - standard version 08-103 - version with the PET Lid Phantom for NM and PET systems performance evaluation (collimator, artifacts,
Basics of treatment planning II
 Basics of treatment planning II Sastry Vedam PhD DABR Introduction to Medical Physics III: Therapy Spring 2015 Dose calculation algorithms! Correction based! Model based 1 Dose calculation algorithms!
Future is Effortless
 AQUATM Radiology is a machine Quality Assurance management solution that standardizes, streamlines and automates QA procedures throughout rediology department and across multiple sites. AQUATM Radiology
Dose Distributions. Purpose. Isodose distributions. To familiarize the resident with dose distributions and the factors that affect them
 Dose Distributions George Starkschall, Ph.D. Department of Radiation Physics U.T. M.D. Anderson Cancer Center Purpose To familiarize the resident with dose distributions and the factors that affect them
Digital Imaging and Communications in Medicine (DICOM) Supplement 176: Second Generation Radiotherapy. Additional RT Treatment Modalities
 Supplement 176: Second Generation Radiotherapy. Additional RT Treatment Modalities") sup17_13_newrtradiations.doc: Sup 17: nd Generation RT Additional RT Treatment Modalities Page 1 Digital Imaging and Communications in Medicine (DICOM) Supplement 17: Second Generation Radiotherapy Additional
sup17_13_newrtradiations.doc: Sup 17: nd Generation RT Additional RT Treatment Modalities Page 1 Digital Imaging and Communications in Medicine (DICOM) Supplement 17: Second Generation Radiotherapy Additional