Exercise # 6: Using the NHDPlus Raster Data Sets Last Updated 3/28/2006
|
|
|
- Erika Simpson
- 5 years ago
- Views:
Transcription
1 Exercise # 6: Using the NHDPlus Raster Data Sets Last Updated 3/28/2006 The NHDPlus includes several raster (grid) data sets. Several of these are primarily used in analytical processes that are beyond the scope of this exercise. Some, however, are useful for display purposes. This exercise will provide hints on efficient use of these raster data sets. 1. First, let s discuss the characteristics of each of the raster data sets in general a. The cat grid contains an unusually large number of unique grid values. By default ArcMap will only show the first 65,536 records in the value attribute table (cat.vat). The Region 06 cat grid is smaller, but the cat grid for most regions exceeds this maximum number of value attribute table records. Such a large grid also cannot be displayed showing unique symbols for each value. Note in ArcGIS 9.1 (but not in earlier versions) there is an Advanced ArcMap setting to allow more than 65,536 records to be displayed in the VAT for a grid. This should be used with caution, however. If a grid with a large numbers of values, like cat is symbolized to show unique values, display performance can be extremely SLOW! In most cases you don t really need to see the records in the cat.vat or to display it with unique symbols. All the same information is in the catchment.shp attribute table, and can be used much more readily in that form. The cat grid is primarily useful for gridded overlay analysis rather than for display purposes. b. The fdr (flow direction) contains only eight unique values, one for each possible flow direction. Although it is easy to display this grid, it is not particularly easy to interpret. This grid may sometimes be inspected closely in order to understand the flow in a very small area, but generally this grid is not displayed, and is used by automated procedures to derive flow paths or delineate watersheds. c. The fac grid contains a very skewed distribution of values. The vast majority of cells contain small numbers (fewer than 100), however the cells along major flow paths can have values into the hundreds of millions. The default display of such grids is very difficult to use. We will see later in this exercise how to display the fac grid in a more useful manner. d. The elev_cm grid contains integer values of elevation, using vertical units of centimeters. The original floating-point NED data were multiplied by 100 and converted to integer in order to allow automatic compression of the grids. This saves a large amount of disk space. In some of the early distributions of NHDPlus data, the Z units were specified incorrectly. In the processing unit elevation folder, (e.g. elev_unit_a), open elev_cm\prj.adf using Notepad. Make sure it has Zunits 100. If it has Zunits NO, change it as shown below.

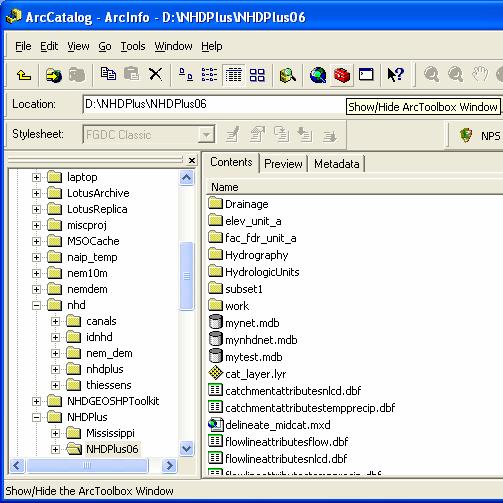
2 2. Now, let s create a shaded relief map *. Start ArcCatalog. a. Let s create a folder to work in. Use either Windows Explorer or ArcCatalog, and the File, New, New Folder choice to create a new folder under our NHDPlus06 folder, and name it work. b. To create a shaded relief grid, use Show/Hide ArcToolbox Window to add the ArcToolbox to ArcCatalog. * Note that the ArcHydro Tools Batch Preprocessing tool, covered in Exercise 7, also creates a shaded relief grid. If you plan to do Exercise 7, you could skip this exercise and come back to it after doing Exercise 7.
3

4 c. Expand the Spatial Analyst Tools list, then expand the Surface tools list, and double-click the Hillshade tool.
 e. Build pyramids for the newly created ShdRelief grid by right-clicking on it in ArcCatalog and choosing Build Pyramids, then clicking OK on the Build Pyramids menu. 3.")
5 d. Fill in the Hillshade menu as shown below. Use a zfactor of 0.01, because the elev_cm grid has vertical units of centimeters and horizontal units of meters. Click OK. (This takes about 3 minutes.) e. Build pyramids for the newly created ShdRelief grid by right-clicking on it in ArcCatalog and choosing Build Pyramids, then clicking OK on the Build Pyramids menu. 3. Open ArcMap and close ArcCatalog. a. Add the ShdRelief grid to the map. Note that by adding a raster data set first, the map document takes on the NAD_1983_Albers coordinate system from the raster data set. When working with raster data, particularly when doing raster analysis, it is best to keep the map document in this projection. (Conversely, if doing vector analysis, particularly when using a geometric network, the GCS_North_American_1983 should be used.)

6 b. Right-click on the ShdRelief grid, and choose Properties. Select the Symbology tab. If the renderer is not Stretched, change it to Stretched as shown below, then click Apply.

7 c. Select the Display tab and set Resample during display to Bilinear Interpolation for smoother display. Click OK.
8 4. Now let s display elevation in a range of colors. a. Add the elev_cm,grid to the map. Open its Layer Properties Symbology Tab as we did before with the ShdRelief grid. It should look like this:

9 b. Right-click on the black to white shaded Color Ramp pulldown menu and choose Graphic View. The check mark beside it should disappear and the text descriptions of the Color Ramps should appear. Using the pulldown menu scroll down to find the Elevation #1 color ramp and select it. The menu should now look as below.
10 c. Select the Display tab, then set the transparency level to 50%. The menu should look like the one shown below. Click OK.

11 d. In the ArcMap table of contents, drag the elev_cm layer above the shdrelief layer and turn them both on. Zoom in somewhere to see a nice color shaded relief map.

12 5. Now let s see how we can use the fac (flow accumulation grid) to see where stream channels are according to the HydroDEM. a. Add the fac grid to the map. Right-click on the fac grid, and choose Properties. Select the Symbology tab. Change the renderer from Stretched to Classified as shown below. b. Click the Classify button next to the number of classes.

13 c. On the Classification menu, change the number of classes to 2, then change the first Break Value to 100, as shown below. Click OK.


14 d. Now back on the Layer Properties Symbology menu, double-click on the black box under Symbol next to the Range, then choose No Color on the color menu that pops up. e. In a similar manner, change the color on the ,875,264 range to a dark blue. Zoom in somewhere so you can see the dark blue fac grid cells. The fac cells that are dark blue are cells having 100 or more cells upstream, and indicate where drainage channels are on the HydroDEM. In general these

15 should follow the NHD Flowlines closely, since all networked NHD Flowlines were burned into the HydroDEM. The threshold of 100 is shown for illustrative purposes, but any threshold may be chosen. A threshold of around 3000 to 5000 has been found to result in a drainage density similar to the medium resolution NHD Flowlines, although this varies considerably throughout the NHD. Below is an example showing the 100-cell threshold fac grid in dark blue, with nhdflowline in orange, overlaid on the ShdRelief grid (which was produced in the Preprocessing step.)
Exercise 6 Using the NHDPlus Raster Data Sets Last Updated 3/12/2014
 Exercise 6 Using the NHDPlus Raster Data Sets Last Updated 3/12/2014 Within this document, the term NHDPlus is used when referring to NHDPlus Version 2.1 (unless otherwise noted). The NHDPlus includes
George Mason University Department of Civil, Environmental and Infrastructure Engineering
 George Mason University Department of Civil, Environmental and Infrastructure Engineering Dr. Celso Ferreira Prepared by Lora Baumgartner December 2015 Revised by Brian Ross July 2016 Exercise Topic: GIS
Lab 11: Terrain Analyses
 Lab 11: Terrain Analyses What You ll Learn: Basic terrain analysis functions, including watershed, viewshed, and profile processing. There is a mix of old and new functions used in this lab. We ll explain
Field-Scale Watershed Analysis
 Conservation Applications of LiDAR Field-Scale Watershed Analysis A Supplemental Exercise for the Hydrologic Applications Module Andy Jenks, University of Minnesota Department of Forest Resources 2013
Lab 11: Terrain Analyses
 Lab 11: Terrain Analyses What You ll Learn: Basic terrain analysis functions, including watershed, viewshed, and profile processing. There is a mix of old and new functions used in this lab. We ll explain
Lab 1: Landuse and Hydrology, learning ArcGIS
 Lab 1: Landuse and Hydrology, learning ArcGIS The following lab exercises are designed to give you experience using ArcMap in order to visualize and analyze datasets that are relevant to important geomorphological/
Tutorial 18: 3D and Spatial Analyst - Creating a TIN and Visual Analysis
 Tutorial 18: 3D and Spatial Analyst - Creating a TIN and Visual Analysis Module content 18.1. Creating a TIN 18.2. Spatial Analyst Viewsheds, Slopes, Hillshades and Density. 18.1 Creating a TIN Sometimes
A Second Look at DEM s
 A Second Look at DEM s Overview Detailed topographic data is available for the U.S. from several sources and in several formats. Perhaps the most readily available and easy to use is the National Elevation
Working with Elevation Data URPL 969 Applied GIS Workshop: Rethinking New Orleans After Hurricane Katrina Spring 2006
 Working with Elevation Data URPL 969 Applied GIS Workshop: Rethinking New Orleans After Hurricane Katrina Spring 2006 This GIS lab exercise will explore Light Detection And Ranging (LiDAR) data for New
Exercise 5. Height above Nearest Drainage Flood Inundation Analysis
 Exercise 5. Height above Nearest Drainage Flood Inundation Analysis GIS in Water Resources, Fall 2016 Prepared by David G Tarboton Purpose The purpose of this exercise is to illustrate the use of TauDEM
Delineating the Stream Network and Watersheds of the Guadalupe Basin
 Delineating the Stream Network and Watersheds of the Guadalupe Basin Francisco Olivera Department of Civil Engineering Texas A&M University Srikanth Koka Department of Civil Engineering Texas A&M University
CRC Website and Online Book Materials Page 1 of 16
 Page 1 of 16 Appendix 2.3 Terrain Analysis with USGS DEMs OBJECTIVES The objectives of this exercise are to teach readers to: Calculate terrain attributes and create hillshade maps and contour maps. use,
GEO 465/565 Lab 6: Modeling Landslide Susceptibility
 1 GEO 465/565 Lab 6: Modeling Landslide Susceptibility This lab will give you more practice in understanding and building a GIS analysis model. Recall from class lecture that a GIS analysis model is a
Stream Network and Watershed Delineation using Spatial Analyst Hydrology Tools
 Stream Network and Watershed Delineation using Spatial Analyst Hydrology Tools Prepared by Venkatesh Merwade School of Civil Engineering, Purdue University vmerwade@purdue.edu January 2018 Objective The
Introduction to GIS 2011
 Introduction to GIS 2011 Digital Elevation Models CREATING A TIN SURFACE FROM CONTOUR LINES 1. Start ArcCatalog from either Desktop or Start Menu. 2. In ArcCatalog, create a new folder dem under your c:\introgis_2011
Lab 10: Raster Analyses
 Lab 10: Raster Analyses What You ll Learn: Spatial analysis and modeling with raster data. You will estimate the access costs for all points on a landscape, based on slope and distance to roads. You ll
BAEN 673 Biological and Agricultural Engineering Department Texas A&M University ArcSWAT / ArcGIS 10.1 Example 2
 Before you Get Started BAEN 673 Biological and Agricultural Engineering Department Texas A&M University ArcSWAT / ArcGIS 10.1 Example 2 1. Open ArcCatalog Connect to folder button on tool bar navigate
Using GIS to Site Minimal Excavation Helicopter Landings
 Using GIS to Site Minimal Excavation Helicopter Landings The objective of this analysis is to develop a suitability map for aid in locating helicopter landings in mountainous terrain. The tutorial uses
Ex. 4: Locational Editing of The BARC
 Ex. 4: Locational Editing of The BARC Using the BARC for BAER Support Document Updated: April 2010 These exercises are written for ArcGIS 9.x. Some steps may vary slightly if you are working in ArcGIS
Exercise 5. Height above Nearest Drainage Flood Inundation Analysis
 Exercise 5. Height above Nearest Drainage Flood Inundation Analysis GIS in Water Resources, Fall 2018 Prepared by David G Tarboton Purpose The purpose of this exercise is to learn how to calculation the
Basics of Using LiDAR Data
 Conservation Applications of LiDAR Basics of Using LiDAR Data Exercise #2: Raster Processing 2013 Joel Nelson, University of Minnesota Department of Soil, Water, and Climate This exercise was developed
In this lab, you will create two maps. One map will show two different projections of the same data.
 Projection Exercise Part 2 of 1.963 Lab for 9/27/04 Introduction In this exercise, you will work with projections, by re-projecting a grid dataset from one projection into another. You will create a map
Exercise 4: Extracting Information from DEMs in ArcMap
 Exercise 4: Extracting Information from DEMs in ArcMap Introduction This exercise covers sample activities for extracting information from DEMs in ArcMap. Topics include point and profile queries and surface
Stream network delineation and scaling issues with high resolution data
 Stream network delineation and scaling issues with high resolution data Roman DiBiase, Arizona State University, May 1, 2008 Abstract: In this tutorial, we will go through the process of extracting a stream
Watershed Sciences 4930 & 6920 GEOGRAPHIC INFORMATION SYSTEMS
 HOUSEKEEPING Watershed Sciences 4930 & 6920 GEOGRAPHIC INFORMATION SYSTEMS CONTOURS! Self-Paced Lab Due Friday! WEEK SIX Lecture RASTER ANALYSES Joe Wheaton YOUR EXCERCISE Integer Elevations Rounded up
Lecture 21 - Chapter 8 (Raster Analysis, part2)
") GEOL 452/552 - GIS for Geoscientists I Lecture 21 - Chapter 8 (Raster Analysis, part2) Today: Digital Elevation Models (DEMs), Topographic functions (surface analysis): slope, aspect hillshade, viewshed,
GEOL 452/552 - GIS for Geoscientists I Lecture 21 - Chapter 8 (Raster Analysis, part2) Today: Digital Elevation Models (DEMs), Topographic functions (surface analysis): slope, aspect hillshade, viewshed,
WMS 9.1 Tutorial Watershed Modeling DEM Delineation Learn how to delineate a watershed using the hydrologic modeling wizard
 v. 9.1 WMS 9.1 Tutorial Learn how to delineate a watershed using the hydrologic modeling wizard Objectives Read a digital elevation model, compute flow directions, and delineate a watershed and sub-basins
Raster: The Other GIS Data
 Raster_The_Other_GIS_Data.Docx Page 1 of 11 Raster: The Other GIS Data Objectives Understand the raster format and how it is used to model continuous geographic phenomena. Understand how projections &
GIS Fundamentals: Supplementary Lessons with ArcGIS Pro
 Station Analysis (parts 1 & 2) What You ll Learn: - Practice various skills using ArcMap. - Combining parcels, land use, impervious surface, and elevation data to calculate suitabilities for various uses
Learn how to delineate a watershed using the hydrologic modeling wizard
 v. 11.0 WMS 11.0 Tutorial Learn how to delineate a watershed using the hydrologic modeling wizard Objectives Import a digital elevation model, compute flow directions, and delineate a watershed and sub-basins
RASTER ANALYSIS S H A W N L. P E N M A N E A R T H D A T A A N A LY S I S C E N T E R U N I V E R S I T Y O F N E W M E X I C O
 RASTER ANALYSIS S H A W N L. P E N M A N E A R T H D A T A A N A LY S I S C E N T E R U N I V E R S I T Y O F N E W M E X I C O TOPICS COVERED Spatial Analyst basics Raster / Vector conversion Raster data
Geographical Information Systems Institute. Center for Geographic Analysis, Harvard University. LAB EXERCISE 1: Basic Mapping in ArcMap
 Harvard University Introduction to ArcMap Geographical Information Systems Institute Center for Geographic Analysis, Harvard University LAB EXERCISE 1: Basic Mapping in ArcMap Individual files (lab instructions,
Spatial Analysis Exercise GIS in Water Resources Fall 2011
 Spatial Analysis Exercise GIS in Water Resources Fall 2011 Prepared by David G. Tarboton and David R. Maidment Goal The goal of this exercise is to serve as an introduction to Spatial Analysis with ArcGIS.
GIS LAB 8. Raster Data Applications Watershed Delineation
 GIS LAB 8 Raster Data Applications Watershed Delineation This lab will require you to further your familiarity with raster data structures and the Spatial Analyst. The data for this lab are drawn from
Workshop Exercises for Digital Terrain Analysis with LiDAR for Clean Water Implementation
 Workshop Exercises for Digital Terrain Analysis with LiDAR for Clean Water Implementation This manual is designed to accompany lecture and handout materials provided at a series of workshops offered in
Importing CDED (Canadian Digital Elevation Data) into ArcGIS 9.x
 into ArcGIS 9.x") Importing CDED (Canadian Digital Elevation Data) into ArcGIS 9.x Related Guides: Obtaining Canadian Digital Elevation Data (CDED) Importing Canadian Digital Elevation Data (CDED) into ArcView 3.x Requirements:
Importing CDED (Canadian Digital Elevation Data) into ArcGIS 9.x Related Guides: Obtaining Canadian Digital Elevation Data (CDED) Importing Canadian Digital Elevation Data (CDED) into ArcView 3.x Requirements:
Compilation of GIS data for the Lower Brazos River basin
 Compilation of GIS data for the Lower Brazos River basin Prepared by Francisco Olivera, Ph.D., P.E., Srikanth Koka, and Lauren Walker Department of Civil Engineering October 2, 2006 Contents: Brief Overview
RASTER ANALYSIS GIS Analysis Fall 2013
 RASTER ANALYSIS GIS Analysis Fall 2013 Raster Data The Basics Raster Data Format Matrix of cells (pixels) organized into rows and columns (grid); each cell contains a value representing information. What
I CALCULATIONS WITHIN AN ATTRIBUTE TABLE
 Geology & Geophysics REU GPS/GIS 1-day workshop handout #4: Working with data in ArcGIS You will create a raster DEM by interpolating contour data, create a shaded relief image, and pull data out of the
Learn how to delineate a watershed using the hydrologic modeling wizard
 v. 10.1 WMS 10.1 Tutorial Learn how to delineate a watershed using the hydrologic modeling wizard Objectives Import a digital elevation model, compute flow directions, and delineate a watershed and sub-basins
Exercise 3: Spatial Analysis GIS in Water Resources Fall 2013
 Exercise 3: Spatial Analysis GIS in Water Resources Fall 2013 Prepared by David G. Tarboton and David R. Maidment Goal The goal of this exercise is to serve as an introduction to Spatial Analysis with
Lab 10: Raster Analyses
 Lab 10: Raster Analyses What You ll Learn: Spatial analysis and modeling with raster data. You will estimate the access costs for all points on a landscape, based on slope and distance to roads. You ll
STUDENT PAGES GIS Tutorial Treasure in the Treasure State
 STUDENT PAGES GIS Tutorial Treasure in the Treasure State Copyright 2015 Bear Trust International GIS Tutorial 1 Exercise 1: Make a Hand Drawn Map of the School Yard and Playground Your teacher will provide
Conservation Applications of LiDAR. Terrain Analysis. Workshop Exercises
 Conservation Applications of LiDAR Terrain Analysis Workshop Exercises 2012 These exercises are part of the Conservation Applications of LiDAR project a series of hands on workshops designed to help Minnesota
Lab 18c: Spatial Analysis III: Clip a raster file using a Polygon Shapefile
 Environmental GIS Prepared by Dr. Zhi Wang, CSUF EES Department Lab 18c: Spatial Analysis III: Clip a raster file using a Polygon Shapefile These instructions enable you to clip a raster layer in ArcMap
RASTER ANALYSIS GIS Analysis Winter 2016
 RASTER ANALYSIS GIS Analysis Winter 2016 Raster Data The Basics Raster Data Format Matrix of cells (pixels) organized into rows and columns (grid); each cell contains a value representing information.
Lab 12: Sampling and Interpolation
 Lab 12: Sampling and Interpolation What You ll Learn: -Systematic and random sampling -Majority filtering -Stratified sampling -A few basic interpolation methods Videos that show how to copy/paste data
GEO 465/565 - Lab 7 Working with GTOPO30 Data in ArcGIS 9
 GEO 465/565 - Lab 7 Working with GTOPO30 Data in ArcGIS 9 This lab explains how work with a Global 30-Arc-Second (GTOPO30) digital elevation model (DEM) from the U.S. Geological Survey. This dataset can
Lesson 8 : How to Create a Distance from a Water Layer
 Created By: Lane Carter Advisor: Paul Evangelista Date: July 2011 Software: ArcGIS 10 Lesson 8 : How to Create a Distance from a Water Layer Background This tutorial will cover the basic processes involved
Delineating Watersheds from a Digital Elevation Model (DEM)
") Delineating Watersheds from a Digital Elevation Model (DEM) (Using example from the ESRI virtual campus found at http://training.esri.com/courses/natres/index.cfm?c=153) Download locations for additional
Delineating Watersheds from a Digital Elevation Model (DEM) (Using example from the ESRI virtual campus found at http://training.esri.com/courses/natres/index.cfm?c=153) Download locations for additional
Final project: Lecture 21 - Chapter 8 (Raster Analysis, part2) GEOL 452/552 - GIS for Geoscientists I
 GEOL 452/552 - GIS for Geoscientists I") GEOL 452/552 - GIS for Geoscientists I Lecture 21 - Chapter 8 (Raster Analysis, part2) Talk about class project (copy follow_along_data\ch8a_class_ex into U:\ArcGIS\ if needed) Catch up with lecture 20
GEOL 452/552 - GIS for Geoscientists I Lecture 21 - Chapter 8 (Raster Analysis, part2) Talk about class project (copy follow_along_data\ch8a_class_ex into U:\ArcGIS\ if needed) Catch up with lecture 20
Session 3: Cartography in ArcGIS. Mapping population data
 Exercise 3: Cartography in ArcGIS Mapping population data Background GIS is well known for its ability to produce high quality maps. ArcGIS provides useful tools that allow you to do this. It is important
Tutorial 1: Downloading elevation data
 Tutorial 1: Downloading elevation data Objectives In this exercise you will learn how to acquire elevation data from the website OpenTopography.org, project the dataset into a UTM coordinate system, and
Spatial Analysis Exercise GIS in Water Resources Fall 2012
 Spatial Analysis Exercise GIS in Water Resources Fall 2012 Prepared by David G. Tarboton and David R. Maidment Goal The goal of this exercise is to serve as an introduction to Spatial Analysis with ArcGIS.
Terrain Analysis. Using QGIS and SAGA
 Terrain Analysis Using QGIS and SAGA Tutorial ID: IGET_RS_010 This tutorial has been developed by BVIEER as part of the IGET web portal intended to provide easy access to geospatial education. This tutorial
CONTENTS 1 INTRODUCTION 3 ARCGIS 5 START ARCMAP 11 IMPORT 1: MAP DATA 12 ADD WIND FARM DATA 21 CREATE A MAP TO INSERT IN A REPORT 32
 CONTENTS CONTENTS 1 INTRODUCTION 3 SCENARIO 3 WHAT WILL I LEARN? 3 WHAT DATA DO I HAVE? 4 ARCGIS 5 ARCMAP 6 ARCCATALOG 8 ARCTOOLBOX 9 START ARCMAP 11 IMPORT 1:250000 MAP DATA 12 CREATE A GROUP LAYER 16
How to make an Elevation Map. A Tool for using ArcGIS Project Group N11
 How to make an Elevation Map A Tool for using ArcGIS 10.1 Project Group N11 How to make an Elevation Map A Tool for using ArcGIS 10.1 Hogeschool Rotterdam Academieplein, Waterbouw R.M. Crooij, 0878120
Geog 459: Geographic Information Systems. Lesson 2 Laboratory Exercise
 Exercise Description Mapping and interpreting metropolitan growth and decline patterns between 1990 and 2000. Course Concepts Presented Sunbelt region, population redistribution, and metropolitan areas.
Geoprocessing and georeferencing raster data
 Geoprocessing and georeferencing raster data Raster conversion tools Geoprocessing tools ArcCatalog tools ESRI Grid GDB Raster Raster Dataset Raster Catalog Erdas IMAGINE TIFF ArcMap - raster projection
Channel Conditions in the Onion Creek Watershed. Integrating High Resolution Elevation Data in Flood Forecasting
 Channel Conditions in the Onion Creek Watershed Integrating High Resolution Elevation Data in Flood Forecasting Lukas Godbout GIS in Water Resources CE394K Fall 2016 Introduction Motivation Flooding is
Lab 12: Sampling and Interpolation
 Lab 12: Sampling and Interpolation What You ll Learn: -Systematic and random sampling -Majority filtering -Stratified sampling -A few basic interpolation methods Data for the exercise are in the L12 subdirectory.
Combine Yield Data From Combine to Contour Map Ag Leader
 Combine Yield Data From Combine to Contour Map Ag Leader Exporting the Yield Data Using SMS Program 1. Data format On Hard Drive. 2. Start program SMS Basic. a. In the File menu choose Open. b. Click on
Import, view, edit, convert, and digitize triangulated irregular networks
 v. 10.1 WMS 10.1 Tutorial Import, view, edit, convert, and digitize triangulated irregular networks Objectives Import survey data in an XYZ format. Digitize elevation points using contour imagery. Edit
GIS LAB 1. Basic GIS Operations with ArcGIS. Calculating Stream Lengths and Watershed Areas.
 GIS LAB 1 Basic GIS Operations with ArcGIS. Calculating Stream Lengths and Watershed Areas. ArcGIS offers some advantages for novice users. The graphical user interface is similar to many Windows packages
Module 7 Raster operations
 Introduction Geo-Information Science Practical Manual Module 7 Raster operations 7. INTRODUCTION 7-1 LOCAL OPERATIONS 7-2 Mathematical functions and operators 7-5 Raster overlay 7-7 FOCAL OPERATIONS 7-8
Mapping the Thickness of the Rocky Flats Alluvium and Reconstructing the Pleistocene Rocky Flats Paleogeography (with Spatial Analyst).
.") Exercise 8 Mapping the Thickness of the Rocky Flats Alluvium and Reconstructing the Pleistocene Rocky Flats Paleogeography (with Spatial Analyst). Due: Thursday, February 15, 2018 Goal: Creating Rasters
Exercise 8 Mapping the Thickness of the Rocky Flats Alluvium and Reconstructing the Pleistocene Rocky Flats Paleogeography (with Spatial Analyst). Due: Thursday, February 15, 2018 Goal: Creating Rasters
Lab 10: Raster Analyses
 Lab 10: Raster Analyses What You ll Learn: Spatial analysis and modeling with raster data. You will estimate the access costs for all points on a landscape, based on slope and distance to roads. You ll
George Mason University Department of Civil, Environmental and Infrastructure Engineering. Dr. Celso Ferreira Prepared by Lora Baumgartner
 George Mason University Department of Civil, Environmental and Infrastructure Engineering Dr. Celso Ferreira Prepared by Lora Baumgartner Exercise Topic: Getting started with HEC GeoRAS Objective: Create
This tutorial shows how to extract longitudinal profiles using ArcMap 10.1 and how to plot them with R, an open-source software.
 JESSE S. HILL 2013 UNC-CH This tutorial shows how to extract longitudinal profiles using ArcMap 10.1 and how to plot them with R, an open-source software. R is freely available at: cran.us.r-project.org/
Improved Applications with SAMB Derived 3 meter DTMs
 Improved Applications with SAMB Derived 3 meter DTMs Evan J Fedorko West Virginia GIS Technical Center 20 April 2005 This report sums up the processes used to create several products from the Lorado 7
COPYRIGHTED MATERIAL. Introduction to 3D Data: Modeling with ArcGIS 3D Analyst and Google Earth CHAPTER 1
 CHAPTER 1 Introduction to 3D Data: Modeling with ArcGIS 3D Analyst and Google Earth Introduction to 3D Data is a self - study tutorial workbook that teaches you how to create data and maps with ESRI s
Developing an Interactive GIS Tool for Stream Classification in Northeast Puerto Rico
 Developing an Interactive GIS Tool for Stream Classification in Northeast Puerto Rico Lauren Stachowiak Advanced Topics in GIS Spring 2012 1 Table of Contents: Project Introduction-------------------------------------
5. TxDOT Hydrology Extension System Operation
 5. TxDOT Hydrology Extension System Operation 5.1 System Requirement The TxDOT Hydrology Extension is an ArcView Extension written in the Avenue script used in the ArcView environment. All contents of
Spatial Analysis Exercise GIS in Water Resources Fall 2015
 Spatial Analysis Exercise GIS in Water Resources Fall 2015 Prepared by David G. Tarboton and David R. Maidment Goal The goal of this exercise is to serve as an introduction to Spatial Analysis with ArcGIS.
By Colin Childs, ESRI Education Services. Catalog
 s resolve many traditional raster management issues By Colin Childs, ESRI Education Services Source images ArcGIS 10 introduces Catalog Mosaicked images Sources, mosaic methods, and functions are used
WMS 9.0 Tutorial GSSHA WMS Basics Watershed Delineation using DEMs and 2D Grid Generation Delineate a watershed and create a GSSHA model from a DEM
 v. 9.0 WMS 9.0 Tutorial GSSHA WMS Basics Watershed Delineation using DEMs and 2D Grid Generation Delineate a watershed and create a GSSHA model from a DEM Objectives Learn how to delineate a watershed
Buckskin Detachment Surface Interpolation, Southern Lincoln Ranch Basin, Buckskin Mountains, Western Arizona Hal Hundley
 Buckskin Detachment Surface Interpolation, Southern Lincoln Ranch Basin, Buckskin Mountains, Western Arizona Hal Hundley Introduction The Lincoln Ranch basin in Buckskin Mountains in west-central Arizona
Exercise Lab: Where is the Himalaya eroding? Using GIS/DEM analysis to reconstruct surfaces, incision, and erosion
 Exercise Lab: Where is the Himalaya eroding? Using GIS/DEM analysis to reconstruct surfaces, incision, and erosion 1) Start ArcMap and ensure that the 3D Analyst and the Spatial Analyst are loaded and
Lab 11: Terrain Analysis
 Lab 11: Terrain Analysis What You ll Learn: Basic terrain analysis functions, including watershed, viewshed, and profile processing. You should read chapter 11 in the GIS Fundamentals textbook before performing
USING GEOMEDIA 3D: HOTSPOT DETECTION AND VISUALIZATION
 USING GEOMEDIA 3D: HOTSPOT DETECTION AND VISUALIZATION etraining Introduction Use GeoMedia and GeoMedia 3D for hotspot detection and visualization. Software GeoMedia and GeoMedia 3D Data QuickBird-2 image
GeoEarthScope NoCAL San Andreas System LiDAR pre computed DEM tutorial
 GeoEarthScope NoCAL San Andreas System LiDAR pre computed DEM tutorial J Ramón Arrowsmith Chris Crosby School of Earth and Space Exploration Arizona State University ramon.arrowsmith@asu.edu http://lidar.asu.edu
Spatial Analysis with Raster Datasets
 Spatial Analysis with Raster Datasets Francisco Olivera, Ph.D., P.E. Srikanth Koka Lauren Walker Aishwarya Vijaykumar Keri Clary Department of Civil Engineering April 21, 2014 Contents Brief Overview of
In this exercise we will:
 Intro to GIS Exercise #3 TOC Data frame visual hierarchy / Select by Attribute / Select by Location / Geoprocessing IUP Dept. of Geography and Regional Planning Dr. Richard Hoch Please prepare answers
Lecture 22 - Chapter 8 (Raster Analysis, part 3)
") GEOL 452/552 - GIS for Geoscientists I Lecture 22 - Chapter 8 (Raster Analysis, part 3) Today: Zonal Analysis (statistics) for polygons, lines, points, interpolation (IDW), Effects Toolbar, analysis masks
GEOL 452/552 - GIS for Geoscientists I Lecture 22 - Chapter 8 (Raster Analysis, part 3) Today: Zonal Analysis (statistics) for polygons, lines, points, interpolation (IDW), Effects Toolbar, analysis masks
Lecture 20 - Chapter 8 (Raster Analysis, part1)
") GEOL 452/552 - GIS for Geoscientists I Lecture 20 - Chapter 8 (Raster Analysis, part) 4 lectures on rasters - but won t cover everything (Raster GIS course: Geol 588: GIS II (Spring 20) Today: Raster data,
GEOL 452/552 - GIS for Geoscientists I Lecture 20 - Chapter 8 (Raster Analysis, part) 4 lectures on rasters - but won t cover everything (Raster GIS course: Geol 588: GIS II (Spring 20) Today: Raster data,
Part 1. Slope calculations
 Exercise 3: Spatial Analysis GIS in Water Resources Prepared by David G. Tarboton and David R. Maidment Updated to ArcGIS Pro by Paul Ruess, August 2016 Updated David Tarboton, September 2017 Goal The
Creating raster DEMs and DSMs from large lidar point collections. Summary. Coming up with a plan. Using the Point To Raster geoprocessing tool
 Page 1 of 5 Creating raster DEMs and DSMs from large lidar point collections ArcGIS 10 Summary Raster, or gridded, elevation models are one of the most common GIS data types. They can be used in many ways
Raster Suitability Analysis: Siting a Wind Farm Facility North Of Beijing, China
 Raster Suitability Analysis: Siting a Wind Farm Facility North Of Beijing, China Written by Gabriel Holbrow and Barbara Parmenter, revised by Carolyn Talmadge 11/2/2015 INTRODUCTION... 1 PREPROCESSED DATA
Workshop #12 Using ModelBuilder and Customizing the ArcMap Interface
 Workshop #12 Using ModelBuilder and Customizing the ArcMap Interface Toolboxes can be created in ArcToolbox, in folders or within geodatabases. In this tutorial you will place the toolbox in your project
Making Yield Contour Maps Using John Deere Data
 Making Yield Contour Maps Using John Deere Data Exporting the Yield Data Using JDOffice 1. Data Format On Hard Drive 2. Start program JD Office. a. From the PC Card menu on the left of the screen choose
J.Welhan 5/07. Watershed Delineation Procedure
 Watershed Delineation Procedure 1. Prepare the DEM: - all grids should be in the same projection; if not, then reproject (or define and project); if in UTM, all grids must be in the same zone (if not,
Welcome to NR402 GIS Applications in Natural Resources. This course consists of 9 lessons, including Power point presentations, demonstrations,
 Welcome to NR402 GIS Applications in Natural Resources. This course consists of 9 lessons, including Power point presentations, demonstrations, readings, and hands on GIS lab exercises. Following the last
Hot Spot / Kernel Density Analysis: Calculating the Change in Uganda Conflict Zones
 Hot Spot / Kernel Density Analysis: Calculating the Change in Uganda Conflict Zones Created by Patrick Florance. Revised on 10/22/18 for 10.6.1 OVERVIEW... 1 SETTING UP... 1 ENABLING THE SPATIAL ANALYST
Supplemental Quick Guide to GeoWEPP
 Supplemental Quick Guide to GeoWEPP Table of Contents Page A. Rasters needed to run GeoWEPP 1. NED or DEM 2. Topographic Raster B. Before starting the GeoWEPP program 1. Changing NED to ASCII C. Starting
Atmospheric Sciences
 GIS Tutorial for Atmospheric Sciences J. Greg Dobson, University of North Carolina at Asheville Jennifer Boehnert, National Center for Atmospheric Research 2015 UCAR and UNC-Asheville. This is an open
Geospatial Day II Introduction to ArcGIS Editor for Open Street Map
 Geospatial Day II Introduction to ArcGIS Editor for Open Street Map Geospatial Operations Support Team (GOST) Katie McWilliams kmcwilliams@worldbankgroup.org GOST@worldbank.org 0 Using OSM for Network
WMS 9.1 Tutorial GSSHA WMS Basics Watershed Delineation using DEMs and 2D Grid Generation Delineate a watershed and create a GSSHA model from a DEM
 v. 9.1 WMS 9.1 Tutorial GSSHA WMS Basics Watershed Delineation using DEMs and 2D Grid Generation Delineate a watershed and create a GSSHA model from a DEM Objectives Learn how to delineate a watershed
Lab 7: Bedrock rivers and the relief structure of mountain ranges
 Lab 7: Bedrock rivers and the relief structure of mountain ranges Objectives In this lab, you will analyze the relief structure of the San Gabriel Mountains in southern California and how it relates to
USING DATA DRIVEN PAGES
 USING DATA DRIVEN PAGES Mid-West ESRI Utility User s Group Conference March 26, 2014 Presented by: Hillary Bjorstrom, GIS Analyst STAR Energy Services LLC Alexandria, Minnesota EXERCISE 1 CREATING A GRID
Spatial Hydrologic Modeling HEC-HMS Distributed Parameter Modeling with the MODClark Transform
 v. 9.0 WMS 9.0 Tutorial Spatial Hydrologic Modeling HEC-HMS Distributed Parameter Modeling with the MODClark Transform Setup a basic distributed MODClark model using the WMS interface Objectives In this