Creating Surfaces. Steve Kopp Steve Lynch
|
|
|
- Virginia Shelton
- 5 years ago
- Views:
Transcription


1 Steve Kopp Steve Lynch
2 Overview Learn the types of surfaces and the data structures used to store them Emphasis on surface interpolation Learn the interpolation workflow Understand how interpolators work Understand how to choose an appropriate interpolation technique and its parameters


3 Types of Surfaces Elevation Soil chemistry Water quality Population Income Disease occurrence
4 What kind of surfaces do you create? What is the source data? - Points, lines, polygons, raster - Is quality a concern What is the phenomenon? - Measurements, counts, something else Anything special or odd about it? - Discontinuous - Highs and lows sampled or not What do you want/expect for a result? - Raster, TIN, contour lines or polygons, estimates at points, estimate of surface quality

5 Storing surfaces in ArcGIS Raster TIN / Terrain Points - LiDAR, LAS Isolines / Contours Geostatistical Layer
 Soft breaklines (road,")
6 TIN and Terrain Maintain accuracy of measured locations Discontinuities are handled with breaklines Hard breaklines (cliff, fault) Soft breaklines (road, stream)
7 Where do I find these capabilities? Spatial Analyst raster, contour 3D Analyst raster, contour, TIN, terrain Geostatistical Analyst raster, contour line, filled contour polygon, point, geostatistical layer ArcGIS Online filled contour polygon
8 2 common types of surfaces Density surfaces = counts of things over an area Interpolated surfaces of measured quantities This session is about interpolation

9 Density Density surfaces are maps of magnitude per unit area Count occurrences of a phenomenon within an area and distribute it through the area. Simple Density and Kernel Density Use points or lines as input. - Population per Km2 - Road density per Mi2


10 Interpolation Interpolation is the process of transforming measurements of a continuous phenomenon into a continuous surface representation Estimating new values at unsampled locations
11 Types of input for Interpolation Points - Continuous values - LAS Polylines - Contours Polygon - Centriod - Areal Interpolation - Dasymetric mapping Raster - Fill in missing values - Change resolution through Resampling or Interpolation - Modify surface with supplemental data
12 Interpolation Steps 1) Understand your data 2) Experiment with techniques and parameters 3) Create surfaces 4) Evaluate your surfaces 5) Repeat

13 Exploratory Spatial Data Analysis Where is the data located? What are the values of the data points? How does the location of a point relate to its value?


14 Explore your Data Outliers Trends Spatial Dependency Distribution - Statistical distribution of values - Spatial distribution of points Stationarity
15 Exploring your Data Demonstration


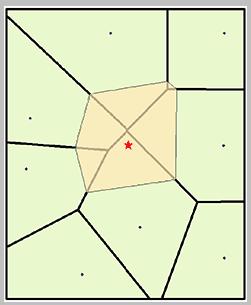
16 Two parts of all interpolators 1) Neighborhood definition where do I find known points to estimate a new value 2) Estimation function from those points, how do I calculate a new value
17 Searching neighborhood Variable number of points - Specify a maximum search distance and number of points, a smaller number of points may be used. - Can result in NoData cells Fixed number of points - Specify a minimum number of points, and the search distance is increased until that number of points is found. Tobler s first law of geography applies "Everything is related to everything else, but near things are more related than distant things."


18 Searching Neighborhoods with Multiple sectors Multi-sector neighborhoods are very useful for data with an irregular spatial distribution or clustering Available in Geostatistical Analyst
19 Questions to ask about your data Characteristics of phenomena? Sample spacing - Oversampled or needs extrapolation? Honor the input points? Barriers or discontinuities? Specialized needs - Topo To Raster (hydro applications) Suspected spatial patterns, trends, error?


20 Interpolation algorithms in ArcGIS - Natural Neighbors - Minimum Curvature Spline - Spline with Barriers - Radial Basis Functions - TopoToRaster - Local Polynomial - Global Polynomial - Diffusion Interpolation with Barriers - Kernel Interpolation with Barriers - Inverse Distance Weighted - Kriging - Cokriging - Moving Window Kriging - Geostatistical Simulation
21 Choosing an interpolation method You know nothing about your data - Use Natural Neighbors. Its is the most conservative, honors the points. Assumes all highs and lows are sampled, will not create artifacts. Going the next step in complexity - Use Kernel Interpolation or Empirical Bayesian Kriging Your surface is not continuous - Use Kernel Interpolation or Spline with Barriers if you know there are faults or other discontinuities in the surface. Your input data is contours - Use TopoToRaster. It is optimized for contour input. If not creating a DEM, turn off the drainage enforcement option. You want a geostatistical method - Use Empirical Bayesian Kriging

22 Considerations in choosing an interpolator Standard error of prediction Stationarity Normally distributed Exact interpolator Support barriers Speed

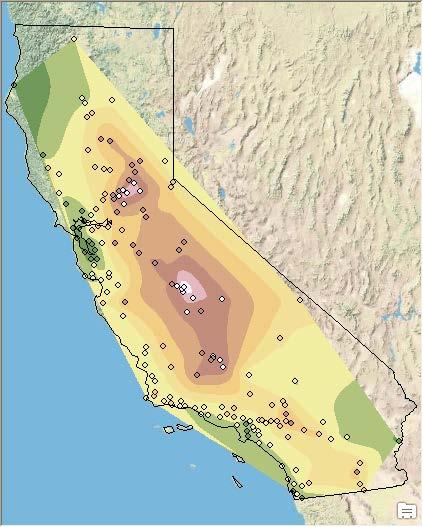
23 The simplest, safest interpolator Natural Neighbor
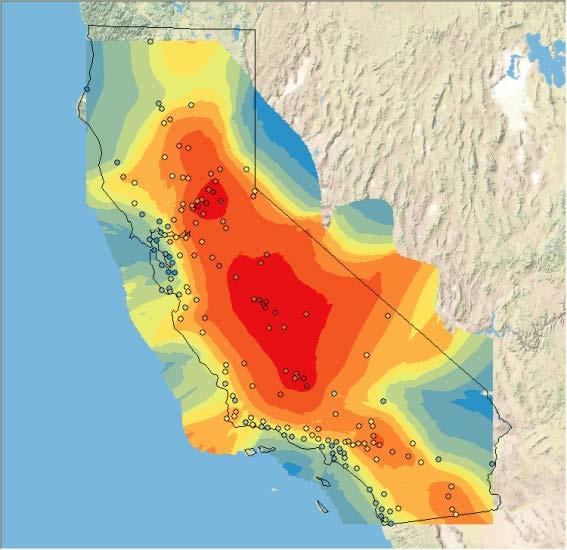
24 Kernel Interpolation
25 Easy Interpolations of Ozone Concentration Demonstration
26 You want a prediction standard error map Choose from: Kernel Interpolation Local Polynomial Interpolation Kriging
27 You want an exact interpolator that honors the points Choose from: Natural Neighbors Spline Radial Basis Function IDW
28 The high and low values have not been sampled and are important Do not use Natural Neighbors IDW

29 You want smooth interpolation Unlike smoothing the output, this method modifies the weights Smooth interpolation is an option in the Geostatistical Analyst interpolators


30 When to use Kriging Assumptions: - Spatially correlated - Stationary * - Normally distributed - or transformed to normal Want prediction and prediction standard error
31 If you know the phenomenon is correlated with something measured more If you have a sparsely measured variable such as temperature, which is correlated with another variable such as elevation that has much more sampling Use CoKriging New tool coming in 10.4 for multivariate prediction


32 Empirical Bayesian Kriging Advantages Requires minimal interactive modeling Allows accurate predictions of non-stationary data More accurate than other kriging methods for small datasets Geoprocessing tool Disadvantages Processing is slower than other kriging methods. Cokriging and anisotropy are unavailable. Also available in ArcGIS Online
33 Kriging Rainfall Demonstration


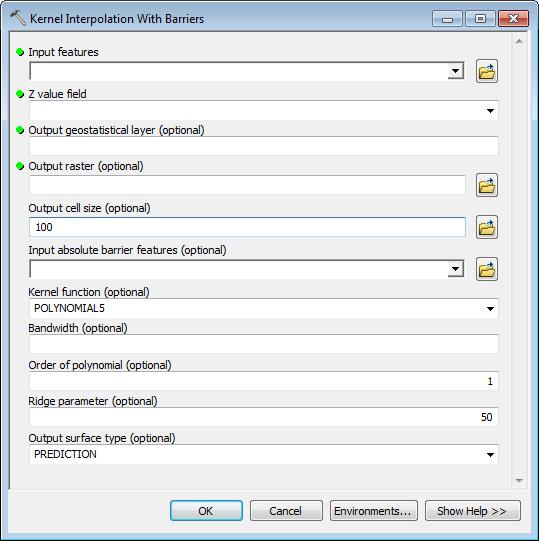
34 Cliffs, faults, or barriers in your study area Kernel Interpolation with Barriers Diffusion Interpolation with Barriers Spline with Barriers tool - Uses Zoraster algorithm, similar result to ZMap - Straight line barrier exclusion
35 Interpolation with Barriers Line of sight Non Euclidean distance?? IDW Kernel Interpolation with Barriers Diffusion Interpolation with Barriers Spline with Barriers
36 Geologic Interpolation with barriers Demonstration


37 For contour input, and creating hydrologic DEMs Topo To Raster - ANUDEM Inputs - Spot heights - Contours - Streams - Sinks - Lakes Optional drainage enforcement


38 TopoToRaster for DEM Creation Demonstration


39 Your input is polygons Use Areal Interpolation Obesity by school zone Obesity surface and error surface Obesity by census block Statistically robust method for creating surfaces from aggregated polygon data And aggregating back to other polygons


40 How good is your surface? Standard Error surface Cross Validation Subset Features


41 Your input is equally spaced points If input points are already equally spaced on a regular grid, you probably don t need to interpolate, just use PointToRaster


42 You have many input points per output cell If your data is highly oversampled, you probably do not need to interpolate, you can just use the PointToRaster tool, and select the statistic of interest.
43 Working with VERY large input point data Point To Raster - Most frequent - Sum, mean std. deviation - Minimum, maximum, range, count Smaller input extent Subset Features
44 The slide to remember 1) Understand your data 2) Experiment with techniques and parameters 3) Create surfaces 4) Evaluate your surfaces 5) Refine parameters and repeat


45 Thank you Please fill out the session survey in your mobile app Select [] in the Mobile App - Use the Search Feature to quickly find this title Click Technical Workshop Survey Answer a few short questions and enter any comments


46
Esri International User Conference. San Diego, California. Technical Workshops. July Creating Surfaces. Steve Kopp and Steve Lynch
 Esri International User Conference San Diego, California Technical Workshops July 2011 Creating Surfaces Steve Kopp and Steve Lynch Overview Learn the types of surfaces and the data structures used to
Getting Started with Spatial Analyst. Steve Kopp Elizabeth Graham
 Getting Started with Spatial Analyst Steve Kopp Elizabeth Graham Spatial Analyst Overview Over 100 geoprocessing tools plus raster functions Raster and vector analysis Construct workflows with ModelBuilder,
Getting Started with Spatial Analyst. Steve Kopp Elizabeth Graham
 Getting Started with Spatial Analyst Steve Kopp Elizabeth Graham Workshop Overview Fundamentals of using Spatial Analyst What analysis capabilities exist and where to find them How to build a simple site
Lesson 5 overview. Concepts. Interpolators. Assessing accuracy Exercise 5
 Interpolation Tools Lesson 5 overview Concepts Sampling methods Creating continuous surfaces Interpolation Density surfaces in GIS Interpolators IDW, Spline,Trend, Kriging,Natural neighbors TopoToRaster
Surface Analysis with 3D Analyst
 2013 Esri International User Conference July 8 12, 2013 San Diego, California Technical Workshop Surface Analysis with 3D Analyst Khalid H. Duri Esri UC2013. Technical Workshop. Why use 3D GIS? Because
Introduction to 3D Analysis. Jinwu Ma Jie Chang Khalid Duri
 Introduction to 3D Analysis Jinwu Ma Jie Chang Khalid Duri Area & Volume 3D Analyst Features Detect Change Determine Cut/Fill Calculate Surface Area & Volume Data Management Data Creation Data Conversion
Surface Creation & Analysis with 3D Analyst
 Esri International User Conference July 23 27 San Diego Convention Center Surface Creation & Analysis with 3D Analyst Khalid Duri Surface Basics Defining the surface Representation of any continuous measurement
Statistical surfaces and interpolation. This is lecture ten
 Statistical surfaces and interpolation This is lecture ten Data models for representation of surfaces So far have considered field and object data models (represented by raster and vector data structures).
Watershed Sciences 4930 & 6920 GEOGRAPHIC INFORMATION SYSTEMS
 HOUSEKEEPING Watershed Sciences 4930 & 6920 GEOGRAPHIC INFORMATION SYSTEMS Quizzes Lab 8? WEEK EIGHT Lecture INTERPOLATION & SPATIAL ESTIMATION Joe Wheaton READING FOR TODAY WHAT CAN WE COLLECT AT POINTS?
Spatial Interpolation & Geostatistics
 (Z i Z j ) 2 / 2 Spatial Interpolation & Geostatistics Lag Lag Mean Distance between pairs of points 1 Tobler s Law All places are related, but nearby places are related more than distant places Corollary:
What can we represent as a Surface?
 Geography 38/42:376 GIS II Topic 7: Surface Representation and Analysis (Chang: Chapters 13 & 15) DeMers: Chapter 10 What can we represent as a Surface? Surfaces can be used to represent: Continuously
Spatial Interpolation - Geostatistics 4/3/2018
 Spatial Interpolation - Geostatistics 4/3/201 (Z i Z j ) 2 / 2 Spatial Interpolation & Geostatistics Lag Distance between pairs of points Lag Mean Tobler s Law All places are related, but nearby places
Geol 588. GIS for Geoscientists II. Zonal functions. Feb 22, Zonal statistics. Interpolation. Zonal statistics Sp. Analyst Tools - Zonal.
 Zonal functions Geol 588 GIS for Geoscientists II Feb 22, 2011 Zonal statistics Interpolation Zonal statistics Sp. Analyst Tools - Zonal Choose correct attribute for zones (usually: must be unique ID for
GEOGRAPHIC INFORMATION SYSTEMS Lecture 24: Spatial Analyst Continued
 GEOGRAPHIC INFORMATION SYSTEMS Lecture 24: Spatial Analyst Continued Spatial Analyst - Spatial Analyst is an ArcGIS extension designed to work with raster data - in lecture I went through a series of demonstrations
Spatial Analysis (Vector) II
 II") Spatial Analysis (Vector) II GEOG 300, Lecture 9 Dr. Anthony Jjumba 1 A Spatial Network is a set of geographic locations interconnected in a system by a number of routes is a system of linear features
Spatial Analysis (Vector) II GEOG 300, Lecture 9 Dr. Anthony Jjumba 1 A Spatial Network is a set of geographic locations interconnected in a system by a number of routes is a system of linear features
GIS Tools - Geometry. A GIS stores data as different layers of information Different feature types are stored in individual files.
 A Definition of GIS GIS is a system of hardware, software, and procedures designed to support the capture, management, manipulation, analysis, modeling and display of spatially referenced data for solving
Cell based GIS. Introduction to rasters
 Week 9 Cell based GIS Introduction to rasters topics of the week Spatial Problems Modeling Raster basics Application functions Analysis environment, the mask Application functions Spatial Analyst in ArcGIS
PUG List. Raster Analysis 3D Analysis Geoprocessing. Steve Kopp
 PUG List Raster Analysis 3D Analysis Geoprocessing Steve Kopp Contour Polygons Spatial Analyst - color-filled contours. Similar to thematic classification, where blue = -1000 to zero, and red = 0 to +1000,
Lecture 9. Raster Data Analysis. Tomislav Sapic GIS Technologist Faculty of Natural Resources Management Lakehead University
 Lecture 9 Raster Data Analysis Tomislav Sapic GIS Technologist Faculty of Natural Resources Management Lakehead University Raster Data Model The GIS raster data model represents datasets in which square
Spatial Interpolation & Geostatistics
 (Z i Z j ) 2 / 2 Spatial Interpolation & Geostatistics Lag Lag Mean Distance between pairs of points 11/3/2016 GEO327G/386G, UT Austin 1 Tobler s Law All places are related, but nearby places are related
Lecture 6: GIS Spatial Analysis. GE 118: INTRODUCTION TO GIS Engr. Meriam M. Santillan Caraga State University
 Lecture 6: GIS Spatial Analysis GE 118: INTRODUCTION TO GIS Engr. Meriam M. Santillan Caraga State University 1 Spatial Data It can be most simply defined as information that describes the distribution
Geographic Information Systems (GIS) Spatial Analyst [10] Dr. Mohammad N. Almasri. [10] Spring 2018 GIS Dr. Mohammad N. Almasri Spatial Analyst
![Geographic Information Systems (GIS) Spatial Analyst [10] Dr. Mohammad N. Almasri. [10] Spring 2018 GIS Dr. Mohammad N. Almasri Spatial Analyst](/thumbs/80/81171101.jpg "Geographic Information Systems (GIS) Spatial Analyst [10] Dr. Mohammad N. Almasri. [10] Spring 2018 GIS Dr. Mohammad N. Almasri Spatial Analyst") Geographic Information Systems (GIS) Spatial Analyst [10] Dr. Mohammad N. Almasri 1 Preface POINTS, LINES, and POLYGONS are good at representing geographic objects with distinct shapes They are less good
Geographic Information Systems (GIS) Spatial Analyst [10] Dr. Mohammad N. Almasri 1 Preface POINTS, LINES, and POLYGONS are good at representing geographic objects with distinct shapes They are less good
Spatial Analysis and Modeling (GIST 4302/5302) Guofeng Cao Department of Geosciences Texas Tech University
 Guofeng Cao Department of Geosciences Texas Tech University") Spatial Analysis and Modeling (GIST 4302/5302) Guofeng Cao Department of Geosciences Texas Tech University 1 Outline of This Week Last topic, we learned: Spatial autocorrelation of areal data Spatial regression
Spatial Analysis and Modeling (GIST 4302/5302) Guofeng Cao Department of Geosciences Texas Tech University 1 Outline of This Week Last topic, we learned: Spatial autocorrelation of areal data Spatial regression
Creating raster DEMs and DSMs from large lidar point collections. Summary. Coming up with a plan. Using the Point To Raster geoprocessing tool
 Page 1 of 5 Creating raster DEMs and DSMs from large lidar point collections ArcGIS 10 Summary Raster, or gridded, elevation models are one of the most common GIS data types. They can be used in many ways
Accuracy, Support, and Interoperability. Michael F. Goodchild University of California Santa Barbara
 Accuracy, Support, and Interoperability Michael F. Goodchild University of California Santa Barbara The traditional view Every object has a true position and set of attributes with enough time and resources
Contents of Lecture. Surface (Terrain) Data Models. Terrain Surface Representation. Sampling in Surface Model DEM
 Data Models. Terrain Surface Representation. Sampling in Surface Model DEM") Lecture 13: Advanced Data Models: Terrain mapping and Analysis Contents of Lecture Surface Data Models DEM GRID Model TIN Model Visibility Analysis Geography 373 Spring, 2006 Changjoo Kim 11/29/2006 1
Lecture 13: Advanced Data Models: Terrain mapping and Analysis Contents of Lecture Surface Data Models DEM GRID Model TIN Model Visibility Analysis Geography 373 Spring, 2006 Changjoo Kim 11/29/2006 1
Geographic Surfaces. David Tenenbaum EEOS 383 UMass Boston
 Geographic Surfaces Up to this point, we have talked about spatial data models that operate in two dimensions How about the rd dimension? Surface the continuous variation in space of a third dimension
Raster Data. James Frew ESM 263 Winter
 Raster Data 1 Vector Data Review discrete objects geometry = points by themselves connected lines closed polygons attributes linked to feature ID explicit location every point has coordinates 2 Fields
Esri International User Conference. July San Diego Convention Center. Lidar Solutions. Clayton Crawford
 Esri International User Conference July 23 27 San Diego Convention Center Lidar Solutions Clayton Crawford Outline Data structures, tools, and workflows Assessing lidar point coverage and sample density
Copyright The McGraw-Hill Companies, Inc. Permission required for reproduction or display.
 Chapter 13. TERRAIN MAPPING AND ANALYSIS 13.1 Data for Terrain Mapping and Analysis 13.1.1 DEM 13.1.2 TIN Box 13.1 Terrain Data Format 13.2 Terrain Mapping 13.2.1 Contouring 13.2.2 Vertical Profiling 13.2.3
Report: Comparison of Methods to Produce Digital Terrain Models
 Report: Comparison of Methods to Produce Digital Terrain Models Evan J Fedorko West Virginia GIS Technical Center 27 April 2005 Introduction This report compares Digital Terrain Models (DTM) created through
Your Prioritized List. Priority 1 Faulted gridding and contouring. Priority 2 Geoprocessing. Priority 3 Raster format
 Your Prioritized List Priority 1 Faulted gridding and contouring Priority 2 Geoprocessing Priority 3 Raster format Priority 4 Raster Catalogs and SDE Priority 5 Expanded 3D Functionality Priority 1 Faulted
Masking Lidar Cliff-Edge Artifacts
 Masking Lidar Cliff-Edge Artifacts Methods 6/12/2014 Authors: Abigail Schaaf is a Remote Sensing Specialist at RedCastle Resources, Inc., working on site at the Remote Sensing Applications Center in Salt
What s New in Desktop 10.1
 What s New in Desktop 10.1 Damian Spangrud Esri Redlands Trip Down Memory Lane ArcGIS A Complete System for Geographic Information Cloud Web Online Mobile Enterprise Desktop Sharing Information sharing
Image Services for Elevation Data
 Image Services for Elevation Data Peter Becker Need for Elevation Using Image Services for Elevation Data sources Creating Elevation Service Requirement: GIS and Imagery, Integrated and Accessible Field
Lab 12: Sampling and Interpolation
 Lab 12: Sampling and Interpolation What You ll Learn: -Systematic and random sampling -Majority filtering -Stratified sampling -A few basic interpolation methods Videos that show how to copy/paste data
Representing Geography
 Data models and axioms Chapters 3 and 7 Representing Geography Road map Representing the real world Conceptual models: objects vs fields Implementation models: vector vs raster Vector topological model
GEOGRAPHIC INFORMATION SYSTEMS Lecture 18: Spatial Modeling
 Spatial Analysis in GIS (cont d) GEOGRAPHIC INFORMATION SYSTEMS Lecture 18: Spatial Modeling - the basic types of analysis that can be accomplished with a GIS are outlined in The Esri Guide to GIS Analysis
The 3D Analyst extension extends ArcGIS to support surface modeling and 3- dimensional visualization. 3D Shape Files
 NRM 435 Spring 2016 ArcGIS 3D Analyst Page#1 of 9 0B3D Analyst Extension The 3D Analyst extension extends ArcGIS to support surface modeling and 3- dimensional visualization. 3D Shape Files Analogous to
Lab 12: Sampling and Interpolation
 Lab 12: Sampling and Interpolation What You ll Learn: -Systematic and random sampling -Majority filtering -Stratified sampling -A few basic interpolation methods Data for the exercise are found in the
BRIEF EXAMPLES OF PRACTICAL USES OF LIDAR
 BRIEF EXAMPLES OF PRACTICAL USES OF LIDAR PURDUE ROAD SCHOOL - 3/9/2016 CHRIS MORSE USDA-NRCS, STATE GIS COORDINATOR LIDAR/DEM SOURCE DATES LiDAR and its derivatives (DEMs) have a collection date for data
Surface Analysis. Data for Surface Analysis. What are Surfaces 4/22/2010
 Surface Analysis Cornell University Data for Surface Analysis Vector Triangulated Irregular Networks (TIN) a surface layer where space is partitioned into a set of non-overlapping triangles Attribute and
Gridding and Contouring in Geochemistry for ArcGIS
 Gridding and Contouring in Geochemistry for ArcGIS The Geochemsitry for ArcGIS extension includes three gridding options: Minimum Curvature Gridding, Kriging and a new Inverse Distance Weighting algorithm.
Field-Scale Watershed Analysis
 Conservation Applications of LiDAR Field-Scale Watershed Analysis A Supplemental Exercise for the Hydrologic Applications Module Andy Jenks, University of Minnesota Department of Forest Resources 2013
IMPROVING THE ACCURACY OF DIGITAL TERRAIN MODELS
 STUDIA UNIV. BABEŞ BOLYAI, INFORMATICA, Volume XLV, Number 1, 2000 IMPROVING THE ACCURACY OF DIGITAL TERRAIN MODELS GABRIELA DROJ Abstract. The change from paper maps to GIS, in various kinds of geographical
Steps for Modeling a Proposed New Reservoir in GIS
 Steps for Modeling a Proposed New Reservoir in GIS Requirements: ArcGIS ArcMap, ArcScene, Spatial Analyst, and 3D Analyst There s a new reservoir proposed for Right Hand Fork in Logan Canyon. I wanted
Lab 11: Terrain Analyses
 Lab 11: Terrain Analyses What You ll Learn: Basic terrain analysis functions, including watershed, viewshed, and profile processing. There is a mix of old and new functions used in this lab. We ll explain
University of West Hungary, Faculty of Geoinformatics. Béla Márkus. Spatial Analysis 5. module SAN5. 3D analysis
 University of West Hungary, Faculty of Geoinformatics Béla Márkus Spatial Analysis 5. module SAN5 3D analysis SZÉKESFEHÉRVÁR 2010 The right to this intellectual property is protected by the 1999/LXXVI
Lidar and GIS: Applications and Examples. Dan Hedges Clayton Crawford
 Lidar and GIS: Applications and Examples Dan Hedges Clayton Crawford Outline Data structures, tools, and workflows Assessing lidar point coverage and sample density Creating raster DEMs and DSMs Data area
GIS Tools for Hydrology and Hydraulics
 1 OUTLINE GIS Tools for Hydrology and Hydraulics INTRODUCTION Good afternoon! Welcome and thanks for coming. I once heard GIS described as a high-end Swiss Army knife: lots of tools in one little package
ArcGIS 10.1 for Desktop Artie Robinson
 ArcGIS 10.1 for Desktop Artie Robinson ArcGIS A Complete System for Geographic Information Cloud Web Online Mobile Enterprise Desktop Name Change Name Prior to 10.1 ArcGIS Desktop ArcInfo ArcEditor ArcView
Lab 12: Sampling and Interpolation
 Lab 12: Sampling and Interpolation What You ll Learn: -Systematic and random sampling -Majority filtering -Stratified sampling -A few basic interpolation methods Data for the exercise are in the L12 subdirectory.
Delineating Watersheds from a Digital Elevation Model (DEM)
") Delineating Watersheds from a Digital Elevation Model (DEM) (Using example from the ESRI virtual campus found at http://training.esri.com/courses/natres/index.cfm?c=153) Download locations for additional
Delineating Watersheds from a Digital Elevation Model (DEM) (Using example from the ESRI virtual campus found at http://training.esri.com/courses/natres/index.cfm?c=153) Download locations for additional
Geostatistics Predictions with Deterministic Procedures
 Instituto Superior de Estatística e Gestão de Informação Universidade Nova de Lisboa Master of Science in Geospatial Technologies Geostatistics Predictions with Deterministic Procedures Carlos Alberto
Lecture 4: Digital Elevation Models
 Lecture 4: Digital Elevation Models GEOG413/613 Dr. Anthony Jjumba 1 Digital Terrain Modeling Terms: DEM, DTM, DTEM, DSM, DHM not synonyms. The concepts they illustrate are different Digital Terrain Modeling
INTRODUCTION TO GIS WORKSHOP EXERCISE
 111 Mulford Hall, College of Natural Resources, UC Berkeley (510) 643-4539 INTRODUCTION TO GIS WORKSHOP EXERCISE This exercise is a survey of some GIS and spatial analysis tools for ecological and natural
Practical II ArcGIS (10.0) for IWCM
 for IWCM") Author: A.Priki Practical II ArcGIS (10.0) for IWCM AIM: In this workshop we will introduce some of the most commonly used ArcGIS functionalities for Integrated Water Cycle Management. You will get a chance
Author: A.Priki Practical II ArcGIS (10.0) for IWCM AIM: In this workshop we will introduce some of the most commonly used ArcGIS functionalities for Integrated Water Cycle Management. You will get a chance
L7 Raster Algorithms
 L7 Raster Algorithms NGEN6(TEK23) Algorithms in Geographical Information Systems by: Abdulghani Hasan, updated Nov 216 by Per-Ola Olsson Background Store and analyze the geographic information: Raster
Dijkstra's Algorithm
 Shortest Path Algorithm Dijkstra's Algorithm To find the shortest path from the origin node to the destination node No matrix calculation Floyd s Algorithm To find all the shortest paths from the nodes
Applied Cartography and Introduction to GIS GEOG 2017 EL. Lecture-7 Chapters 13 and 14
 Applied Cartography and Introduction to GIS GEOG 2017 EL Lecture-7 Chapters 13 and 14 Data for Terrain Mapping and Analysis DEM (digital elevation model) and TIN (triangulated irregular network) are two
Exercise 5. Height above Nearest Drainage Flood Inundation Analysis
 Exercise 5. Height above Nearest Drainage Flood Inundation Analysis GIS in Water Resources, Fall 2018 Prepared by David G Tarboton Purpose The purpose of this exercise is to learn how to calculation the
APPENDIX E2. Vernal Pool Watershed Mapping
 APPENDIX E2 Vernal Pool Watershed Mapping MEMORANDUM To: U.S. Fish and Wildlife Service From: Tyler Friesen, Dudek Subject: SSHCP Vernal Pool Watershed Analysis Using LIDAR Data Date: February 6, 2014
Geostatistics 2D GMS 7.0 TUTORIALS. 1 Introduction. 1.1 Contents
 GMS 7.0 TUTORIALS 1 Introduction Two-dimensional geostatistics (interpolation) can be performed in GMS using the 2D Scatter Point module. The module is used to interpolate from sets of 2D scatter points
DEM Artifacts: Layering or pancake effects
 Outcomes DEM Artifacts: Stream networks & watersheds derived using ArcGIS s HYDROLOGY routines are only as good as the DEMs used. - Both DEM examples below have problems - Lidar and SRTM DEM products are
LORI COLLINS, RESEARCH ASSOCIATE PROFESSOR CONTRIBUTIONS BY: RICHARD MCKENZIE AND GARRETT SPEED, DHHC USF L IBRARIES
 LORI COLLINS, RESEARCH ASSOCIATE PROFESSOR CONTRIBUTIONS BY: RICHARD MCKENZIE AND GARRETT SPEED, DHHC USF L IBRARIES AERIAL AND TERRESTRIAL SURVEY WORKFLOWS Workflow from project planning applications
Investigation of Sampling and Interpolation Techniques for DEMs Derived from Different Data Sources
 Investigation of Sampling and Interpolation Techniques for DEMs Derived from Different Data Sources FARRAG ALI FARRAG 1 and RAGAB KHALIL 2 1: Assistant professor at Civil Engineering Department, Faculty
GEOGRAPHIC INFORMATION SYSTEMS Lecture 25: 3D Analyst
 GEOGRAPHIC INFORMATION SYSTEMS Lecture 25: 3D Analyst 3D Analyst - 3D Analyst is an ArcGIS extension designed to work with TIN data (triangulated irregular network) - many of the tools in 3D Analyst also
An Introduction to Using Lidar with ArcGIS and 3D Analyst
 FedGIS Conference February 24 25, 2016 Washington, DC An Introduction to Using Lidar with ArcGIS and 3D Analyst Jim Michel Outline Lidar Intro Lidar Management Las files Laz, zlas, conversion tools Las
Spa$al Analysis and Modeling (GIST 4302/5302) Guofeng Cao Department of Geosciences Texas Tech University
 Guofeng Cao Department of Geosciences Texas Tech University") Spa$al Analysis and Modeling (GIST 432/532) Guofeng Cao Department of Geosciences Texas Tech University Representa$on of Spa$al Data Representa$on of Spa$al Data Models Object- based model: treats the
Spa$al Analysis and Modeling (GIST 432/532) Guofeng Cao Department of Geosciences Texas Tech University Representa$on of Spa$al Data Representa$on of Spa$al Data Models Object- based model: treats the
Follow-Up on the Nueces River Groundwater Problem Uvalde Co. TX
 Follow-Up on the Nueces River Groundwater Problem Uvalde Co. TX Analysis by Ryan Kraft 12/4/2014 1 Problem Formulation A reduction in discharge was detected at a gauging station along a portion of the
ArcGIS Enterprise Building Raster Analytics Workflows. Mike Muller, Jie Zhang
 ArcGIS Enterprise Building Raster Analytics Workflows Mike Muller, Jie Zhang Introduction and Context Raster Analytics What is Raster Analytics? The ArcGIS way to create and execute spatial analysis models
Thoughts on Representing Spatial Objects. William A. Huber Quantitative Decisions Rosemont, PA
 Thoughts on Representing Spatial Objects William A. Huber Quantitative Decisions Rosemont, PA Overview 1. Some Ways to Structure Space 2. What to Put into a Grid 3. Objects and Fields 4. Hybrid Structures
Mapping Distance and Density
 Mapping Distance and Density Distance functions allow you to determine the nearest location of something or the least-cost path to a particular destination. Density functions, on the other hand, allow
Tools, Tips, and Workflows Exporting Final Product LP360
 LP360 Support Revision 1.0 l Final products can be exported from LIDAR data using either LP360 command line executables or the LP360 Export Wizard. Some export functions and resulting products include,
Surface Modeling with GIS
 Surface Modeling with GIS By Abdul Mohsen Al Maskeen ID # 889360 For CRP 514: Introduction to GIS Course Instructor: Dr. Baqer Al-Ramadan Date: December 29, 2004 1 Outline Page # Outline -------------------------------------------------------------
Class #2. Data Models: maps as models of reality, geographical and attribute measurement & vector and raster (and other) data structures
 data structures") Class #2 Data Models: maps as models of reality, geographical and attribute measurement & vector and raster (and other) data structures Role of a Data Model Levels of Data Model Abstraction GIS as Digital
Class #2 Data Models: maps as models of reality, geographical and attribute measurement & vector and raster (and other) data structures Role of a Data Model Levels of Data Model Abstraction GIS as Digital
Geo372 Vertiefung GIScience. Spatial Interpolation
 Geo372 Vertiefung GIScience Spatial Interpolation Herbstsemester Ross Purves Last week We looked at data quality and integration We saw how uncertainty could be introduced by the concepts we chose, by
Lab 11: Terrain Analyses
 Lab 11: Terrain Analyses What You ll Learn: Basic terrain analysis functions, including watershed, viewshed, and profile processing. There is a mix of old and new functions used in this lab. We ll explain
WMS 9.1 Tutorial Hydraulics and Floodplain Modeling Floodplain Delineation Learn how to us the WMS floodplain delineation tools
 v. 9.1 WMS 9.1 Tutorial Hydraulics and Floodplain Modeling Floodplain Delineation Learn how to us the WMS floodplain delineation tools Objectives Experiment with the various floodplain delineation options
GIS IN ECOLOGY: MORE RASTER ANALYSES
 GIS IN ECOLOGY: MORE RASTER ANALYSES Contents Introduction... 2 More Raster Application Functions... 2 Data Sources... 3 Tasks... 4 Raster Recap... 4 Viewshed Determining Visibility... 5 Hydrology Modeling
Should Contours Be Generated from Lidar Data, and Are Breaklines Required? Lidar data provides the most
 Should Contours Be Generated from Lidar Data, and Are Breaklines Required? Lidar data provides the most accurate and reliable representation of the topography of the earth. As lidar technology advances
Python - Raster Analysis
 Esri International User Conference San Diego, California Technical Workshops July 2012 Python - Raster Analysis Kevin M. Johnston Ryan DeBruyn The problem that is being addressed You have a complex modeling
Stream network delineation and scaling issues with high resolution data
 Stream network delineation and scaling issues with high resolution data Roman DiBiase, Arizona State University, May 1, 2008 Abstract: In this tutorial, we will go through the process of extracting a stream
Raster Data. James Frew ESM 263 Winter
 Raster Data 1 Vector Data Review discrete objects geometry = points by themselves connected lines closed polygons agributes linked to feature ID explicit localon every point has coordinates 2 Fields in
The Reference Library Generating Low Confidence Polygons
 GeoCue Support Team In the new ASPRS Positional Accuracy Standards for Digital Geospatial Data, low confidence areas within LIDAR data are defined to be where the bare earth model might not meet the overall
GEOGRAPHIC INFORMATION SYSTEMS Lecture 02: Feature Types and Data Models
 GEOGRAPHIC INFORMATION SYSTEMS Lecture 02: Feature Types and Data Models Feature Types and Data Models How Does a GIS Work? - a GIS operates on the premise that all of the features in the real world can
Introduction to the Image Analyst Extension. Mike Muller, Vinay Viswambharan
 Introduction to the Image Analyst Extension Mike Muller, Vinay Viswambharan What is the Image Analyst Extension? The Image Analyst Extension (IA) is an application extension which extends ArcGIS Pro with
FILTERING OF DIGITAL ELEVATION MODELS
 FILTERING OF DIGITAL ELEVATION MODELS Dr. Ing. Karsten Jacobsen Institute for Photogrammetry and Engineering Survey University of Hannover, Germany e-mail: jacobsen@ipi.uni-hannover.de Dr. Ing. Ricardo
USING GEOMEDIA 3D: HOTSPOT DETECTION AND VISUALIZATION
 USING GEOMEDIA 3D: HOTSPOT DETECTION AND VISUALIZATION etraining Introduction Use GeoMedia and GeoMedia 3D for hotspot detection and visualization. Software GeoMedia and GeoMedia 3D Data QuickBird-2 image
Python Raster Analysis. Kevin M. Johnston Nawajish Noman
 Python Raster Analysis Kevin M. Johnston Nawajish Noman Outline Managing rasters and performing analysis with Map Algebra How to access the analysis capability - Demonstration Complex expressions and optimization
Local Elevation Surface Modeling using GPS Derived Point Clouds. John G. Whitman, Jr.
 Local Elevation Surface Modeling using GPS Derived Point Clouds WhitmanJ2@myfairpoint.net Study Area Overview Topographic Background NAIP with Roads and Streams Public DEM Models of Study Area National
RASTER ANALYSIS GIS Analysis Fall 2013
 RASTER ANALYSIS GIS Analysis Fall 2013 Raster Data The Basics Raster Data Format Matrix of cells (pixels) organized into rows and columns (grid); each cell contains a value representing information. What
Generating a New Shapefile
 Week 9 Generating a New Shapefile STEPS 1) Select a appropriate folder or folder connection in the Catalog tree. 2) Click on Contents tab and move cursor into that window 3) Right click in that window
CPSC 695. Methods for interpolation and analysis of continuing surfaces in GIS Dr. M. Gavrilova
 CPSC 695 Methods for interpolation and analysis of continuing surfaces in GIS Dr. M. Gavrilova Overview Data sampling for continuous surfaces Interpolation methods Global interpolation Local interpolation
Module 7 Raster operations
 Introduction Geo-Information Science Practical Manual Module 7 Raster operations 7. INTRODUCTION 7-1 LOCAL OPERATIONS 7-2 Mathematical functions and operators 7-5 Raster overlay 7-7 FOCAL OPERATIONS 7-8
Using GIS to Site Minimal Excavation Helicopter Landings
 Using GIS to Site Minimal Excavation Helicopter Landings The objective of this analysis is to develop a suitability map for aid in locating helicopter landings in mountainous terrain. The tutorial uses
Beyond The Vector Data Model - Part Two
 Beyond The Vector Data Model - Part Two Introduction Spatial Analyst Extension (Spatial Analysis) What is your question? Selecting a method of analysis Map Algebra Who is the audience? What is Spatial
GIS Exercise - Spring, 2011
 GIS Exercise - Spring, 2011 Maria Antonia Brovelli Laura Carcano, Marco Minghini ArcGIS exercise 3 - Global trend removal Introduction: Besides exploring statistical characteristics and distributional
Point clouds and DEMs
 Point clouds and DEMs J Ramón Arrowsmith School of Earth and Space Exploration Arizona State University Christopher J. Crosby UNAVCO Tutorial notes (April 2016) Point clouds and DEMs 1. Download tahoe.las
Spatial Density Distribution
 GeoCue Group Support Team 5/28/2015 Quality control and quality assurance checks for LIDAR data continue to evolve as the industry identifies new ways to help ensure that data collections meet desired