5. Introduction to Procedures
|
|
|
- Loren Whitehead
- 5 years ago
- Views:
Transcription
1 5. Introduction to Procedures Topics: The module SimpleGraphics Creating and Showing figures Drawing Rectangles, Disks, and Stars Optional arguments Application Scripts
2 Procedures We continue our introduction to functions with a focus on procedures. Procedures are functions that do not return a value. Instead, they do something. Graphics is a good place to illustrate the idea.
3 The Module SimpleGraphics Has Eight Procedures SimpleGraphics.py MakeWindow ShowWindow DrawRect DrawDisk DrawStar DrawLineSeg DrawText We will use this module to make designs that involve rectangles, disks, stars, etc Title

4 Examples Looks like we will be able to draw tilted rectangles
5 Example How does color work? What if we had 100 rows each with 100 stars? Anticipating loops.
6 Example Xeno s Paradox: Will we ever reach the right edge?
7 Example White Rectangle + Red Rectangle + White Disk + Red Disk + Tilted White Star
8 Example Let s write a function to draw this: And then apply it two times: Functions calling other functions.
9 After We Learn About Iteration What if there were billions and billions of stars? Will need loops.
10 After We Learn About Iteration How long before the square is covered? Need loops.

11 After We Learn About Recursion Random Mondrian. Repeatedly cut a rectangle into 4 smaller rectangles.
12 A Quick Tour Through the SimpleGraphics Module We now show how to use the eight procedures in SimpleGraphics: MakeWindow ShowWindow DrawRect DrawDisk DrawStar DrawLineSeg DrawText Title Each of these procedures has several options. We do not cover everything in the lecture slides. Labs and demo scripts cover these procedures in greater detail.
13 First: Create a Figure Window You cannot create any designs until you have a figure into which you can drop rectangles, disks, and stars.
14 MakeWindow from SimpleGraphics import * n = 5 MakeWindow(n) Here we have created a figure with labeled axes that is ready to display things in the square defined by -5<=x<=+5, -5<=y<=5
15 MakeWindow from SimpleGraphics import* n = 5 MakeWindow(n,bgcolor=PURPLE) The default is to paint the figure window white. So this is what you must do to set the background color to something different.
16 MakeWindow from SimpleGraphics import* n = 5 MakeWindow(n,labels=False) The default is to label the axes. So this is what you must do to suppress the labeling. We are using import * to save space and because it is such a tiny module.
17 Color in simplegraphics The module has thirteen built-in colors. If a SimpleGraphics procedure wants a color, just hand over one of these: YELLOW PURPLE CYAN ORANGE RED BLUE GREEN MAGENTA PINK WHITE BLACK LIGHTGRAY DARKGRAY There is more flexibility than this. More later.
18 MakeWindow from SimpleGraphics import* n = 5 MakeWindow(n,labels=False,bgcolor=ORANGE) You can turn off labeling and specify a color in the same call to MakeWindow.
19 Optional Arguments The function MakeWindow has four arguments. Three of the arguments are optional. When there are several optional arguments, their order is immaterial. These are equivalent: MakeWindow(n,labels=False,bgcolor=ORANGE) MakeWindow(n,bgcolor=ORANGE,labels=False) Note: You need the assignment for an optional argument. This is illegal: MakeWindow(5,False,ORANGE)
20 Let s Draw a Rectangle with DrawRect You must tell DrawRect - the center of the rectangle. - the horizontal dimension of the rectangle - the vertical dimension of the rectangle You have the option of telling DrawRect - the fill color - the width of the perimeter highlight - the color of the perimeter highlight - the rotation angle
21 DrawRect from SimpleGraphics import* MakeWindow(5,bgcolor=YELLOW) x=0; y=0; L=5; W=3 DrawRect(x,y,L,W) ShowWindow() Nothing is actually displayed until this command is executed. More later. The default is a rectangle with no fill color. So all you get is the perimeter.
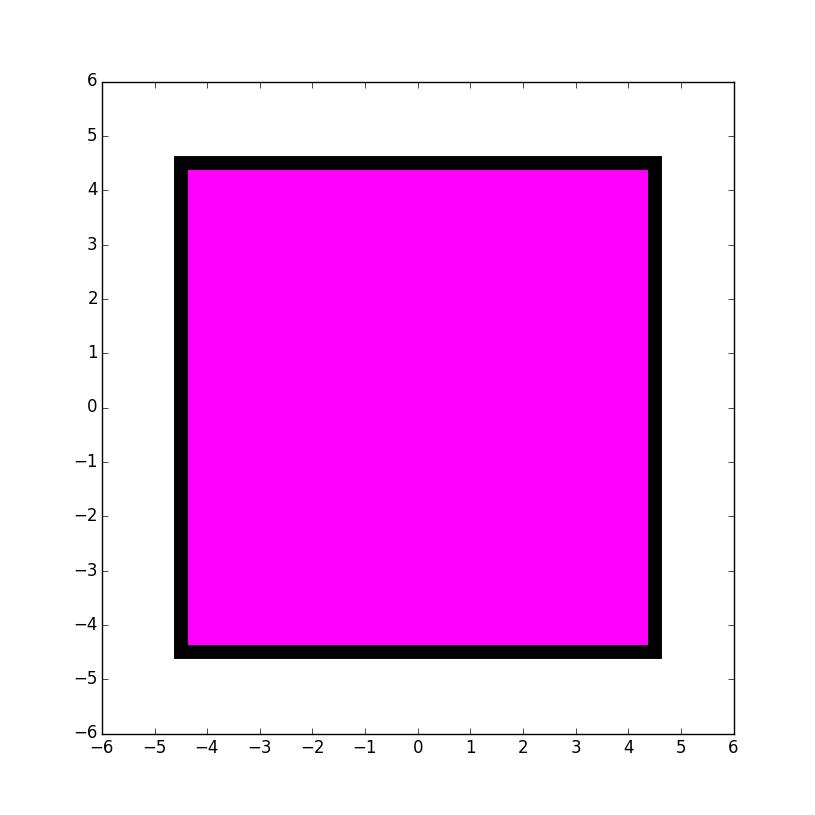
22 DrawRect from SimpleGraphics import* MakeWindow(5,bgcolor=YELLOW) x=0; y=0; L=5; W=3 DrawRect(x,y,L,W,FillColor=MAGENTA) ShowWindow() Use the optional color argument to specify a fill color.

23 DrawRect from simplegraphics import* MakeWindow(5,bgcolor=YELLOW) x=0; y=0; L=5; W=3 DrawRect(x,y,L,W,FillColor=MAGENTA,EdgeWidth=6) ShowWindow() Use the optional EdgeWidth argument to specify the boldness of the perimeter highlight. The default is EdgeWidth = 1 If you don t want any perimeter highlight, set EdgeWidth=0
24 DrawRect from SimpleGraphics import* MakeWindow(5,bgcolor=YELLOW) x=0; y=0; L=5; W=3 DrawRect(x,y,L,W,color=MAGENTA,theta=30) ShowWindow() Use the optional theta argument to specify the counterclockwise rotation of the rectangle about its center. (Angle in degrees.) The default rotation angle is zero.
25 Let s Write a Script to Do This The squares are 9x9, 7x7, 5x5, 3x3, and 1x1.
26 Nested Squares DrawRect(0,0,9,9,FillColor=MAGENTA, EdgeWidth=10)
27 DrawRect DrawRect(0,0,7,7,FillColor=CYAN, EdgeWidth=8)
28 Nested Squares DrawRect(0,0,5,5,FillColor=YELLOW, EdgeWidth=6)
29 DrawRect DrawRect(0,0,3,3,FillColor=PURPLE, EdgeWidth=4)
30 Nested Squares DrawRect(0,0,1,1,EdgeWidth=5)
31 Nested Squares MakeWindow(6,bgcolor=WHITE) DrawRect(0,0,9,9,FillColor=MAGENTA, EdgeWidth=10) DrawRect(0,0,7,7,FillColor=CYAN, EdgeWidth=8) DrawRect(0,0,5,5,FillColor=YELLOW, EdgeWidth=6) DrawRect(0,0,3,3,FillColor=PURPLE, EdgeWidth=4) DrawRect(0,0,1,1,EdgeWidth=5) ShowWindow()
32 Let s Draw a Disk with DrawDisk You must tell DrawDisk - the center of the disk. - the radius of the disk You have the option of telling DrawDisk - the fill color - the width of the perimeter highlight - the color of the perimeter highlight
 ShowWindow() The default is a circle with no fill color.")
33 DrawDisk from SimpleGraphics import* MakeWindow(5,bgcolor=YELLOW) x=0; y=0; r=4 DrawDisk(x,y,r) ShowWindow() The default is a circle with no fill color. So all you get is the perimeter.
 ShowWindow() Use the optional color argument to specify a")
34 DrawDisk from SimpleGraphics import* MakeWindow(5,bgcolor=YELLOW) x=0; y=0; r=4 DrawDisk(x,y,r,FillColor=MAGENTA) ShowWindow() Use the optional color argument to specify a fill color.
35 DrawDisk from SimpleGraphics import* MakeWindow(5,bgcolor=YELLOW) x=0; y=0; r=4 DrawDisk(x,y,r,FillColor=MAGENTA,EdgeWidth=6) ShowWindow() Use the optional EdgeWidth argument to specify the boldness of the perimeter highlight. The default is EdgeWidth = 1 If you don t want any perimeter highlight, set EdgeWidth=0
36 Let s Draw This Rules: Big circle center at (-4,0) with radius 4. Circles are tangent to each other. Centers on x-axis. Each circle has half the radius of its left neighbor.
37 Draw the First Disk x = -4 r = 4 DrawDisk(x,0,r,FillColor=MAGENTA,EdgeWidth=0)
38 Draw the Second Disk x = x + 1.5*r r = r/2 DrawDisk(x,0,r,FillColor=CYAN,EdgeWidth=0)

39 Draw the Third Disk x = x + 1.5*r r = r/2 DrawDisk(x,0,r,FillColor=MAGENTA,EdgeWidth=0 )
40 Overall x = -4; r = 4 DrawDisk(x,0,r,FillColor=MAGENTA,EdgeWidth=0) x = x + 1.5*r; r = r/2 DrawDisk(x,0,r,FillColor=CYAN,EdgeWidth=0) x = x + 1.5*r; r = r/2 DrawDisk(x,0,r,FillColor=MAGENTA,EdgeWidth=0) x = x + 1.5*r; r = r/2 DrawDisk(x,0,r,FillColor=CYAN,EdgeWidth=0) Notice the repetition of the x and r updates. Simpler than figuring the centers and radii by hand. Also gets us ready for loops.
41 Let s Draw a Star with DrawStar You must tell DrawStar - the center of the star. - the radius of the star You have the option of telling DrawStar - the fill color - the width of the perimeter highlight - the color of the perimeter highlight - the rotation angle
42 DrawStar from SimpleGraphics import* MakeWindow(5,bgcolor=YELLOW) x=0; y=0; r=4 DrawStar(x,y,r) ShowWindow() The default is a star with no fill color. So all you get is the perimeter. Note: the radius of a star is the distance from its center to any tip.
43 DrawStar from SimpleGraphics import* MakeWindow(5,bgcolor=YELLOW) x=0; y=0; r=4 DrawStar(x,y,r,FillColor=MAGENTA) ShowWindow() Use the optional color argument to specify a fill color.

44 DrawStar from SimpleGraphics import* MakeWindow(5,bgcolor=YELLOW) x=0; y=0; r=4 DrawStar(x,y,r,FillColor=MAGENTA,EdgeWidth=6) ShowWindow() Use the optional EdgeWidth argument to specify the boldness of the perimeter highlight. The default is EdgeWidth = 1 If you don t want any perimeter highlight, then set EdgeWidth=0

45 DrawStar from SimpleGraphics import* MakeWindow(5,bgcolor=YELLOW) x=0; y=0; r=4 DrawStar(x,y,r,FillColor=MAGENTA,theta=18) ShowWindow() Use the optional theta argument to specify the counterclockwise rotation of the rectangle about its center. (Angle in degrees.) The default rotation angle is zero.
46 Let s Draw a Line Segment with DrawLineSeg You must tell DrawLineSeg - the first endpoint of the segment - the second endpoint of the segment You have the option of telling DrawLineSeg - the color of the segment - the line width of the segment
47 DrawLineSeg from SimpleGraphics import* MakeWindow(5,bgcolor=YELLOW) a = -3; b = -2; c = 4; d = 2 DrawLineSeg(a,b,c,d,LineWidth=4, LineColor='MAGENTA') ShowWindow() The default line color is BLACK. The default line width is 1.
48 Let s Draw Text with DrawText You must tell DrawText - the location of the text. - the text (a string) that is to be displayed You have the option of telling DrawText - the color of the text - the size of the font
 DrawDisk(0,0,.03,FillColor=BLACK) ShowWindow() The default text color is BLACK. The default font size is 10.")
49 DrawText from SimpleGraphics import* MakeWindow(3,bgcolor=YELLOW) x=0; y=0; s = 'This is the origin.' DrawText(x,y,s,FontSize=24,FontColor='MAGENTA') DrawDisk(0,0,.03,FillColor=BLACK) ShowWindow() The default text color is BLACK. The default font size is 10. The lower left corner of the first character is roughly at (x,y).
50 Let s Talk About Color
51 The rgb Representation A color is a triple of numbers, each between zero and one. The numbers represent the amount of red, green, and blue. This is purple: [ 0.57, 0.17, 0.93]
52 The Module SimpleGraphics Has 8 Procedures and Data SimpleGraphics.py Data In this case the data encodes the rgb values of thirteen colors
53 The SimpleGraphics Colors YELLOW = [1.00,1.00,0.00] CYAN = [0.00,1.00,1.00] MAGENTA = [1.00,0.00,1.00] RED = [1.00,0.00,0.00] GREEN = [0.00,1.00,0.00] BLUE = [0.00,0.00,1.00] WHITE = [1.00,1.00,1.00] BLACK = [0.00,0.00,0.00] PURPLE = [0.57,0.17,0.93] DARKGRAY = [0.33,0.33,0.33] LIGHTGRAY = [0.67,0.67,0.67] ORANGE = [1.00,0.50,0.00] PINK = [1.00,0.71,0.80] These are called Global Variables Convention: Global Variable Names should be UPPER CASE.
54 Access from SimpleGraphics import* MakeWindow(5,bgcolor=YELLOW) x=0; y=0; L=5; W=3 DrawRect(x,y,L,W,FillColor=MAGENTA) ShowWindow() When a module is imported, it gives access to both its functions and its global variables. Take a look at the Demos ShowRect.py, ShowDisk.py, and ShowStar.py
55 rgb Lists Things like [0.74,1.00,0.34] are called rgb lists. Rules: Square brackets, 3 numbers separated by commas, each number between 0 and 1. First number = red value Second number = green value Third number = blue value The bigger numbers mean more of that color.
56 Using rgb Lists Instead of using the predefined colors you can make up and use your own fill color, e.g. c = [0.74,1.00,0.34] DrawDisk(0,0,1,FillColor=c) Google rgb values to look at huge tables of colors and rgb values.
![Title from SimpleGraphics import* r=0.8,g=0.4, b=0.8 MakeWindow(5,bgcolor=[r,g,b]) s = r=%4.2f g=%4.](/docs-images/86/93164400/images/57-0.jpg "2f b = %4.")
57 Title from SimpleGraphics import* r=0.8,g=0.4, b=0.8 MakeWindow(5,bgcolor=[r,g,b]) s = r=%4.2f g=%4.2f b = %4.2f % (r,g,b) Title(s,FontSize=20) ShowWindow() You can put a title at the top of the figure window.
58 A Note on Managing Figures MakeWindow(etc) MakeWindow(etc) Three figure windows will be produced. The green code defines what is in the first window. MakeWindow(etc) ShowWindow() The pink and blue code set up the second and third windows. The ShowWindow says. Show all the windows. Take a look at the Demos ShowDrawRect.py, ShowDrawStar.py, etc.
59 A Final Example Shows two things. 1. You can write a module that uses other modules that YOU have written. 2. You can have a module that has both function definitions and a script that can be executed.
60 A Final Example We write a procedure to draw this and a script that calls it twice: We put them both in the SAME module.
61 Tile.py A Final Example from simplegraphics import * def DrawTile(x,y,r,c1,c2,c3): DrawRect(x,y,2*r,2*r,FillColor=c1) DrawDisk(x,y,r,FillColor=c2) DrawStar(x,y,r,FillColor=c3) if name == ' main ': MakeWindow(6,bgcolor=BLACK,labels=False) DrawTile(3,0,2,MAGENTA,PURPLE,YELLOW) DrawTile(-3,0,2,MAGENTA,PURPLE,YELLOW) ShowWindow() See the Demo Tile.py In command mode, enter python Tile.py
62 Tile.py A Final Example from SimpleGraphics import * def DrawTile(x,y,r,c1,c2,c3): DrawRect(x,y,2*r,2*r,FillColor=c1) DrawDisk(x,y,r,FillColor=c2) DrawStar(x,y,r,FillColor=c3) if name == ' main ': This is called an Application Script MakeWindow(6,bgcolor=BLACK,labels=False) DrawTile(3,0,2,MAGENTA,PURPLE,YELLOW) DrawTile(-3,0,2,MAGENTA,PURPLE,YELLOW) ShowWindow() See the demo Tile.py In command mode, enter python Tile.py
63 So a Module Can Look Like This Data Function Definitions if name == ' main ': Gotta have Application Script Those are double underscores in the if statement.
64 Summary 1. Procedures look like functions without the return. They do stuff but do not return values 2. Graphics procedures were used to illustrate the idea. 3. Color can be encoded with three numbers that indicate the amount of red, green, and blue. 4. A single module can house data, functions, and a script at the same time
CS 1110 SPRING 2016: LAB 3: PRACTICE FOR A2 (Feb 23-24)
") CS 1110 SPRING 2016: LAB 3: PRACTICE FOR A2 (Feb 23-24) http://www.cs.cornell.edu/courses/cs1110/2016sp/labs/lab03/lab03.pdf First Name: Last Name: NetID: The lab assignments are very important. Remember
CS 1110 SPRING 2016: LAB 3: PRACTICE FOR A2 (Feb 23-24) http://www.cs.cornell.edu/courses/cs1110/2016sp/labs/lab03/lab03.pdf First Name: Last Name: NetID: The lab assignments are very important. Remember
Assignment 2: Due Friday Feb 13 at 6pm
 CS1110 Spring 2015 Assignment 2: Due Friday Feb 13 at 6pm You must work either on your own or with one partner. If you work with a partner, you and your partner must first register as a group in CMS and
Assignment 4: Due Friday Mar 11 at 6pm
 CS1110 Spring 2016 Assignment 4: Due Friday Mar 11 at 6pm You must work either on your own or with one partner. If you work with a partner, you and your partner must first register as a group in CMS (this
What is Recursion? 21. Recursion. The Concept of Recursion Is Hard But VERY Important. Recursive Graphics. Tiling a Triangle.
 . Recursion Recursive Tiling Recursive Evaluation of n! Tracking a Recursive Function Call Random Mondrian What is Recursion? A function is recursive if it calls itself. A pattern is recursive if it is
+. n is the function parameter and the function returns the sum.
 CS/INFO 1305 Programming Exercise 2 Due Wednesday, July 22, at 10pm Submit either Level 1 or Level 2. For Level 2, problem 2.3 is required; complete ONE of 2.1 and 2.2. 1 Level 1 1. During the previous
CS Problem Solving and Object-Oriented Programming
 CS 101 - Problem Solving and Object-Oriented Programming Lab 5 - Draw a Penguin Due: October 28/29 Pre-lab Preparation Before coming to lab, you are expected to have: Read Bruce chapters 1-3 Introduction
CS 1110 Prelim 1 March 10, 2015
 CS 1110 Prelim 1 March 10, 2015 (Print Last Name) (Print First Name) (Net ID) Circle Your Lab: ACCEL: Tue 12:20 Tue 1:25 Tue 2:30 Tue 3:35 ACCEL : Wed 10:10 Wed 11:15 Wed 12:20 Wed 1:25 Wed 2:30 Wed 3:35
Creating Special Effects with Text
 Creating Special Effects with Text Introduction With FrameMaker publishing software, you can create special effects such as large, rotated, outlined, or color characters by putting PostScript code in a
CISC 1600 Lecture 3.1 Introduction to Processing
 CISC 1600 Lecture 3.1 Introduction to Processing Topics: Example sketches Drawing functions in Processing Colors in Processing General Processing syntax Processing is for sketching Designed to allow artists
CMPSCI 119 LAB #2 Anime Eyes Professor William T. Verts
 CMPSCI 119 LAB #2 Anime Eyes Professor William T. Verts The goal of this Python programming assignment is to write your own code inside a provided program framework, with some new graphical and mathematical
Introduction to VPython for E&M This tutorial will guide you through the basics of programming in VPython
 Introduction to VPython for E&M This tutorial will guide you through the basics of programming in VPython VPython is a programming language that allows you to easily make 3-D graphics and animations. We
Magazine Layout Design. and Adobe InDesign basics
 Magazine Layout Design and Adobe InDesign basics Click on Document on the right side of the pink and black box in the center of your screen. To create a document If this box does not pop open, go to the
Generating Vectors Overview
 Generating Vectors Overview Vectors are mathematically defined shapes consisting of a series of points (nodes), which are connected by lines, arcs or curves (spans) to form the overall shape. Vectors can
Geometry. Name. Use AngLegs to model each set of shapes. Complete each statement with the phrase "is" or "is not." Triangle 1 congruent to Triangle 2.
 Lesson 1 Geometry Name Use AngLegs to model each set of shapes. Complete each statement with the phrase "is" or "is not." 1. 2. 1 2 1 2 3 4 3 4 Triangle 1 congruent to Triangle 2. Triangle 2 congruent
Building Java Programs
 Building Java Programs Graphics reading: Supplement 3G videos: Ch. 3G #1-2 Objects (briefly) object: An entity that contains data and behavior. data: variables inside the object behavior: methods inside
CMPSCI 119 LAB #2 Greebles / Anime Eyes Professor William T. Verts
 CMPSCI 119 LAB #2 Greebles / Anime Eyes Professor William T. Verts The goal of this Python programming assignment is to write your own code inside a provided program framework, with some new graphical
12/22/11. } Rolling a Six-Sided Die. } Fig 6.7: Rolling a Six-Sided Die 6,000,000 Times
 } Rolling a Six-Sided Die face = 1 + randomnumbers.nextint( 6 ); The argument 6 called the scaling factor represents the number of unique values that nextint should produce (0 5) This is called scaling
An Introduction to Processing
 An Introduction to Processing Creating static drawings Produced by: Mairead Meagher Dr. Siobhán Drohan Department of Computing and Mathematics http://www.wit.ie/ Topics list Coordinate System in Computing.
Drawing a Circle. 78 Chapter 5. geometry.pyde. def setup(): size(600,600) def draw(): ellipse(200,100,20,20) Listing 5-1: Drawing a circle
: size(600,600) def draw(): ellipse(200,100,20,20) Listing 5-1: Drawing a circle") 5 Transforming Shapes with Geometry In the teahouse one day Nasrudin announced he was selling his house. When the other patrons asked him to describe it, he brought out a brick. It s just a collection
5 Transforming Shapes with Geometry In the teahouse one day Nasrudin announced he was selling his house. When the other patrons asked him to describe it, he brought out a brick. It s just a collection
Animations that make decisions
 Chapter 17 Animations that make decisions 17.1 String decisions Worked Exercise 17.1.1 Develop an animation of a simple traffic light. It should initially show a green disk; after 5 seconds, it should
CS 1110 Prelim 2 April 21, 2015
 CS 1110 Prelim 2 April 21, 2015 (Print Last Name) (Print First Name) (Net ID) Circle Your Lab: ACCEL: Tue 12:20 Tue 1:25 Tue 2:30 Tue 3:35 ACCEL : Wed 10:10 Wed 11:15 Wed 12:20 Wed 1:25 Wed 2:30 Wed 3:35
QUICK INTRODUCTION TO MATLAB PART I
 QUICK INTRODUCTION TO MATLAB PART I Department of Mathematics University of Colorado at Colorado Springs General Remarks This worksheet is designed for use with MATLAB version 6.5 or later. Once you have
Topic 8 Graphics. Margaret Hamilton
 Topic 8 Graphics When the computer crashed during the execution of your program, there was no hiding. Lights would be flashing, bells would be ringing and everyone would come running to find out whose
Using Graphics. Building Java Programs Supplement 3G
 Using Graphics Building Java Programs Supplement 3G Introduction So far, you have learned how to: output to the console break classes/programs into static methods store and use data with variables write
Polygons and Angles: Student Guide
 Polygons and Angles: Student Guide You are going to be using a Sphero to figure out what angle you need the Sphero to move at so that it can draw shapes with straight lines (also called polygons). The
0 Graphical Analysis Use of Excel
 Lab 0 Graphical Analysis Use of Excel What You Need To Know: This lab is to familiarize you with the graphing ability of excels. You will be plotting data set, curve fitting and using error bars on the
Introduction to Google SketchUp
 Introduction to Google SketchUp When initially opening SketchUp, it will be useful to select the Google Earth Modelling Meters option from the initial menu. If this menu doesn t appear, the same option
Topic 8 graphics. -mgrimes, Graphics problem report 134
 Topic 8 graphics "What makes the situation worse is that the highest level CS course I've ever taken is cs4, and quotes from the graphics group startup readme like 'these paths are abstracted as being
Java Programming Lecture 6
 Java Programming Lecture 6 Alice E. Fischer Feb 15, 2013 Java Programming - L6... 1/32 Dialog Boxes Class Derivation The First Swing Programs: Snow and Moving The Second Swing Program: Smile Swing Components
Graphics and Java 2D Introduction OBJECTIVES. One picture is worth ten thousand words.
 1 2 12 Graphics and Java 2D One picture is worth ten thousand words. Chinese proverb Treat nature in terms of the cylinder, the sphere, the cone, all in perspective. Paul Cézanne Colors, like features,
Name: Dr. Fritz Wilhelm Lab 1, Presentation of lab reports Page # 1 of 7 5/17/2012 Physics 120 Section: ####
 Name: Dr. Fritz Wilhelm Lab 1, Presentation of lab reports Page # 1 of 7 Lab partners: Lab#1 Presentation of lab reports The first thing we do is to create page headers. In Word 2007 do the following:
Introduction to VPython This tutorial will guide you through the basics of programming in VPython.
 Introduction to VPython This tutorial will guide you through the basics of programming in VPython. VPython is a programming language that allows you to easily make 3-D graphics and animations. We will
CSC 101: Lab Manual#11 Programming Turtle Graphics in Python Lab due date: 5:00pm, day after lab session
 CSC 101: Lab Manual#11 Programming Turtle Graphics in Python Lab due date: 5:00pm, day after lab session Purpose: The purpose of this lab is to get a little introduction to the process of computer programming
CHAOS Chaos Chaos Iterate
 CHAOS Chaos is a program that explores data analysis. A sequence of points is created which can be analyzed via one of the following five modes: 1. Time Series Mode, which plots a time series graph, that
Introduction to Recursion
 Recursive Patterns Introduction to Recursion CS Computer Programming Department of Computer Science Wellesley College Reminder: DCG What is Recursion? 8- Recursion is an instance of divide-conquer-glue
1 Introduction to Matlab
 1 Introduction to Matlab 1. What is Matlab? Matlab is a computer program designed to do mathematics. You might think of it as a super-calculator. That is, once Matlab has been started, you can enter computations,
Introduction to VPython This tutorial will guide you through the basics of programming in VPython.
 1 Introduction to VPython This tutorial will guide you through the basics of programming in VPython. VPython is a programming language that allows you to easily make 3-D graphics and animations. We will
Grade 6 Math Circles. Shapeshifting
 Faculty of Mathematics Waterloo, Ontario N2L 3G1 Plotting Grade 6 Math Circles October 24/25, 2017 Shapeshifting Before we begin today, we are going to quickly go over how to plot points. Centre for Education
Draw beautiful and intricate patterns with Python Turtle, while learning how to code with Python.
 Raspberry Pi Learning Resources Turtle Snowflakes Draw beautiful and intricate patterns with Python Turtle, while learning how to code with Python. How to draw with Python Turtle 1. To begin, you will
CS 100: Programming Assignment P1
 CS 100: Programming Assignment P1 Due: Thursday, February 4. (Either in lecture or in Carpenter by 4pm.) You may work in pairs. Uphold academic integrity. Follow the course rules for the submission of
Garfield AP CS. Graphics
 Garfield AP CS Graphics Assignment 3 Working in pairs Conditions: I set pairs, you have to show me a design before you code You have until tomorrow morning to tell me if you want to work alone Cumulative
1. (10 pts) Order the following three images by how much memory they occupy:
 Order the following three images by how much memory they occupy:") CS 47 Prelim Tuesday, February 25, 2003 Problem : Raster images (5 pts). (0 pts) Order the following three images by how much memory they occupy: A. a 2048 by 2048 binary image B. a 024 by 024 grayscale
CS 47 Prelim Tuesday, February 25, 2003 Problem : Raster images (5 pts). (0 pts) Order the following three images by how much memory they occupy: A. a 2048 by 2048 binary image B. a 024 by 024 grayscale
Matlab Tutorial 1: Working with variables, arrays, and plotting
 Matlab Tutorial 1: Working with variables, arrays, and plotting Setting up Matlab First of all, let's make sure we all have the same layout of the different windows in Matlab. Go to Home Layout Default.
ENGL 323: Writing for New Media Repurposing Content for the Web Part Two
 ENGL 323: Writing for New Media Repurposing Content for the Web Part Two Dr. Michael Little michaellittle@kings.edu Hafey-Marian 418 x5917 Using Color to Establish Visual Hierarchies Color is useful in
Lesson 1. Unit 2 Practice Problems. Problem 2. Problem 1. Solution 1, 4, 5. Solution. Problem 3
 Unit 2 Practice Problems Lesson 1 Problem 1 Rectangle measures 12 cm by 3 cm. Rectangle is a scaled copy of Rectangle. Select all of the measurement pairs that could be the dimensions of Rectangle. 1.
What can we do with Processing? Let s check. Natural Language and Dialogue Systems Lab Guest Image. Remember how colors work.
 MIDTERM REVIEW: THURSDAY I KNOW WHAT I WANT TO REVIEW. BUT ALSO I WOULD LIKE YOU TO TELL ME WHAT YOU MOST NEED TO GO OVER FOR MIDTERM. BY EMAIL AFTER TODAY S CLASS. What can we do with Processing? Let
L E S S O N 2 Background
 Flight, Naperville Central High School, Naperville, Ill. No hard hat needed in the InDesign work area Once you learn the concepts of good page design, and you learn how to use InDesign, you are limited
Building Java Programs
 Building Java Programs Supplement 3G: Graphics 1 drawing 2D graphics Chapter outline DrawingPanel and Graphics objects drawing and filling shapes coordinate system colors drawing with loops drawing with
Parametric Curves, Polar Plots and 2D Graphics
 Parametric Curves, Polar Plots and 2D Graphics Fall 2016 In[213]:= Clear "Global`*" 2 2450notes2_fall2016.nb Parametric Equations In chapter 9, we introduced parametric equations so that we could easily
Building Java Programs
 Building Java Programs Graphics reading: Supplement 3G videos: Ch. 3G #1-2 Objects (briefly) object: An entity that contains data and behavior. data: Variables inside the object. behavior: Methods inside
GEOMETRY. STATE FINALS MATHEMATICS CONTEST May 1, Consider 3 squares A, B, and C where the perimeter of square A is 2 the
 GEOMETRY STATE FINALS MATHEMATICS CONTEST May, 008. Consider squares A, B, and C where the perimeter of square A is the perimeter of square B, and the perimeter of square B is the perimeter of square C.
: Intro Programming for Scientists and Engineers Assignment 1: Turtle Graphics
 Assignment 1: Turtle Graphics Page 1 600.112: Intro Programming for Scientists and Engineers Assignment 1: Turtle Graphics Peter H. Fröhlich phf@cs.jhu.edu Joanne Selinski joanne@cs.jhu.edu Due Date: Wednesdays
Dice in Google SketchUp
 A die (the singular of dice) looks so simple. But if you want the holes placed exactly and consistently, you need to create some extra geometry to use as guides. Plus, using components for the holes is
Drawing shapes and lines
 Fine F Fi i Handmade H d d Ch Chocolates l Hours Mon Sat 10am 6pm In this demonstration of Adobe Illustrator CS6, you will be introduced to new and exciting application features, like gradients on a stroke
2D Geometry Part 2: Area
 Slide 1 / 81 Slide 2 / 81 2D Geometry Part 2: Area Rectangles Parallelograms Triangles Trapezoids Circles Mixed Review Irregular Shapes Shaded Regions Click on a topic to go to that section Slide 3 / 81
Customisation and production of Badges. Getting started with I-Color System Basic Light
 Customisation and production of Badges Getting started with I-Color System Basic Light Table of contents 1 Creating a Badge Model 1.1 Configuration of Badge Format 1.2 Designing your Badge Model 1.2.1
Beaumont Middle School Design Project April May 2014 Carl Lee and Craig Schroeder
 Beaumont Middle School Design Project April May 2014 Carl Lee and Craig Schroeder 1 2 SketchUp 1. SketchUp is free, and you can download it from the website www.sketchup.com. For some K12 use, see www.sketchup.com/3dfor/k12-education.
2D Geometry Part 2: Area
 Slide 1 / 81 2D Geometry Part 2: Area Table of Contents Slide 2 / 81 Rectangles Parallelograms Triangles Trapezoids Circles Mixed Review Irregular Shapes Shaded Regions Click on a topic to go to that section
Design and Analysis of Algorithms Prof. Madhavan Mukund Chennai Mathematical Institute. Module 02 Lecture - 45 Memoization
 Design and Analysis of Algorithms Prof. Madhavan Mukund Chennai Mathematical Institute Module 02 Lecture - 45 Memoization Let us continue our discussion of inductive definitions. (Refer Slide Time: 00:05)
Section 1.1 The Distance and Midpoint Formulas
 Section 1.1 The Distance and Midpoint Formulas 1 y axis origin x axis 2 Plot the points: ( 3, 5), (0,7), ( 6,0), (6,4) 3 Distance Formula y x 4 Finding the Distance Between Two Points Find the distance
SketchUp Starting Up The first thing you must do is select a template.
 SketchUp Starting Up The first thing you must do is select a template. While there are many different ones to choose from the only real difference in them is that some have a coloured floor and a horizon
3. Area and perimeter.notebook November 13, All rectangles with area 12cm 2 have the same perimeter. True or false?
 All rectangles with area 12cm 2 have the same perimeter. True or false? Find the perimeter of the shape: Draw another shape with area a smaller perimeter. but with x y Write an expression for the perimeter
CISC 1600, Lab 2.1: Processing
 CISC 1600, Lab 2.1: Processing Prof Michael Mandel 1 Getting set up For this lab, we will be using Sketchpad, a site for building processing sketches online using processing.js. 1.1. Go to http://cisc1600.sketchpad.cc
1 Getting started with Processing
 cis3.5, spring 2009, lab II.1 / prof sklar. 1 Getting started with Processing Processing is a sketch programming tool designed for use by non-technical people (e.g., artists, designers, musicians). For
Smarties Estimate and Count
 Smarties Estimate and Count ACTIVITY 1 STEP 1: DO NOT OPEN THE SMARTIES This activity will teach you how to use spreadsheets. You will use a box of Smarties to compile data to complete the spreadsheet.
Someone else might choose to describe the closet by determining how many square tiles it would take to cover the floor. 6 ft.
 Areas Rectangles One way to describe the size of a room is by naming its dimensions. So a room that measures 12 ft. by 10 ft. could be described by saying its a 12 by 10 foot room. In fact, that is how
2. If a window pops up that asks if you want to customize your color settings, click No.
 Practice Activity: Adobe Photoshop 7.0 ATTENTION! Before doing this practice activity you must have all of the following materials saved to your USB: runningshoe.gif basketballshoe.gif soccershoe.gif baseballshoe.gif
The Fundamentals. Document Basics
 3 The Fundamentals Opening a Program... 3 Similarities in All Programs... 3 It's On Now What?...4 Making things easier to see.. 4 Adjusting Text Size.....4 My Computer. 4 Control Panel... 5 Accessibility
Lab1: Use of Word and Excel
 Dr. Fritz Wilhelm; physics 230 Lab1: Use of Word and Excel Page 1 of 9 Lab partners: Download this page onto your computer. Also download the template file which you can use whenever you start your lab
Using Google SketchUp
 Using Google SketchUp Mike Bailey mjb@cs.oregonstate.edu http://cs.oregonstate.edu/~mjb/sketchup What is Google SketchUp? Google SketchUp is a program which lets you sketch in 3D. It is excellent for creating
ABB PowerPoint template User s Guide
 Corporate Communications February 2006 ABB PowerPoint template User s Guide ABB Group -1- ABB PowerPoint template User s Guide Table of Contents pg 3 The ABB PowerPoint template pg 7 Minimizing overall
Lecture 5 2D Transformation
 Lecture 5 2D Transformation What is a transformation? In computer graphics an object can be transformed according to position, orientation and size. Exactly what it says - an operation that transforms
public static void main(string[] args) { GTest mywindow = new GTest(); // Title This program creates the following window and makes it visible:
![public static void main(string[] args) { GTest mywindow = new GTest(); // Title This program creates the following window and makes it visible:](/thumbs/92/108585543.jpg "public static void main(string[] args) { GTest mywindow = new GTest(); // Title This program creates the following window and makes it visible:") Basics of Drawing Lines, Shapes, Reading Images To draw some simple graphics, we first need to create a window. The easiest way to do this in the current version of Java is to create a JFrame object which
Basics of Drawing Lines, Shapes, Reading Images To draw some simple graphics, we first need to create a window. The easiest way to do this in the current version of Java is to create a JFrame object which
Area rectangles & parallelograms
 Area rectangles & parallelograms Rectangles One way to describe the size of a room is by naming its dimensions. So a room that measures 12 ft. by 10 ft. could be described by saying its a 12 by 10 foot
Adobe Flash CS3 Reference Flash CS3 Application Window
 Adobe Flash CS3 Reference Flash CS3 Application Window When you load up Flash CS3 and choose to create a new Flash document, the application window should look something like the screenshot below. Layers
DeskCNC setup and operation manual
 DeskCNC setup and operation manual This document explains how to install, setup and cut foam shapes using DeskCNC 4 axis foam cutting software. The document will go through a step by step process of how
Additional Plot Types and Plot Formatting
 Additional Plot Types and Plot Formatting The xy plot is the most commonly used plot type in MAT- LAB Engineers frequently plot either a measured or calculated dependent variable, say y, versus an independent
13B. Loops and Lists. It Will Have Three Functions. Computing the Diameter of a Cloud of Points. MakeCloud Returns Two Lists. The Function MakeCloud
 13B. Loops and Lists Computing the Diameter of a Cloud of Points Topics: Functions that return more than 1 thing Nested Loops Map 500 Points. Which two are furthest apart and what is their separation?
Math 6, Unit 8 Notes: Geometric Relationships
 Math 6, Unit 8 Notes: Geometric Relationships Points, Lines and Planes; Line Segments and Rays As we begin any new topic, we have to familiarize ourselves with the language and notation to be successful.
CO2 Rail Car. Wheel Rear Px. on the Command Manager toolbar.
 Chapter 6 CO2 Rail Car Wheel Rear Px A. Sketch Construction Lines. Step 1. Click File Menu > New, click Part Metric and OK. Step 2. Click Front (plane) in the Feature Manager (left panel), Fig. 1. Step
[ the academy_of_code] Senior Beginners
![[ the academy_of_code] Senior Beginners](/thumbs/73/69558996.jpg "[ the academy_of_code] Senior Beginners") [ the academy_of_code] Senior Beginners 1 Drawing Circles First step open Processing Open Processing by clicking on the Processing icon (that s the white P on the blue background your teacher will tell
[ the academy_of_code] Senior Beginners 1 Drawing Circles First step open Processing Open Processing by clicking on the Processing icon (that s the white P on the blue background your teacher will tell
Visual Aids for the Nursery 1
 Visual Aids for the Nursery 1 Shapes, Colors, & Numbers By Glorianne Muggli Visual Aids for the Nursery 1: Shapes, Colors, & Numbers By Glorianne Muggli General Instructions This book can be implemented
MMAX2 Annotation Schemes (draft)
") MMAX2 Annotation Schemes (draft) c Christoph Müller EML Research ggmbh http://mmax.eml-research.de 9th February 2005 Contents 1 About this Document 1 2 Attributes and Relations 3 3 Simple Schemes 5 4 Complex
MMAX2 Annotation Schemes (draft) c Christoph Müller EML Research ggmbh http://mmax.eml-research.de 9th February 2005 Contents 1 About this Document 1 2 Attributes and Relations 3 3 Simple Schemes 5 4 Complex
Section 4.1: Introduction to Trigonometry
 Section 4.1: Introduction to Trigonometry Review of Triangles Recall that the sum of all angles in any triangle is 180. Let s look at what this means for a right triangle: A right angle is an angle which
TikZ & PGF(plots) Daniel Knittl-Frank. May This work is licensed under the Creative Commons Attribution-ShareAlike 3.
 Daniel Knittl-Frank. May This work is licensed under the Creative Commons Attribution-ShareAlike 3.") TikZ & PGF(plots) Daniel Knittl-Frank May 2015 This work is licensed under the Creative Commons Attribution-ShareAlike 3.0 Austria license (CC-BY-SA) 2D value plot Bitstamp USD 20,000 Weighted Price High
TikZ & PGF(plots) Daniel Knittl-Frank May 2015 This work is licensed under the Creative Commons Attribution-ShareAlike 3.0 Austria license (CC-BY-SA) 2D value plot Bitstamp USD 20,000 Weighted Price High
S206E Lecture 3, 5/15/2017, Rhino 2D drawing an overview
 Copyright 2017, Chiu-Shui Chan. All Rights Reserved. S206E057 Spring 2017 Rhino 2D drawing is very much the same as it is developed in AutoCAD. There are a lot of similarities in interface and in executing
Assignment 3: Due Thursday Feb 26 at 11pm
 CS1110 Spring 2015 Assignment 3: Due Thursday Feb 26 at 11pm You must work either on your own or with one partner. If you work with a partner, you and your partner must first register as a group in CMS
SketchUp Quick Start For Surveyors
 SketchUp Quick Start For Surveyors Reason why we are doing this SketchUp allows surveyors to draw buildings very quickly. It allows you to locate them in a plan of the area. It allows you to show the relationship
Chapter 6 Formatting Graphic Objects
 Impress Guide Chapter 6 OpenOffice.org Copyright This document is Copyright 2007 by its contributors as listed in the section titled Authors. You can distribute it and/or modify it under the terms of either
A Guide to Autodesk Maya 2015
 A Guide to Autodesk Maya 2015 Written by Mitchell Youngerman Table of Contents Layout of Toolbars...pg 1 Creating Objects...pg 2 Selecting & Deselecting Objects...pg 3 Changing Perspective... pg 4 Transforming
CS 106A, Lecture 11 Graphics
 CS 106A, Lecture 11 Graphics reading: Art & Science of Java, 9.1-9.3 This document is copyright (C) Stanford Computer Science and Marty Stepp, licensed under Creative Commons Attribution 2.5 License. All
Dilations. Dilations. Enlarges or Reduces a figure using a scale factor. Name: Period: Date: Dilations. Scale Factor =
 Name: Period: Date: Dilations Dilations Enlarges or Reduces a figure using a scale factor. Dilations B B B 6 2 2 C 6 C Scale Factor = B C BC has been enlarged by a scale factor of 3. What are the coordinates
2 SELECTING AND ALIGNING
 2 SELECTING AND ALIGNING Lesson overview In this lesson, you ll learn how to do the following: Differentiate between the various selection tools and employ different selection techniques. Recognize Smart
Computer and Programming: Lab 1
 01204111 Computer and Programming: Lab 1 Name ID Section Goals To get familiar with Wing IDE and learn common mistakes with programming in Python To practice using Python interactively through Python Shell
Photocopiable/digital resources may only be copied by the purchasing institution on a single site and for their own use ZigZag Education, 2013
 SketchUp Level of Difficulty Time Approximately 15 20 minutes Photocopiable/digital resources may only be copied by the purchasing institution on a single site and for their own use ZigZag Education, 2013
Scalable Vector Graphics (SVG) vector image World Wide Web Consortium (W3C) defined with XML searched indexed scripted compressed Mozilla Firefox
 vector image World Wide Web Consortium (W3C) defined with XML searched indexed scripted compressed Mozilla Firefox") SVG SVG Scalable Vector Graphics (SVG) is an XML-based vector image format for twodimensional graphics with support for interactivity and animation. The SVG specification is an open standard developed
SVG SVG Scalable Vector Graphics (SVG) is an XML-based vector image format for twodimensional graphics with support for interactivity and animation. The SVG specification is an open standard developed
Using Google SketchUp
 Using Google SketchUp Mike Bailey mjb@cs.oregonstate.edu http://cs.oregonstate.edu/~mjb/sketchup What is Google SketchUp? Google SketchUp is a program which lets you sketch in 3D. It is excellent for creating
Basic and Intermediate Math Vocabulary Spring 2017 Semester
 Digit A symbol for a number (1-9) Whole Number A number without fractions or decimals. Place Value The value of a digit that depends on the position in the number. Even number A natural number that is
Corporate Information & Computing Services. Customising Facility CMIS Cell Styles and Timetable Views Training Course
 Corporate Information & Computing Services. 285-9 Glossop Rd Sheffield S10 2HB Cliff Alcock Email: c.alcock@sheffield.ac.uk Tel: (0114) 2221171 Fax: (0114) 2221188 Customising Facility CMIS Cell Styles
GIMP WEB 2.0 ICONS. GIMP is all about IT (Images and Text) OPEN GIMP
 OPEN GIMP") GIMP WEB 2.0 ICONS or WEB 2.0 ICONS: MEMO Web 2.0 Icons: Memo GIMP is all about IT (Images and Text) OPEN GIMP Step 1: To begin a new GIMP project, from the Menu Bar, select File New. At the Create a New
GIMP WEB 2.0 ICONS or WEB 2.0 ICONS: MEMO Web 2.0 Icons: Memo GIMP is all about IT (Images and Text) OPEN GIMP Step 1: To begin a new GIMP project, from the Menu Bar, select File New. At the Create a New