Statistical Techniques for Validation Sampling. Copyright GCI, Inc. 2016
|
|
|
- Augusta Morgan
- 5 years ago
- Views:
Transcription

1 Statistical Techniques for Validation Sampling
2 Tie Risk to Sampling Data Type Confidence Level Reliability and Risk Typical Performance Levels One-sided or two-sided spec Distribution (variables)
3 Risk in Sampling Data Type Confidence Level Risk Defective Rate Reliability Variables 95% Attribute 90% or 95% FDA Mandated 0.% 99.90% High 0.30% 99.70% Low 5% 95% High 1% 99% Low 3% 97% Source: Taylor, W. A., Guide to Acceptance Sampling, Taylor Enterprises, 1992

4 Attribute Single & Double Sampling Plans
5 LTPD.05 = 3% Attribute Plans with 95% Confidence Type Parameters AQL LTPD 0.05 Single n=0, a=0 0.05% 3% Double n1=1, a1=0, r1=2, n2=120, a2=2 0.2% 3% Single n=2, a=2 0.39% 3%
6 Variables Sampling Plans LSL USL
7 P pk P pk is a measure of how close the process is to the nearest spec relative to the variation Variables sampling plans for 1-sided spec limits are based on P pk P pk = Distance from mean to nearest spec 3 s
8 P p Variables sampling plans for 2-sided spec limits are based on Ppk and Pp s is standard deviation (total) Compares width of process (6 s) to width of spec (USL - LSL) P p is similar to C p but uses total rather than within subgroup standard deviation P p = USL - 6 s LSL
9 2-Sided Variables Sampling Plans LTPD 0.05 = 1% 95% confidence Parameters AQL LTPD 0.05 n=15, P pk =1.17, P p = % (P pk =1.55) 1% (P pk =0.7) n=20, P pk =1.11, P p = % (P pk =1.2) 1% (P pk =0.7) n=30, P pk =1.03, P p = % (P pk =1.27) 1% (P pk =0.7) n=0, P pk =0.99, P p = % (P pk =1.19) 1% (P pk =0.7)


10 Interactive Exercise: Process validation, 3 lots, 95% confidence level, 99.7% reliability based on high risk, continuous data, 1-sided spec: tensile force 2.5 lb/in 2
11 Choose a Sampling Plan 1-sided LTPD 0.05 = 0.3% 95% confidence Given: Ppk = 1. (historic data) Parameters AQL LTPD 0.05 n=15, P pk =1.7 = % (P pk =1.0) 0.3% (P pk =0.92) n=20, P pk = % (P pk =1.69) 0.3% (P pk =0.92) n=30, P pk = % (P pk =1.7) 0.3% (P pk =0.92) n=0, P pk = % (P pk =1.3) 0.3% (P pk =0.92) n=15 has a 50% probability of acceptance n=30 has a 95% probability of acceptance
12 Collect the Data Collect data on 30 samples per lot Repeat for all 3 lots
13 Analyze the Data Normality Test Stability Fail (p<.05) Pass (p.05) *Transformation Capability Analysis

14 Lot 1: Normality Test
15 Sample Range Sample Mean Lot 1: Stability Xbar-R Chart of Lot _ UC L=11.56 X=. LC L= Sample UC L=3.70 _ R=1. LC L= Sample 7 9
16 Lot 1: Capability Analysis Process Capability of Lot1 Process Data LSL 2.5 Target * USL * Sample Mean.0952 Sample N 30 StDev (Within) StDev (O v erall) LSL Within Overall Potential (Within) C apability C p * C PL 2.99 C PU * C pk 2.99 O v erall C apability Pp * PPL 2.6 PPU * Ppk 2.6 C pm * O bserv ed Performance PPM < LSL 0.00 PPM > USL * PPM Total 0.00 Exp. Within Performance PPM < LSL 0.00 PPM > USL * PPM Total 0.00 Exp. O v erall Performance PPM < LSL 0.00 PPM > USL * PPM Total 0.00
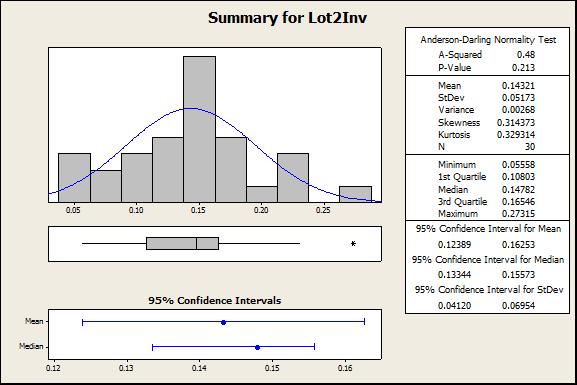
17 Lot 2: Normality Test Summary for Lot2 A nderson-darling Normality Test A -Squared 2.30 P-V alue < Mean.15 StDev V ariance 1.01 Skew ness Kurtosis N Minimum st Q uartile Median rd Q uartile 9.27 Maximum % C onfidence Interv al for Mean % C onfidence Interv al for Median % Confidence Intervals 95% C onfidence Interv al for StDev Mean Median 6 7 9
18 Sample Range Sample Mean Lot 2: Stability Xbar-R Chart of Lot2 16 UC L= _ X= Sample 7 9 LC L= UC L= _ R= LC L= Sample 7 9
19 StDev Lot 2: Data Transformation Box-Cox Plot of Lot Lower CL Upper CL Lambda (using 95.0% confidence) Estimate -1. Lower CL Upper CL Rounded Value Don t forget to transform the specification! 15 5 Limit Lambda


20 Transformed Normality Test
21 Lot 2: Capability Analysis Process Capability of Lot2 Using Box-Cox Transformation With Lambda = -1 Process Data LSL 2.5 Target * USL * Sample Mean.15 Sample N 30 StDev (Within) StDev (O v erall) A fter Transformation LSL* 0. Target* * USL* * Sample Mean* StDev (Within)* StDev (O v erall)* transformed data LSL* Within O v erall Potential (Within) C apability C p * C PL 1.90 C PU * C pk 1.90 O v erall C apability Pp * PPL 1.6 PPU * Ppk 1.6 C pm * O bserv ed Performance PPM < LSL 0.00 PPM > USL * PPM Total 0.00 Exp. Within Performance PPM > LSL* 0.01 PPM < USL* * PPM Total 0.01 Exp. O v erall Performance PPM > LSL* 0.3 PPM < USL* * PPM Total 0.3
22 Lot 3: Normality Test Summary for Lot3 A nderson-darling Normality Test A -Squared 0.99 P-V alue Mean StDev V ariance Skew ness Kurtosis N Minimum st Q uartile.73 Median rd Q uartile.322 Maximum % C onfidence Interv al for Mean % C onfidence Interv al for Median % Confidence Intervals 95% C onfidence Interv al for StDev Mean Median
23 Sample Range Sample Mean Lot 3: Stability Xbar-R Chart of Lot UC L=12.20 _ X=9.26 LC L= Sample UC L=7.3 _ R=2.7 0 LC L= Sample 7 9
24 Percent Percent Percent Percent Lot 3: Data Transformation Probability Plot for Lot3 2-Parameter Exponential - 95% C I Weibull - 95% C I Goodness of F it Test 2-Parameter Exponential A D = P-V alue < 0.0 Weibull A D = 0.69 P-V alue = Lot3 - T hreshold 3-Parameter Weibull - 95% C I Lot3 Smallest Extreme V alue - 95% C I 3-Parameter Weibull A D = 0.2 P-V alue > Smallest Extreme V alue A D = 0.2 P-V alue > Lot3 - T hreshold Lot3 9 12
25 Lot 3: Capability Analysis Process Capability of Lot3 Calculations Based on Weibull Distribution Model Process Data LSL 2.5 Target * USL * Sample Mean Sample N 30 Shape Scale O bserv ed Performance PPM < LSL 0.00 PPM > USL * PPM Total 0.00 LSL O v erall C apability Pp * PPL 1.31 PPU * Ppk 1.31 Exp. O v erall Performance PPM < LSL PPM > USL * PPM Total
26 Conclusion All three lots met criteria to conclude that the validation passes. With 95% confidence, the process average across each lot produces at least 99% reliability, or With 95% confidence, the process average across each lot produces less than 1% defective. Note: all 3 lots combined are at a 99.99% confidence level.
27 Distribution Analysis Attribute sampling plans Normality established Data transformation (special cases) Distribution-free methods such as VP: Require unimodality Requires sufficient distance between mean and specification limit Can be used with very skewed distributions
28 References EN ISO 135: Medical Devices Quality Management Systems. 21 CFR 20, Quality System Regulation, Subparts C, G & O (design control, production and process controls, statistical techniques). Taylor, W., Guide to Acceptance Sampling, Taylor Enterprises, Inc., D. F. Vysochanskij, Y. I. Petunin (190). "Justification of the 3σ rule for unimodal distributions." Theory of Probability and Mathematical Statistics 21:
Process Capability in the Six Sigma Environment
 GE Research & Development Center Process Capability in the Six Sigma Environment C.L. Stanard 2001CRD119, July 2001 Class 1 Technical Information Series Copyright 2001 General Electric Company. All rights
= = P. IE 434 Homework 2 Process Capability. Kate Gilland 10/2/13. Figure 1: Capability Analysis
 Kate Gilland 10/2/13 IE 434 Homework 2 Process Capability 1. Figure 1: Capability Analysis σ = R = 4.642857 = 1.996069 P d 2 2.326 p = 1.80 C p = 2.17 These results are according to Method 2 in Minitab.
Minitab Training. Leading Innovation. 3 1 s. 6 2 s. Upper Specification Limit. Lower Specification Limit. Mean / Target. High Probability of Failure
 Lower Specification Limit Mean / Target Upper Specification Limit High Probability of Failure Minitab Training 1 3 1 s 3 1 s Much Lower Probability of Failure 1 6 2 s 6 2 s Learning Objectives Understand
Tools For Recognizing And Quantifying Process Drift Statistical Process Control (SPC)
") Tools For Recognizing And Quantifying Process Drift Statistical Process Control (SPC) J. Scott Tarpley GE Intelligent Platforms, Inc. December, 200 Process Analytical Technology (PAT) brings us? Timely
Tools For Recognizing And Quantifying Process Drift Statistical Process Control (SPC) J. Scott Tarpley GE Intelligent Platforms, Inc. December, 200 Process Analytical Technology (PAT) brings us? Timely
What is Process Capability?
 6. Process or Product Monitoring and Control 6.1. Introduction 6.1.6. What is Process Capability? Process capability compares the output of an in-control process to the specification limits by using capability
John A. Conte, P.E. 2/22/2012 1
 John A. Conte, P.E. 2/22/2012 1 Objectives Excited to be here! Students, faculty, engineers Share my engineering career Some thoughts on Six Sigma Some thoughts on Process Capability Cp, Cpk, Pp and Ppk
Denver, Colorado November 16, 2004 D. R. Corpron Senior Manager & Master Black Belt
 Using Process Simulation in Quantitative Management Denver, Colorado November 16, 2004 D. R. Corpron Senior Manager & Master Black Belt 1 Preview What is the problem? Why process simulation? Steps to perform
Risk Assessment of a LM117 Voltage Regulator Circuit Design Using Crystal Ball and Minitab (Part 1) By Andrew G. Bell
 By Andrew G. Bell") Risk Assessment of a LM7 Voltage Regulator Circuit Design Using Crystal Ball and Minitab (Part ) By Andrew G. Bell 3 August, 2006 Table of Contents Executive Summary 2 Introduction. 3 Design Requirements.
Risk Assessment of a LM7 Voltage Regulator Circuit Design Using Crystal Ball and Minitab (Part ) By Andrew G. Bell 3 August, 2006 Table of Contents Executive Summary 2 Introduction. 3 Design Requirements.
Process Capability Analysis in Case Study of Specimens for Rice Polished Cylinder
 International Science Index Vol: 8 No: Part V Process Capability Analysis in Case Study of Specimens for ice Polished Cylinder T. Boonkang, S. Bangphan, P. Bangphan, T. Pothom Abstract Process capability
Mitigating Consumer Risk When Manufacturing Under Verification for Drug Shortages
 Mitigating Consumer Risk When Manufacturing Under Verification for Drug Shortages Presented By Kathy Eley, Principal Consultant and Hector Rivera, Senior Engineer Hyde Engineering + Consulting Presentation
Statistical Consulting at Draper Laboratory
 Statistical Consulting at Draper Laboratory A Project Report Submitted to the Faculty of the WORCESTER POLYTECHNIC INSTITUTE in partial fulfillment of the requirements for the Degree of Master of Science
Towards Process Understanding:
 Towards Process Understanding: sta2s2cal analysis applied to the manufacturing process of tablets Drug Product Development: A QbD Approach Nadia Bou-Chacra Faculty of Pharmaceutical Sciences University
CLEANING OPTIMISATION STUDY - THE CLEANING OF AN OEB5 COMPOUND VESSEL IN THE HIGH CONTAINMENT SUITE AT MSD SWORDS
 CLEANING OPTIMISATION STUDY - THE CLEANING OF AN OEB5 COMPOUND VESSEL IN THE HIGH CONTAINMENT SUITE AT MSD SWORDS Fearghal Downey Technical Director Hyde Engineering and Consulting 31 st August 2017 1.Acknowledgements
Bushing blocks optimization for an external gear pump
 Bushing blocks optimization for an external gear pump MARIA PIA D AMBROSIO D - SixSigmaIn Team snc MARCO MANARA - Casappa SpA Summary Companies profile: SixSigmaIn Team & Casappa Hydraulic pumps - basic
Process Capability Analysis (Cpk) SixSigmaTV.Net
 SixSigmaTV.Net") Process Capability Analysis (Cpk) SixSigmaTV.Net Process Capability Using SigmaXL SigmaXL is an easy to use Excel plug-in for Six Sigma graphical and statistical analysis to help with many phases of your
Process Capability Analysis (Cpk) SixSigmaTV.Net Process Capability Using SigmaXL SigmaXL is an easy to use Excel plug-in for Six Sigma graphical and statistical analysis to help with many phases of your
Minitab detailed
 Minitab 18.1 - detailed ------------------------------------- ADDITIVE contact sales: 06172-5905-30 or minitab@additive-net.de ADDITIVE contact Technik/ Support/ Installation: 06172-5905-20 or support@additive-net.de
Engineering Manual LOCTITE GC 3W T3 & T4 Solder Paste
 Engineering Manual LOCTITE GC 3W T3 & T4 Solder Paste Suitable for use with: Standard SAC Alloys GC 3W The Game Changer Contents 1. Introduction: Basic Properties, Features & Benefits 2. Operating Parameters
Continuous Improvement Toolkit. Normal Distribution. Continuous Improvement Toolkit.
 Continuous Improvement Toolkit Normal Distribution The Continuous Improvement Map Managing Risk FMEA Understanding Performance** Check Sheets Data Collection PDPC RAID Log* Risk Analysis* Benchmarking***
Cpk: What is its Capability? By: Rick Haynes, Master Black Belt Smarter Solutions, Inc.
 C: What is its Capability? By: Rick Haynes, Master Black Belt Smarter Solutions, Inc. C is one of many capability metrics that are available. When capability metrics are used, organizations typically provide
APPROACHES TO THE PROCESS CAPABILITY ANALYSIS IN THE CASE OF NON- NORMALLY DISTRIBUTED PRODUCT QUALITY CHARACTERISTIC
 APPROACHES TO THE PROCESS CAPABILITY ANALYSIS IN THE CASE OF NON- NORMALLY DISTRIBUTED PRODUCT QUALITY CHARACTERISTIC Jiří PLURA, Milan ZEMEK, Pavel KLAPUT VŠB-Technical University of Ostrava, Faculty
Department of Industrial Engineering. Chap. 8: Process Capability Presented by Dr. Eng. Abed Schokry
 Department of Industrial Engineering Chap. 8: Process Capability Presented by Dr. Eng. Abed Schokry Learning Outcomes: After careful study of this chapter, you should be able to do the following: Investigate
Statistical Process Control: Micrometer Readings
 Statistical Process Control: Micrometer Readings Timothy M. Baker Wentworth Institute of Technology College of Engineering and Technology MANF 3000: Manufacturing Engineering Spring Semester 2017 Abstract
Process capability analysis
 6 Process capability analysis In general, process capability indices have been quite controversial. (Ryan, 2000, p. 186) Overview Capability indices are widely used in assessing how well processes perform
Six Sigma Green Belt Part 5
 Six Sigma Green Belt Part 5 Process Capability 2013 IIE and Aft Systems, Inc. 5-1 Process Capability Is the measured, inherent reproducibility of the product turned out by the process. It can be quantified
Constructing Statistical Tolerance Limits for Non-Normal Data. Presented by Dr. Neil W. Polhemus
 Constructing Statistical Tolerance Limits for Non-Normal Data Presented by Dr. Neil W. Polhemus Statistical Tolerance Limits Consider a sample of n observations taken from a continuous population. {X 1,
Getting Started with Minitab 17
 2014, 2016 by Minitab Inc. All rights reserved. Minitab, Quality. Analysis. Results. and the Minitab logo are all registered trademarks of Minitab, Inc., in the United States and other countries. See minitab.com/legal/trademarks
We are IntechOpen, the world s leading publisher of Open Access books Built by scientists, for scientists. International authors and editors
 We are IntechOpen, the world s leading publisher of Open Access books Built by scientists, for scientists 4,000 116,000 120M Open access books available International authors and editors Downloads Our
Getting Started with Minitab 18
 2017 by Minitab Inc. All rights reserved. Minitab, Quality. Analysis. Results. and the Minitab logo are registered trademarks of Minitab, Inc., in the United States and other countries. Additional trademarks
Chapter 6: DESCRIPTIVE STATISTICS
 Chapter 6: DESCRIPTIVE STATISTICS Random Sampling Numerical Summaries Stem-n-Leaf plots Histograms, and Box plots Time Sequence Plots Normal Probability Plots Sections 6-1 to 6-5, and 6-7 Random Sampling
Part One of this article (1) introduced the concept
 introduced the concept") Establishing Acceptance Limits for Uniformity of Dosage Units: Part Two Pramote Cholayudth The concept of sampling distribution of acceptance value (AV) was introduced in Part One of this article series.
Establishing Acceptance Limits for Uniformity of Dosage Units: Part Two Pramote Cholayudth The concept of sampling distribution of acceptance value (AV) was introduced in Part One of this article series.
Quality Improvement Tools
 CHAPTER SIX SUPPLEMENT Quality Improvement Tools McGraw-Hill/Irwin Copyright 2011 by the McGraw-Hill Companies, Inc. All rights reserved. Learning Objectives 1. Apply quality management tools for problem
Statistical Graphics
 Idea: Instant impression Statistical Graphics Bad graphics abound: From newspapers, magazines, Excel defaults, other software. 1 Color helpful: if used effectively. Avoid "chartjunk." Keep level/interests
Copyright. James Wesley Freeman
 Copyright by James Wesley Freeman 2012 The Report Committee for James Wesley Freeman Certifies that this is the approved version of the following report: Using EM Algorithm to Identify Defective Parts
2.3. Quality Assurance: The activities that have to do with making sure that the quality of a product is what it should be.
 5.2. QUALITY CONTROL /QUALITY ASSURANCE 5.2.1. STATISTICS 1. ACKNOWLEDGEMENT This paper has been copied directly from the HMA Manual with a few modifications from the original version. The original version
SigmaXL Feature List Summary, What s New in Versions 6.0, 6.1 & 6.2, Installation Notes, System Requirements and Getting Help
 SigmaXL Feature List Summary, What s New in Versions 6.0, 6.1 & 6.2, Installation Notes, System Requirements and Getting Help Copyright 2004-2013, SigmaXL Inc. SigmaXL Version 6.2 Feature List Summary
Control Charts. An Introduction to Statistical Process Control
 An Introduction to Statistical Process Control Course Content Prerequisites Course Objectives What is SPC? Control Chart Basics Out of Control Conditions SPC vs. SQC Individuals and Moving Range Chart
CREATING THE DISTRIBUTION ANALYSIS
 Chapter 12 Examining Distributions Chapter Table of Contents CREATING THE DISTRIBUTION ANALYSIS...176 BoxPlot...178 Histogram...180 Moments and Quantiles Tables...... 183 ADDING DENSITY ESTIMATES...184
Statistical Process Control: A Case-Study on Haleeb Foods Ltd., Lahore
 11 ISSN 1684 8403 Journal of Statistics Vol: 12, No.1 (2005) Statistical Process Control: A Case-Study on Haleeb Foods Ltd., Lahore Sarwat Zahara Khan *, Muhammad Khalid Pervaiz * and Mueen-ud-Din Azad
For Additional Information...
 For Additional Information... The materials in this handbook were developed by Master Black Belts at General Electric Medical Systems to assist Black Belts and Green Belts in completing Minitab Analyses.
2010 by Minitab, Inc. All rights reserved. Release Minitab, the Minitab logo, Quality Companion by Minitab and Quality Trainer by Minitab are
 2010 by Minitab, Inc. All rights reserved. Release 16.1.0 Minitab, the Minitab logo, Quality Companion by Minitab and Quality Trainer by Minitab are registered trademarks of Minitab, Inc. in the United
Acceptance Sampling by Variables
 Acceptance Sampling by Variables Advantages of Variables Sampling o Smaller sample sizes are required o Measurement data usually provide more information about the manufacturing process o When AQLs are
Chapter 3 - Displaying and Summarizing Quantitative Data
 Chapter 3 - Displaying and Summarizing Quantitative Data 3.1 Graphs for Quantitative Data (LABEL GRAPHS) August 25, 2014 Histogram (p. 44) - Graph that uses bars to represent different frequencies or relative
Name Date Types of Graphs and Creating Graphs Notes
 Name Date Types of Graphs and Creating Graphs Notes Graphs are helpful visual representations of data. Different graphs display data in different ways. Some graphs show individual data, but many do not.
Fusion AE LC Method Validation Module. S-Matrix Corporation 1594 Myrtle Avenue Eureka, CA USA Phone: URL:
 Fusion AE LC Method Validation Module S-Matrix Corporation 1594 Myrtle Avenue Eureka, CA 95501 USA Phone: 707-441-0404 URL: www.smatrix.com Regulatory Statements and Expectations ICH Q2A The objective
a. divided by the. 1) Always round!! a) Even if class width comes out to a, go up one.
 Always round!! a) Even if class width comes out to a, go up one.") Probability and Statistics Chapter 2 Notes I Section 2-1 A Steps to Constructing Frequency Distributions 1 Determine number of (may be given to you) a Should be between and classes 2 Find the Range a The
Probability and Statistics Chapter 2 Notes I Section 2-1 A Steps to Constructing Frequency Distributions 1 Determine number of (may be given to you) a Should be between and classes 2 Find the Range a The
SMT Process Characterization and Financial Impact
 SMT Process Characterization and Financial Impact Fan Li Research In Motion Waterloo ON CA Abstract Portable Electronics devices are having more functionality but the size is getting smaller. What it means
STA Module 4 The Normal Distribution
 STA 2023 Module 4 The Normal Distribution Learning Objectives Upon completing this module, you should be able to 1. Explain what it means for a variable to be normally distributed or approximately normally
STA /25/12. Module 4 The Normal Distribution. Learning Objectives. Let s Look at Some Examples of Normal Curves
 STA 2023 Module 4 The Normal Distribution Learning Objectives Upon completing this module, you should be able to 1. Explain what it means for a variable to be normally distributed or approximately normally
Diploma of Laboratory Technology. Assessment 2 Control charts. Data Analysis. MSL Analyse data and report results.
 Diploma of Laboratory Technology Assessment 2 Control charts Data Analysis MSL925001 Analyse data and report results www.cffet.net PURPOSE 2 ASSESSMENT MAP 2 SUBMISSION 2 GETTING STARTED 3 TASK 1 X CHART
Process Capability Calculations with Extremely Non-Normal Data
 Process Capability Calculations with Extremely Non-Normal Data copyright 2015 (all rights reserved), by: John N. Zorich Jr., MS, CQE Statistical Consultant & Trainer home office: Houston TX 408-203-8811
Assignment 4/5 Statistics Due: Nov. 29
 Assignment 4/5 Statistics 5.301 Due: Nov. 29 1. Two decision rules are given here. Assume they apply to a normally distributed quality characteristic, the control chart has three-sigma control limits,
I/A Series Software FoxSPC.com Statistical Process Control
 I/A Series Software FoxSPC.com Statistical Process Control PSS 21S-4J2 B3 QUALITY PRODUCTIVITY SQC SPC TQC y y y y y y y y yy y y y yy s y yy s sss s ss s s ssss ss sssss $ x x x x x x x x x x x x x x
Chapter 5 INSET Statement. Chapter Table of Contents
 Chapter 5 INSET Statement Chapter Table of Contents OVERVIEW...191 GETTING STARTED...192 DisplayingSummaryStatisticsonaHistogram...192 Formatting Values and Customizing Labels..... 193 AddingaHeaderandPositioningtheInset...194
Multivariate Capability Analysis
 Multivariate Capability Analysis Summary... 1 Data Input... 3 Analysis Summary... 4 Capability Plot... 5 Capability Indices... 6 Capability Ellipse... 7 Correlation Matrix... 8 Tests for Normality... 8
Application of 3D Laser Scanning Measurement on CMMs of Highly Precision Progressive Die Process Part Sanya Kumjing
 International Journal of Engineering & Technology IJET-IJENS Vol:16 No:01 57 Application of 3D Laser Scanning Measurement on CMMs of Highly Precision Progressive Die Process Part Sanya Kumjing Abstract
Section 1.2. Displaying Quantitative Data with Graphs. Mrs. Daniel AP Stats 8/22/2013. Dotplots. How to Make a Dotplot. Mrs. Daniel AP Statistics
 Section. Displaying Quantitative Data with Graphs Mrs. Daniel AP Statistics Section. Displaying Quantitative Data with Graphs After this section, you should be able to CONSTRUCT and INTERPRET dotplots,
CHAPTER 2: SAMPLING AND DATA
 CHAPTER 2: SAMPLING AND DATA This presentation is based on material and graphs from Open Stax and is copyrighted by Open Stax and Georgia Highlands College. OUTLINE 2.1 Stem-and-Leaf Graphs (Stemplots),
What s New in Oracle Crystal Ball? What s New in Version Browse to:
 What s New in Oracle Crystal Ball? Browse to: - What s new in version 11.1.1.0.00 - What s new in version 7.3 - What s new in version 7.2 - What s new in version 7.1 - What s new in version 7.0 - What
Statistical Quality Control Approach in Typical Garments Manufacturing Industry in Bangladesh: A Case Study
 Statistical Quality Control Approach in Typical Garments Manufacturing Industry in Bangladesh: A Case Study * Md. Mohibul Islam and ** Md. Mosharraf Hossain Garments industry is the most important economic
Box-Cox Transformation
 Chapter 190 Box-Cox Transformation Introduction This procedure finds the appropriate Box-Cox power transformation (1964) for a single batch of data. It is used to modify the distributional shape of a set
Bootstrap Confidence Interval of the Difference Between Two Process Capability Indices
 Int J Adv Manuf Technol (2003) 21:249 256 Ownership and Copyright 2003 Springer-Verlag London Limited Bootstrap Confidence Interval of the Difference Between Two Process Capability Indices J.-P. Chen 1
Chapter 1. Looking at Data-Distribution
 Chapter 1. Looking at Data-Distribution Statistics is the scientific discipline that provides methods to draw right conclusions: 1)Collecting the data 2)Describing the data 3)Drawing the conclusions Raw
Chapter 6. The Normal Distribution. McGraw-Hill, Bluman, 7 th ed., Chapter 6 1
 Chapter 6 The Normal Distribution McGraw-Hill, Bluman, 7 th ed., Chapter 6 1 Bluman, Chapter 6 2 Chapter 6 Overview Introduction 6-1 Normal Distributions 6-2 Applications of the Normal Distribution 6-3
MAT 110 WORKSHOP. Updated Fall 2018
 MAT 110 WORKSHOP Updated Fall 2018 UNIT 3: STATISTICS Introduction Choosing a Sample Simple Random Sample: a set of individuals from the population chosen in a way that every individual has an equal chance
Statistical Methods. Instructor: Lingsong Zhang. Any questions, ask me during the office hour, or me, I will answer promptly.
 Statistical Methods Instructor: Lingsong Zhang 1 Issues before Class Statistical Methods Lingsong Zhang Office: Math 544 Email: lingsong@purdue.edu Phone: 765-494-7913 Office Hour: Monday 1:00 pm - 2:00
Mean,Median, Mode Teacher Twins 2015
 Mean,Median, Mode Teacher Twins 2015 Warm Up How can you change the non-statistical question below to make it a statistical question? How many pets do you have? Possible answer: What is your favorite type
Sections Graphical Displays and Measures of Center. Brian Habing Department of Statistics University of South Carolina.
 STAT 515 Statistical Methods I Sections 2.1-2.3 Graphical Displays and Measures of Center Brian Habing Department of Statistics University of South Carolina Redistribution of these slides without permission
Box-Cox Transformation for Simple Linear Regression
 Chapter 192 Box-Cox Transformation for Simple Linear Regression Introduction This procedure finds the appropriate Box-Cox power transformation (1964) for a dataset containing a pair of variables that are
ONE PROCESS, DIFFERENT RESULTS: METHODOLOGIES FOR ANALYZING A STENCIL PRINTING PROCESS USING PROCESS CAPABILITY INDEX ANALYSES
 ONE PROCESS, DIFFERENT RESULTS: METHODOLOGIES FOR ANALYZING A STENCIL PRINTING PROCESS USING PROCESS CAPABILITY INDEX ANALYSES Daryl L. Santos 1, Srinivasa Aravamudhan, Anand Bhosale 3, and Gerald Pham-Van-Diep
Industrial Example I Semiconductor Manufacturing Photolithography Can you tell me anything about this data!
 Can you tell me anything about this data! 1 In Semiconductor Manufacturing the Photolithography process steps are very critical to ensure proper circuit and device performance. Without good CD (critical
Statistics... Basic Descriptive Statistics
 Statistics... Statistics is the study of how best to 1. collect data "Probability" is the mathematical description of "chance" and is a tool for the above that must be part of the course... but it is not
Statistics... Statistics is the study of how best to. 1. collect data. 2. summarize/describe data. 3. draw conclusions/inferences from data
 Statistics... Statistics is the study of how best to 1. collect data 2. summarize/describe data 3. draw conclusions/inferences from data all in a framework that explicitly recognizes the reality and omnipresence
Descriptive Statistics
 Chapter 2 Descriptive Statistics 2.1 Descriptive Statistics 1 2.1.1 Student Learning Objectives By the end of this chapter, the student should be able to: Display data graphically and interpret graphs:
UPPER CONFIDENCE LIMIT FOR NON-NORMAL INCAPABILITY INDEX: A CASE STUDY
 مو تمر الا زهر الهندسي الدولي العاشر AL-AZHAR ENGINEERING TENTH INTERNATIONAL ONFERENE December 4-6, 008 ode: M 01 UPPER ONFIDENE LIMIT FOR NON-NORMAL INAPABILITY INDEX: A ASE STUDY A. Rotondo 1 and Amir
MULTIPLE CHOICE. Choose the one alternative that best completes the statement or answers the question.
 31-32 Review Name 1) Which of the following is the properly rounded mean for the given data? 7, 8, 13, 9, 10, 11 A) 9 B) 967 C) 97 D) 10 2) What is the median of the following set of values? 5, 19, 17,
Prepare a stem-and-leaf graph for the following data. In your final display, you should arrange the leaves for each stem in increasing order.
 Chapter 2 2.1 Descriptive Statistics A stem-and-leaf graph, also called a stemplot, allows for a nice overview of quantitative data without losing information on individual observations. It can be a good
Quantitative - One Population
 Quantitative - One Population The Quantitative One Population VISA procedures allow the user to perform descriptive and inferential procedures for problems involving one population with quantitative (interval)
Exercise 1: Introduction to Stata
 Exercise 1: Introduction to Stata New Stata Commands use describe summarize stem graph box histogram log on, off exit New Stata Commands Downloading Data from the Web I recommend that you use Internet
Modified S-Control Chart for Specified value of Cp
 American International Journal of Research in Science, Technology, Engineering & Mathematics Available online at http://www.iasir.net ISSN (Print): 38-349, ISSN (Online): 38-358, ISSN (CD-ROM): 38-369
Table Of Contents. Table Of Contents
 Statistics Table Of Contents Table Of Contents Basic Statistics... 7 Basic Statistics Overview... 7 Descriptive Statistics Available for Display or Storage... 8 Display Descriptive Statistics... 9 Store
Accelerated Life Testing Module Accelerated Life Testing - Overview
 Accelerated Life Testing Module Accelerated Life Testing - Overview The Accelerated Life Testing (ALT) module of AWB provides the functionality to analyze accelerated failure data and predict reliability
Summarising Data. Mark Lunt 09/10/2018. Arthritis Research UK Epidemiology Unit University of Manchester
 Summarising Data Mark Lunt Arthritis Research UK Epidemiology Unit University of Manchester 09/10/2018 Summarising Data Today we will consider Different types of data Appropriate ways to summarise these
TRACK MAINTENANCE STRATEGIES OPTIMISATION PROBLEM
 TRACK MAINTENANCE STRATEGIES OPTIMISATION PROBLEM Gregory A. Krug Dr. S Krug Consulting Service P.O.B. 44051 Tel-Aviv 61440, Israel Viig@Inter.Net.Il Janusz Madejski Silesian University Of Technology In
Unit I Supplement OpenIntro Statistics 3rd ed., Ch. 1
 Unit I Supplement OpenIntro Statistics 3rd ed., Ch. 1 KEY SKILLS: Organize a data set into a frequency distribution. Construct a histogram to summarize a data set. Compute the percentile for a particular
WHOLE NUMBER AND DECIMAL OPERATIONS
 WHOLE NUMBER AND DECIMAL OPERATIONS Whole Number Place Value : 5,854,902 = Ten thousands thousands millions Hundred thousands Ten thousands Adding & Subtracting Decimals : Line up the decimals vertically.
IT 403 Practice Problems (1-2) Answers
 Answers") IT 403 Practice Problems (1-2) Answers #1. Using Tukey's Hinges method ('Inclusionary'), what is Q3 for this dataset? 2 3 5 7 11 13 17 a. 7 b. 11 c. 12 d. 15 c (12) #2. How do quartiles and percentiles
IT 403 Practice Problems (1-2) Answers #1. Using Tukey's Hinges method ('Inclusionary'), what is Q3 for this dataset? 2 3 5 7 11 13 17 a. 7 b. 11 c. 12 d. 15 c (12) #2. How do quartiles and percentiles
Chapter 5snow year.notebook March 15, 2018
 Chapter 5: Statistical Reasoning Section 5.1 Exploring Data Measures of central tendency (Mean, Median and Mode) attempt to describe a set of data by identifying the central position within a set of data
Overview. Frequency Distributions. Chapter 2 Summarizing & Graphing Data. Descriptive Statistics. Inferential Statistics. Frequency Distribution
 Chapter 2 Summarizing & Graphing Data Slide 1 Overview Descriptive Statistics Slide 2 A) Overview B) Frequency Distributions C) Visualizing Data summarize or describe the important characteristics of a
PARTICLE MEASUREMENT IN CLEAN ROOMS.
 ENGLISH PARTICLE MEASUREMENT IN CLEAN ROOMS. PARTICLE MEASUREMENT Particle measurement in clean rooms. WP1508007-0100-EN, V1R0, 2015-08 PARTICLE MEASUREMENT IN CLEAN ROOMS. WHITEPAPER Content Content...
Probability Models.S4 Simulating Random Variables
 Operations Research Models and Methods Paul A. Jensen and Jonathan F. Bard Probability Models.S4 Simulating Random Variables In the fashion of the last several sections, we will often create probability
Data Statistics Population. Census Sample Correlation... Statistical & Practical Significance. Qualitative Data Discrete Data Continuous Data
 Data Statistics Population Census Sample Correlation... Voluntary Response Sample Statistical & Practical Significance Quantitative Data Qualitative Data Discrete Data Continuous Data Fewer vs Less Ratio
TMTH 3360 NOTES ON COMMON GRAPHS AND CHARTS
 To Describe Data, consider: Symmetry Skewness TMTH 3360 NOTES ON COMMON GRAPHS AND CHARTS Unimodal or bimodal or uniform Extreme values Range of Values and mid-range Most frequently occurring values In
STA Module 2B Organizing Data and Comparing Distributions (Part II)
") STA 2023 Module 2B Organizing Data and Comparing Distributions (Part II) Learning Objectives Upon completing this module, you should be able to 1 Explain the purpose of a measure of center 2 Obtain and
STA 2023 Module 2B Organizing Data and Comparing Distributions (Part II) Learning Objectives Upon completing this module, you should be able to 1 Explain the purpose of a measure of center 2 Obtain and
STA Learning Objectives. Learning Objectives (cont.) Module 2B Organizing Data and Comparing Distributions (Part II)
 Module 2B Organizing Data and Comparing Distributions (Part II)") STA 2023 Module 2B Organizing Data and Comparing Distributions (Part II) Learning Objectives Upon completing this module, you should be able to 1 Explain the purpose of a measure of center 2 Obtain and
STA 2023 Module 2B Organizing Data and Comparing Distributions (Part II) Learning Objectives Upon completing this module, you should be able to 1 Explain the purpose of a measure of center 2 Obtain and
Statistics: Normal Distribution, Sampling, Function Fitting & Regression Analysis (Grade 12) *
 *") OpenStax-CNX module: m39305 1 Statistics: Normal Distribution, Sampling, Function Fitting & Regression Analysis (Grade 12) * Free High School Science Texts Project This work is produced by OpenStax-CNX
OpenStax-CNX module: m39305 1 Statistics: Normal Distribution, Sampling, Function Fitting & Regression Analysis (Grade 12) * Free High School Science Texts Project This work is produced by OpenStax-CNX
MHPE 494: Data Analysis. Welcome! The Analytic Process
 MHPE 494: Data Analysis Alan Schwartz, PhD Department of Medical Education Memoona Hasnain,, MD, PhD, MHPE Department of Family Medicine College of Medicine University of Illinois at Chicago Welcome! Your
Topic (3) SUMMARIZING DATA - TABLES AND GRAPHICS
 SUMMARIZING DATA - TABLES AND GRAPHICS") Topic (3) SUMMARIZING DATA - TABLES AND GRAPHICS 3- Topic (3) SUMMARIZING DATA - TABLES AND GRAPHICS A) Frequency Distributions For Samples Defn: A FREQUENCY DISTRIBUTION is a tabular or graphical display
Topic (3) SUMMARIZING DATA - TABLES AND GRAPHICS 3- Topic (3) SUMMARIZING DATA - TABLES AND GRAPHICS A) Frequency Distributions For Samples Defn: A FREQUENCY DISTRIBUTION is a tabular or graphical display
2014 Stat-Ease, Inc. All Rights Reserved.
 What s New in Design-Expert version 9 Factorial split plots (Two-Level, Multilevel, Optimal) Definitive Screening and Single Factor designs Journal Feature Design layout Graph Columns Design Evaluation
CHAPTER 2 DESCRIPTIVE STATISTICS
 CHAPTER 2 DESCRIPTIVE STATISTICS 1. Stem-and-Leaf Graphs, Line Graphs, and Bar Graphs The distribution of data is how the data is spread or distributed over the range of the data values. This is one of
Your Name: Section: 2. To develop an understanding of the standard deviation as a measure of spread.
 Your Name: Section: 36-201 INTRODUCTION TO STATISTICAL REASONING Computer Lab #3 Interpreting the Standard Deviation and Exploring Transformations Objectives: 1. To review stem-and-leaf plots and their