Data Visualization (CIS/DSC 468)
|
|
|
- David Walters
- 5 years ago
- Views:
Transcription
1 Data Visualization (CIS/DSC 468) Tabular Data Dr. David Koop
2 Channel Considerations Discriminability Separability Visual Popout Weber's Law Luminance Perception 2
3 Separability Cannot treat all channels as independent! Separable means each individual channel can be distinguished Integral means the channels are perceived together Position Hue (Color) Size Hue (Color) Width Height Red Green Fully separable Some interference Some/significant interference Major interference [Munzner (ill. Maguire) based on Ware, 2014] 3
4 Relative vs. Absolute Judgments Weber s Law: - We judge based on relative not absolute differences - The amount of perceived difference depends is relative to the object s magnitude! A B A B A B Unframed Unaligned Framed Unaligned Unframed Aligned [Munzner (ill. Maguire), 2014] 4

5 Assignment 2 cis sp/assignment2.html Use D3 1. Repeat Part 3b of A1 using D3 2. Extend Part 1 to create a stacked bar chart 3. Create a line chart that shows a region's numbers that is linked to a dropdown menu allowing you to select the region. Use transitions! 5
6 D3 Examples Start: Simple Solution: With Axes and Scales: With Objects and Margin Convention: pen/mjngwz More on Margin Convention: - (Note this is D3 v3!) 6
7 Exam 1 Wednesday, March 1 in class (12-12:50pm) Format: - Multiple Choice - Short Answer Sample questions on web site: - 7
8 Tables 8
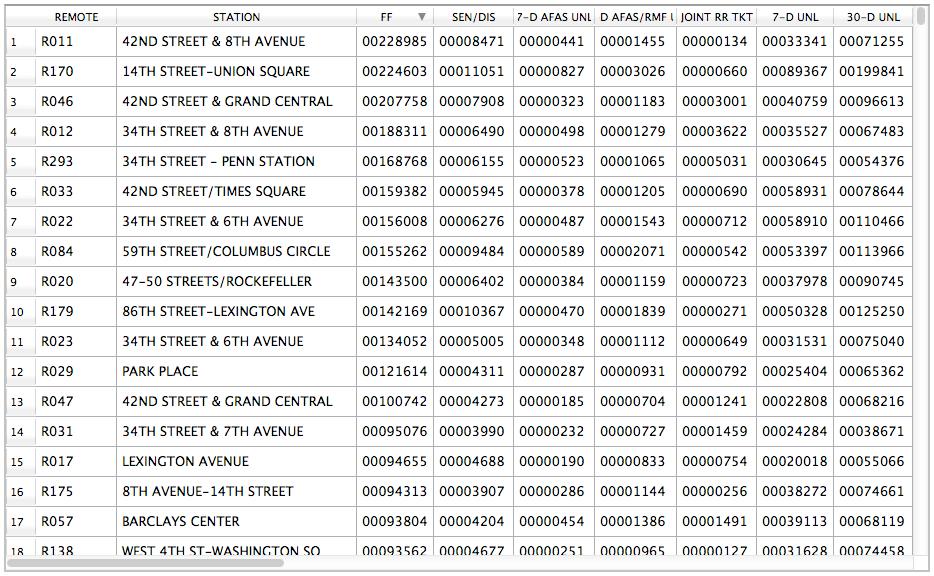
9 Visualization of Tables Items and attributes For now, attributes are not known to be positions Keys and values - key is an independent attribute that is unique and identifies item - value tells some aspect of an item Keys: categorical/ordinal Values: +quantitative Levels: unique values of categorical or ordered attributes Items (rows) Attributes (columns) Cell containing value Multidimensional Table Value in cell [Munzner (ill. Maguire), 2014] 9
10 Arrange Tables Arrange Tables Express Values Separate, Order, Align Regions Separate Order Align 1 Key 2 Keys 3 Keys Many Keys List Matrix Volume Recursive Subdivision Axis Orientation Rectilinear Parallel Radial Layout Density Dense Space-Filling [Munzner (ill. Maguire), 2014] 10
11 Express Values: Scatterplots Prices in Fish Prices over the Years Prices in 1970 Data: two quantitative values Task: find trends, clusters, outliers How: marks at spatial position in horizontal and vertical directions Correlation: dependence between two attributes - Positive and negative correlation - Indicated by lines Coordinate system (axes) and labels are important! 11
12 n dist Coordinate Systems 12 [Wickham, 2014]
13 n dist Log-Log Plot 13 [Wickham, 2014]

14 Bubble Plot [Gapminder, Wealth & Health of Nations] 14
15 Scatterplot Data: two quantitative values Task: find trends, clusters, outliers How: marks at spatial position in horizontal and vertical directions Scalability: hundreds of items Cool recent result from Harrison et al., "Ranking Visualizations of Correlation Using Weber s Law", 2014: - Correlation perception can be modeled via Weber s Law - Scatterplots are one of the best visualizations for both positive and negative correlation - Further analysis: M. Kay and J. Heer, "Beyond Weber's Law",
16 Separate, Order, and Align: Categorical Regions Categorical: =,!= Spatial position can be used for categorical attributes Use regions, distinct contiguous bounded areas, to encode categorical attributes Three operations on the regions: - Separate (use categorical attribute) - Align - Order (use some other ordered attribute) Alignment and order can use same or different attribute 16
17 List Alignment: Bar Charts Data: one quantitative attribute, one categorical attribute Task: lookup & compare values How: line marks, vertical position (quantitative), horizontal position (categorical) What about length? Ordering criteria: alphabetical or using quantitative attribute Scalability: distinguishability - bars at least one pixel wide - hundreds Animal Type Animal Type [Munzner (ill. Maguire), 2014] 17
18 Stacked Bar Charts 35M 30M 25M Population 65 Years and Over 45 to 64 Years 25 to 44 Years 18 to 24 Years 14 to 17 Years 5 to 13 Years Under 5 Years 20M 15M 10M 5.0M 0.0 CA TX NY FL IL PA OH MI GA NC NJ VA WA AZ MA IN TN MOMD WI MN CO AL SC LA KY OR OK CT IA MS AR KS UT NV NMWV NE ID ME NH HI RI MT DE SD AK ND VT DC WY [Bostock, 2012] 18
19 Grouped Bar Chart 10M 9.0M 8.0M 7.0M Population 65 Years and Over 45 to 64 Years 25 to 44 Years 18 to 24 Years 14 to 17 Years 5 to 13 Years Under 5 Years 6.0M 5.0M 4.0M 3.0M 2.0M 1.0M 0.0 CA TX NY FL IL PA [M. Bostock, 19
20 Stacked Bar Charts Data: multidimensional table: one quantitative, two categorical Task: lookup values, part-to-whole relationship, trends How: line marks: position (both horizontal & vertical), subcomponent line marks: length, color Scalability: main axis (hundreds like bar chart), bar classes (<12) Orientation: vertical or horizontal (swap how horizontal and vertical position are used. 20
, one ordered key attribute (time), one")
 Task: analyze trends in time, find (maxmial) outliers How:")

21 Streamgraphs Include a time attribute Data: multidimensional table, one quantitative attribute (count), one ordered key attribute (time), one categorical key attribute + derived attribute: layer ordering (quantitative) Task: analyze trends in time, find (maxmial) outliers How: derived position+geometry, length, color Scalability: more categories than stacked bar charts fig 2 films from the summer of 2007 [Byron and Wattenberg, 2012] 21

22 NYTimes Ebb and Flow of Movies" [ 22
23 Dot and Line Charts Year Data: one quantitative attribute, one ordered attribute Task: lookup values, find outliers and trends How: point mark and positions Line Charts: add connection mark (line) Similar to scatterplots but allow ordered attribute Year [Munzner (ill. Maguire), 2014] 23
24 Proper Use of Line and Bar Charts Female Male 0 Female Male year-olds 12-year-olds year-olds 12-year-olds [Zacks and Tversky, 1999, Munzner (ill. Maguire), 2014] 24
25 Proper Use of Line and Bar Charts Female Male 0 Female Male [Zacks and Tversky, 1999, Munzner (ill. Maguire), 2014] 25
26 Aspect Ratio Trends in line charts are more apparent because we are using angle as a channel Perception of angle (and the relative difference between angles) is important Initial experiments found people best judge differences in slope when angles are around 45 degrees (Cleveland et al., 1988, 1993) 26
27 Multiscale Banking 706 IEEE TRANSACTIONS ON VISUALIZATIO Sunspot Cycles Aspect Ratio = 3.96 Aspect Ratio = Power Spectrum [Heer and Agrawala, 2006] 27
28 Multiscale Banking ON AND COMPUTER GRAPHICS, VOL. 12, NO. 5, SEPTEMBER/OCTOBER 2006 PRMTX Mutual Fund Aspect Ratio = 4.23 Aspect Ratio = Power Spectrum [Heer and Agrawala, 2006] 28
29 Expanding the Study Cleveland et al. did not study the entire space of slope comparisons and 45 degrees was at the low end of their study (blue marks on right) Talbot et al. compared more slopes and found that people do better with smaller slopes Baselines may aid with this Slope ratio (pij) 87% 65% 48% 35% 25% 17% 11% Mid angle (θ m ) [Talbot et al., 2013] 29
, <12 colors Red-green color scales often used - Be aware of colorblindness! Fast-Pitch Softball Slugging Percentage [fastpitchanalytics.")
30 Heatmaps Data: Two keys, one quantitative attribute Task: Find clusters, outliers, summarize How: area marks in grid, color encoding of quantitative attribute Scalability: number of pixels for area marks (millions), <12 colors Red-green color scales often used - Be aware of colorblindness! Fast-Pitch Softball Slugging Percentage [fastpitchanalytics.com] 30
31 Bertin Matrices Must we only use color? - What other marks might be appropriate? [C.Perrin et al., 2014] 31

32 Bertin Matrices Must we only use color? - What other marks might be appropriate? [C.Perrin et al., 2014] 31

33 Bertin s Encodings Text text Grayscale QUANTITY OF INK ENCODINGS POSITIONAL ENCODING MEAN-BASED ENCODINGS Circle Dual bar chart Bar chart Line Black and white bar chart Average bar chart [C.Perrin et al., 2014] 32
, Photo by Robert")
34 Matrix Reordering [Bertin Exhibit (INRIA, Vis 2014), Photo by Robert Kosara] 33

35 Cluster Heatmap [File System Similarity, R. Musăloiu-E., 2009] 34
36 Cluster Heatmap Data & Task: Same as Heatmap How: Area marks but matrix is ordered by cluster hierarchies Scalability: limited by the cluster dendrogram Dendrogram: a visual encoding of tree data with leaves aligned 35
37 Sepal.Length Sepal.Width Petal.Length Petal.Width Iris Data (red=setosa,green=versicolor,blue=virginica) Scatterplot Matrix (SPLOM) Data: Many quantitative attributes Derived Data: names of attributes Task: Find correlations, trends, outliers How: Scatterplots in matrix alignment Scale: attributes: ~12, items: hundreds? Visualizations in a visualization: at high level, marks are themselves visualizations 36 [R command from Wikipedia]
38 Spatial Axis Orientation So far, we have seen the vertical and horizontal axes (a rectilinear layout) used to encode almost everything What other possibilities are there for axes? [Munzner (ill. Maguire), 2014] 37
39 Spatial Axis Orientation So far, we have seen the vertical and horizontal axes (a rectilinear layout) used to encode almost everything What other possibilities are there for axes? - Parallel axes Math Physics Dance Drama Parallel Coordinates [Munzner (ill. Maguire), 2014] 37
40 Spatial Axis Orientation So far, we have seen the vertical and horizontal axes (a rectilinear layout) used to encode almost everything What other possibilities are there for axes? - Parallel axes - Radial axes Math Physics Dance Drama Parallel Coordinates [Munzner (ill. Maguire), 2014] 37
41 Pie Chart 65 < [Pie Chart, Bostock, 2017] 38
42 Pie Charts vs. bar charts [Munzner's Textbook, 2014] - Angle channel is lower precision then position in bar charts What about donut charts? Are we judging angle, or are we judging area, or arc length? - See "An Illustrated Study of the Pie Chart Study Results" by R. Kosara 39

43 Arcs, Angles, or Areas? [R. Kosara and D. Skau, 2016] 40

44 Absolute Error Relative to Pie Chart [R. Kosara and D. Skau, 2016] 41
45 Conclusion: We do not read pie charts by angle [R. Kosara and D. Skau, 2016] 42
46 Pies vs. Bars but area is still harder to judge than position Screens are usually not round 43
CIS 467/602-01: Data Visualization
 CIS 467/602-01: Data Visualization Tables Dr. David Koop Assignment 2 http://www.cis.umassd.edu/ ~dkoop/cis467/assignment2.html Plagiarism on Assignment 1 Any questions? 2 Recap (Interaction) Important
Data Visualization (DSC 530/CIS )
") Data Visualization (DSC 530/CIS 602-02) Tabular Data Dr. David Koop Visual Encoding How should we visualize this data? Name Region Population Life Expectancy Income China East Asia & Pacific 1335029250
Data Visualization (DSC 530/CIS 602-02) Tabular Data Dr. David Koop Visual Encoding How should we visualize this data? Name Region Population Life Expectancy Income China East Asia & Pacific 1335029250
DSC 201: Data Analysis & Visualization
 DSC 201: Data Analysis & Visualization Visualization Design Dr. David Koop Definition Computer-based visualization systems provide visual representations of datasets designed to help people carry out tasks
Telecommunications and Internet Access By Schools & School Districts
 Universal Service Funding for Schools and Libraries FY2014 E-rate Funding Requests Telecommunications and Internet Access By Schools & School Districts Submitted to the Federal Communications Commission,
DEPARTMENT OF HOUSING AND URBAN DEVELOPMENT. [Docket No. FR-6090-N-01]
![DEPARTMENT OF HOUSING AND URBAN DEVELOPMENT. [Docket No. FR-6090-N-01]](/thumbs/83/87513687.jpg "DEPARTMENT OF HOUSING AND URBAN DEVELOPMENT. [Docket No. FR-6090-N-01]") Billing Code 4210-67 This document is scheduled to be published in the Federal Register on 04/05/2018 and available online at https://federalregister.gov/d/2018-06984, and on FDsys.gov DEPARTMENT OF HOUSING
Billing Code 4210-67 This document is scheduled to be published in the Federal Register on 04/05/2018 and available online at https://federalregister.gov/d/2018-06984, and on FDsys.gov DEPARTMENT OF HOUSING
CostQuest Associates, Inc.
 Case Study U.S. 3G Mobile Wireless Broadband Competition Report Copyright 2016 All rights reserved. Case Study Title: U.S. 3G Mobile Wireless Broadband Competition Report Client: All Service Area: Economic
Accommodating Broadband Infrastructure on Highway Rights-of-Way. Broadband Technology Opportunities Program (BTOP)
") Accommodating Broadband Infrastructure on Highway Rights-of-Way Broadband Technology Opportunities Program (BTOP) Introduction Andy Spurgeon Director of Special Projects Denver, CO Key Responsibilities
Accommodating Broadband Infrastructure on Highway Rights-of-Way Broadband Technology Opportunities Program (BTOP) Introduction Andy Spurgeon Director of Special Projects Denver, CO Key Responsibilities
Ocean Express Procedure: Quote and Bind Renewal Cargo
 Ocean Express Procedure: Quote and Bind Renewal Cargo This guide provides steps on how to Quote and Bind your Renewal business using Ocean Express. Renewal Process Click the Ocean Express link within the
2018 NSP Student Leader Contact Form
 2018 NSP Student Leader Contact Form Welcome to the Office of New Student Programs! We are extremely excited to have you on our team. Please complete the below form to confirm your acceptance. Student
Fall 2007, Final Exam, Data Structures and Algorithms
 Fall 2007, Final Exam, Data Structures and Algorithms Name: Section: Email id: 12th December, 2007 This is an open book, one crib sheet (2 sides), closed notebook exam. Answer all twelve questions. Each
The Lincoln National Life Insurance Company Universal Life Portfolio
 The Lincoln National Life Insurance Company Universal Life Portfolio State Availability as of 03/26/2012 PRODUCTS AL AK AZ AR CA CO CT DE DC FL GA GU HI ID IL IN IA KS KY LA ME MP MD MA MI MN MS MO MT
MAKING MONEY FROM YOUR UN-USED CALLS. Connecting People Already on the Phone with Political Polls and Research Surveys. Scott Richards CEO
 MAKING MONEY FROM YOUR UN-USED CALLS Connecting People Already on the Phone with Political Polls and Research Surveys Scott Richards CEO Call Routing 800 Numbers Call Tracking Challenge Phone Carriers
B.2 Measures of Central Tendency and Dispersion
 Appendix B. Measures of Central Tendency and Dispersion B B. Measures of Central Tendency and Dispersion What you should learn Find and interpret the mean, median, and mode of a set of data. Determine
A New Method of Using Polytomous Independent Variables with Many Levels for the Binary Outcome of Big Data Analysis
 Paper 2641-2015 A New Method of Using Polytomous Independent Variables with Many Levels for the Binary Outcome of Big Data Analysis ABSTRACT John Gao, ConstantContact; Jesse Harriott, ConstantContact;
Panelists. Patrick Michael. Darryl M. Bloodworth. Michael J. Zylstra. James C. Green
 Panelists Darryl M. Bloodworth Dean, Mead, Egerton, Bloodworth, Capouano & Bozarth Orlando, FL dbloodworth@deanmead James C. Green VP, General Counsel & Corporate Secretary MANITOU AMERICAS, INC. West
Figure 1 Map of US Coast Guard Districts... 2 Figure 2 CGD Zip File Size... 3 Figure 3 NOAA Zip File Size By State...
 Table of Contents NOAA RNC Charts (By Coast Guard District, NOAA Regions & States) Overview... 1 NOAA RNC Chart File Locations... 2 NOAA RNC by Coast Guard Districts(CGD)... 2 NOAA RNC By States... 3 NOAA
Distracted Driving- A Review of Relevant Research and Latest Findings
 Distracted Driving- A Review of Relevant Research and Latest Findings National Conference of State Legislatures Louisville, KY July 27, 2010 Stephen Oesch The sad fact is that in the coming weeks in particular,
State IT in Tough Times: Strategies and Trends for Cost Control and Efficiency
 State IT in Tough Times: Strategies and Trends for Cost Control and Efficiency NCSL Communications, Financial Services and Interstate Commerce Committee December 10, 2010 Doug Robinson, Executive Director
Data Visualization (CIS/DSC 468)
") Data Visualization (CIS/DSC 468) Marks & Channels Dr. David Koop D3 Pattern Select visual elements (d3.select, d3.selectall) Join them with data items (.data(mydata, key_function)) Using enter, update,
Data Visualization (CIS/DSC 468) Marks & Channels Dr. David Koop D3 Pattern Select visual elements (d3.select, d3.selectall) Join them with data items (.data(mydata, key_function)) Using enter, update,
Representation: Design Idioms 1
 IAT 814 Visualization Representation: Design Idioms 1 Lyn Bartram These slides borrow heavily from T. Munzner and S. Few, and may be incompletely attributed. Work in progress. Recall: Data Abstractions
Name: Business Name: Business Address: Street Address. Business Address: City ST Zip Code. Home Address: Street Address
 Application for Certified Installer Onsite Wastewater Treatment Systems (CIOWTS) Credentials Rev. 6/2012 Step 1. Name and Address of Applicant (Please print or type.) Name: Business Name:_ Business Address:
Silicosis Prevalence Among Medicare Beneficiaries,
 Silicosis Prevalence Among Medicare Beneficiaries, 1999 2014 Megan Casey, RN, BSN, MPH Nurse Epidemiologist Expanding Research Partnerships: State of the Science June 21, 2017 National Institute for Occupational
2018 Supply Cheat Sheet MA/PDP/MAPD
 2018 Supply Cheat Sheet MA/PDP/MAPD Please Note: All agents must be contracted, appointed and certified to order supplies and write business. AETNA/COVENTRY Website: www.aetnamedicare.com A. Click For
NSA s Centers of Academic Excellence in Cyber Security
 NSA s Centers of Academic Excellence in Cyber Security Centers of Academic Excellence in Cybersecurity NSA/DHS CAEs in Cyber Defense (CD) NSA CAEs in Cyber Operations (CO) Lynne Clark, Chief, NSA/DHS CAEs
THE LINEAR PROBABILITY MODEL: USING LEAST SQUARES TO ESTIMATE A REGRESSION EQUATION WITH A DICHOTOMOUS DEPENDENT VARIABLE
 PLS 802 Spring 2018 Professor Jacoby THE LINEAR PROBABILITY MODEL: USING LEAST SQUARES TO ESTIMATE A REGRESSION EQUATION WITH A DICHOTOMOUS DEPENDENT VARIABLE This handout shows the log of a Stata session
Team Members. When viewing this job aid electronically, click within the Contents to advance to desired page. Introduction... 2
 Introduction Team Members When viewing this job aid electronically, click within the Contents to advance to desired page. Contents Introduction... 2 About STARS -... 2 Technical Assistance... 2 STARS User
Presented on July 24, 2018
 Presented on July 24, 2018 Copyright 2018 NCCAOM. Any use of these materials, including reproduction, modification, distribution or republication without the prior written consent of NCCAOM is strictly
DSC 201: Data Analysis & Visualization
 DSC 201: Data Analysis & Visualization Exploratory Data Analysis Dr. David Koop What is Exploratory Data Analysis? "Detective work" to summarize and explore datasets Includes: - Data acquisition and input
Global Forum 2007 Venice
 Global Forum 2007 Venice Broadband Infrastructure for Innovative Applications In Established & Emerging Markets November 5, 2007 Jacquelynn Ruff VP, International Public Policy Verizon Verizon Corporate
MERGING DATAFRAMES WITH PANDAS. Appending & concatenating Series
 MERGING DATAFRAMES WITH PANDAS Appending & concatenating Series append().append(): Series & DataFrame method Invocation: s1.append(s2) Stacks rows of s2 below s1 Method for Series & DataFrames concat()
IT Modernization in State Government Drivers, Challenges and Successes. Bo Reese State Chief Information Officer, Oklahoma NASCIO President
 IT Modernization in State Government Drivers, Challenges and Successes Bo Reese State Chief Information Officer, Oklahoma NASCIO President Top 10: State CIO Priorities for 2018 1. Security 2. Cloud Services
We will start at 2:05 pm! Thanks for coming early!
 We will start at 2:05 pm! Thanks for coming early! Yesterday Fundamental 1. Value of visualization 2. Design principles 3. Graphical perception Record Information Support Analytical Reasoning Communicate
DTFH61-13-C Addressing Challenges for Automation in Highway Construction
 DTFH61-13-C-00026 Addressing Challenges for Automation in Highway Construction Learning Objectives Research Objectives Research Team Introduce Part I: Implementation Challenges and Success Stories Describe
Tina Ladabouche. GenCyber Program Manager
 Tina Ladabouche GenCyber Program Manager GenCyber Help all students understand correct and safe on-line behavior Increase interest in cybersecurity and diversity in cybersecurity workforce of the Nation
Best Practices in Rapid Deployment of PI Infrastructure and Integration with OEM Supplied SCADA Systems
 Best Practices in Rapid Deployment of PI Infrastructure and Integration with OEM Supplied SCADA Systems Kevin Schroeder & Mike Liska OVERVIEW Company Overview Data Background/History Challenges Solutions
Department of Business and Information Technology College of Applied Science and Technology The University of Akron
 Department of Business and Information Technology College of Applied Science and Technology The University of Akron 2017 Spring Graduation Exit Survey Q1 - How would you rate your OVERALL EXPERIENCE at
CSE 781 Data Base Management Systems, Summer 09 ORACLE PROJECT
 1. Create a new tablespace named CSE781. [not mandatory] 2. Create a new user with your name. Assign DBA privilege to this user. [not mandatory] 3. SQL & PLSQL Star Courier Pvt. Ltd. a part of the evergreen
CS-5630 / CS-6630 Visualization for Data Science The Visualization Alphabet: Marks and Channels
 CS-5630 / CS-6630 Visualization for Data Science The Visualization Alphabet: Marks and Channels Alexander Lex alex@sci.utah.edu [xkcd] How can I visually represent two numbers, e.g., 4 and 8 Marks & Channels
Charter EZPort User Guide
 Charter EZPort User Guide Version 2.4 September 14, 2017 Contents Document Information... 3 Version Notice and Change Log... 3 General... 6 Getting Started...7 System Requirements... 7 Initial Access Procedure...
2015 DISTRACTED DRIVING ENFORCEMENT APRIL 10-15, 2015
 2015 DISTRACTED DRIVING ENFORCEMENT APRIL 10-15, 2015 DISTRACTED DRIVING ENFORCEMENT CAMPAIGN COMMUNICATIONS DISTRACTED DRIVING ENFORCEMENT CAMPAIGN Campaign Information Enforcement Dates: April 10-15,
State HIE Strategic and Operational Plan Emerging Models. February 16, 2011
 State HIE Strategic and Operational Plan Emerging Models February 16, 2011 Goals and Objectives The State HIE emerging models can be useful in a wide variety of ways, both within the ONC state-level HIE
Post Graduation Survey Results 2015 College of Engineering Information Networking Institute INFORMATION NETWORKING Master of Science
 INFORMATION NETWORKING Amazon (4) Software Development Engineer (3) Seattle WA Software Development Engineer Sunnyvale CA Apple GPU Engineer Cupertino CA Bloomberg LP Software Engineer New York NY Clari
Moonv6 Update NANOG 34
 Moonv6 Update Outline What is Moonv6? Previous Moonv6 testing April Application Demonstration Future Moonv6 Test Items 2 What is Moonv6? An international project led by the North American IPv6 Task Force
AASHTO s National Transportation Product Evaluation Program
 www.ntpep.org 8/20/2013 AASHTO s National Transportation Product Evaluation Program What is NTPEP? How to access data NTPEP generates-datamine Review of NTPEP Technical Committees for Traffic and Safety
PulseNet Updates: Transitioning to WGS for Reference Testing and Surveillance
 National Center for Emerging and Zoonotic Infectious Diseases PulseNet Updates: Transitioning to WGS for Reference Testing and Surveillance Kelley Hise, MPH Enteric Diseases Laboratory Branch Division
Homework Assignment #5
 Homework Assignment #5-5, Data Mining SOLUTIONS. (a) Create a plot showing the location of each state, with longitude on the horizontal axis, latitude on the vertical axis, and the states names or abbreviations
SAS Visual Analytics 8.2: Working with Report Content
 SAS Visual Analytics 8.2: Working with Report Content About Objects After selecting your data source and data items, add one or more objects to display the results. SAS Visual Analytics provides objects
Sideseadmed (IRT0040) loeng 4/2012. Avo
 loeng 4/2012. Avo") Sideseadmed (IRT0040) loeng 4/2012 Avo avots@lr.ttu.ee 1 Internet Evolution BACKBONE ACCESS NETWORKS WIRELESS NETWORKS OSI mudeli arendus 3 Access technologies PAN / CAN: Bluedooth, Zigbee, IrDA ( WiFi
Sideseadmed (IRT0040) loeng 4/2012 Avo avots@lr.ttu.ee 1 Internet Evolution BACKBONE ACCESS NETWORKS WIRELESS NETWORKS OSI mudeli arendus 3 Access technologies PAN / CAN: Bluedooth, Zigbee, IrDA ( WiFi
Touch Input. CSE 510 Christian Holz Microsoft Research February 11, 2016
 Touch Input CSE 510 Christian Holz Microsoft Research http://www.christianholz.net February 11, 2016 hall of fame/hall of shame? Nokia 5800, 2008 hall of fame/hall of shame? stylus we ve invented [Lightpen
Prizm. manufactured by. White s Electronics, Inc Pleasant Valley Road Sweet Home, OR USA. Visit our site on the World Wide Web
 Prizm II III IV * V Prizm manufactured by White s Electronics, Inc. 1011 Pleasant Valley Road Sweet Home, OR 97386 USA Visit our site on the World Wide Web www.whiteselectronics.com for the latest information
Amy Schick NHTSA, Occupant Protection Division April 7, 2011
 Amy Schick NHTSA, Occupant Protection Division April 7, 2011 In 2009, nearly 5,550 people were killed and an additional 448,000 were injured in crashes involving distraction, accounting for 16% of fatal
The Outlook for U.S. Manufacturing
 The Outlook for U.S. Manufacturing Economic Forecasting Conference J. Mack Robinson College of Business Georgia State University Atlanta, GA November 15, 2006 William Strauss Senior Economist and Economic
Data Visualization Principles for Scientific Communication
 Data Visualization Principles for Scientific Communication 8-888 Introduction to Linguistic Data Analysis Using R Jerzy Wieczorek 11//15 Follow along These slides and a summary checklist are at http://www.stat.cmu.edu/~jwieczor/
Visual Encoding Design
 CSE 442 - Data Visualization Visual Encoding Design Jeffrey Heer University of Washington Review: Expressiveness & Effectiveness / APT Choosing Visual Encodings Assume k visual encodings and n data attributes.
Presentation Outline. Effective Survey Sampling of Rare Subgroups Probability-Based Sampling Using Split-Frames with Listed Households
 Effectve Survey Samplng of Rare Subgroups Probablty-Based Samplng Usng Splt-Frames wth Lsted Households Nature of the Problem Presentaton Outlne Samplng Alternatves Dsproportonal Stratfed Samplng Mansour
A Capabilities Presentation
 A Capabilities Presentation Full Systems Integrator, Value-Add-Reseller, Service Provider for the Federal, State and Local market. Founded in 2006 by former Military IT professionals with Telecommunications,
CP SC 8810 Data Visualization. Joshua Levine
 CP SC 8810 Data Visualization Joshua Levine levinej@clemson.edu Lecture 05 Visual Encoding Sept. 9, 2014 Agenda Programming Lab 01 Questions? Continuing from Lec04 Attribute Types no implicit ordering
Contact Center Compliance Webinar Bringing you the ANSWERS you need about compliance in your call center.
 Contact Center Compliance Webinar Bringing you the ANSWERS you need about compliance in your call center. Welcome Mitch Roth Business to Business Compliance Protocols ATA General Counsel Partner Williams
Visual Encoding Design
 CSE 442 - Data Visualization Visual Encoding Design Jeffrey Heer University of Washington Last Time: Data & Image Models The Big Picture task questions, goals assumptions data physical data type conceptual
Visualization Analysis & Design
 Visualization Analysis & Design Tamara Munzner Department of Computer Science University of British Columbia UBC STAT 545A Guest Lecture October 20 2016, Vancouver BC http://www.cs.ubc.ca/~tmm/talks.html#vad16bryan
cs6964 February TABULAR DATA Miriah Meyer University of Utah
 cs6964 February 23 2012 TABULAR DATA Miriah Meyer University of Utah cs6964 February 23 2012 TABULAR DATA Miriah Meyer University of Utah slide acknowledgements: John Stasko, Georgia Tech Tamara Munzner,
Visualization Analysis & Design Full-Day Tutorial Session 1
 Visualization Analysis & Design Full-Day Tutorial Session 1 Tamara Munzner Department of Computer Science University of British Columbia Sanger Institute / European Bioinformatics Institute June 2014,
ACCESS PROCESS FOR CENTRAL OFFICE ACCESS
 ACCESS PROCESS FOR CENTRAL OFFICE ACCESS NOTE: Every person doing work of any nature in the central offices MUST have an access badge. Anyone who does not have a current access badge will be escorted from
Geographic Accuracy of Cell Phone RDD Sample Selected by Area Code versus Wire Center
 Geographic Accuracy of Cell Phone RDD Sample Selected by versus Xian Tao 1, Benjamin Skalland 1, David Yankey 2, Jenny Jeyarajah 2, Phil Smith 2, Meena Khare 3 1 NORC at the University of Chicago 2 National
Visualization Analysis & Design Full-Day Tutorial Session 2
 Visualization Analysis & Design Full-Day Tutorial Session 2 Tamara Munzner Department of Computer Science University of British Columbia Sanger Institute / European Bioinformatics Institute June 2014,
Data Visualization (CIS/DSC 468)
") Data Visualization (CIS/DSC 468) Data & Tasks Dr. David Koop Programmatic SVG Example Draw a horizontal bar chart - var a = [6, 2, 6, 10, 7, 18, 0, 17, 20, 6]; Steps: - Programmatically create SVG - Create
Data Visualization (CIS/DSC 468) Data & Tasks Dr. David Koop Programmatic SVG Example Draw a horizontal bar chart - var a = [6, 2, 6, 10, 7, 18, 0, 17, 20, 6]; Steps: - Programmatically create SVG - Create
cs6630 September VISUAL ENCODING Miriah Meyer University of Utah
 cs6630 September 9 2014 VISUAL ENCODING Miriah Meyer University of Utah 1 administrivia... 2 - introducing Dr. Josh Levine 3 last time... 4 data abstraction the what part of an analysis that pertains to
Steve Stark Sales Executive Newcastle
 Theresa Lee Thermal Product Manager - Toshiba October 17, 2013 Theresa.lee@tabs.toshiba.com Copyright 2013 Toshiba Corporation. Steve Stark Sales Executive Newcastle sstark@newcastlesys.com Christine Wheeler
Data Visualization (CIS 468)
") Data Visualization (CIS 468) D3 + Marks & Channels Dr. David Koop Tasks Actions Targets Analyze All Data Consume Trends Outliers Features Discover Present Enjoy Produce Annotate Record Derive tag Attributes
Data Visualization (CIS 468) D3 + Marks & Channels Dr. David Koop Tasks Actions Targets Analyze All Data Consume Trends Outliers Features Discover Present Enjoy Produce Annotate Record Derive tag Attributes
Strengthening connections today, while building for tomorrow. Wireless broadband, small cells and 5G
 Strengthening connections today, while building for tomorrow. Wireless broadband, small cells and 5G Our Georgia communities are increasingly turning to wireless networks and mobile technology to operate
Week 4: Facet. Tamara Munzner Department of Computer Science University of British Columbia
 Week 4: Facet Tamara Munzner Department of Computer Science University of British Columbia JRNL 520M, Special Topics in Contemporary Journalism: Visualization for Journalists Week 4: 6 October 2015 http://www.cs.ubc.ca/~tmm/courses/journ15
HYPERVARIATE DATA VISUALIZATION
 HYPERVARIATE DATA VISUALIZATION Prof. Rahul C. Basole CS/MGT 8803-DV > January 25, 2017 Agenda Hypervariate Data Project Elevator Pitch Hypervariate Data (n > 3) Many well-known visualization techniques
Be sure to fax AGA a copy of every application you submitted direct along with the fax confirmation page to ensure you receive your commission!
 Cut Off Instructions AGA will be open normal hours on (3/31), the last business day of the month. If we have no more applications to process, we will be leaving at 5:00pm. If you have applications to submit
Expanding Transmission Capacity: Options and Implications. What role does renewable energy play in driving transmission expansion?
 Expanding Transmission Capacity: Options and Implications What role does renewable energy play in driving transmission expansion? Beth Soholt Director, Wind on the Wires bsoholt@windonthewires.org Office:
What Did You Learn? Key Terms. Key Concepts. 68 Chapter P Prerequisites
 7_0P0R.qp /7/06 9:9 AM Page 68 68 Chapter P Prerequisites What Did You Learn? Key Terms real numbers, p. rational and irrational numbers, p. absolute value, p. variables, p. 6 algebraic epressions, p.
Using a Probabilistic Model to Assist Merging of Large-scale Administrative Records
 Using a Probabilistic Model to Assist Merging of Large-scale Administrative Records Ted Enamorado Benjamin Fifield Kosuke Imai Princeton Harvard Talk at the Tech Science Seminar IQSS, Harvard University
CIE L*a*b* color model
 CIE L*a*b* color model To further strengthen the correlation between the color model and human perception, we apply the following non-linear transformation: with where (X n,y n,z n ) are the tristimulus
Data Visualization Principles for Dashboard Design
 Data Visualization Principles for Dashboard Design Olin College, Data Dashboard Design Jerzy Wieczorek 11/10/15 1 / 70 Follow along These slides and a summary checklist are at http://www.stat.cmu.edu/~jwieczor/
Statistical Methods. Instructor: Lingsong Zhang. Any questions, ask me during the office hour, or me, I will answer promptly.
 Statistical Methods Instructor: Lingsong Zhang 1 Issues before Class Statistical Methods Lingsong Zhang Office: Math 544 Email: lingsong@purdue.edu Phone: 765-494-7913 Office Hour: Monday 1:00 pm - 2:00
CMPE 180A Data Structures and Algorithms in C++ Spring 2018
 San José State University Department of Computer Engineering CMPE 180A Data Structures and Algorithms in C++ Spring 2018 Instructor: Ron Mak Assignment 7 Assigned: Thursday, March 8 Due: Thursday, March
Multivariate Data More Overview
 Multivariate Data More Overview CS 4460 - Information Visualization Jim Foley Last Revision August 2016 Some Key Concepts Quick Review Data Types Data Marks Basic Data Types N-Nominal (categorical) Equal
SAS Visual Analytics 8.2: Getting Started with Reports
 SAS Visual Analytics 8.2: Getting Started with Reports Introduction Reporting The SAS Visual Analytics tools give you everything you need to produce and distribute clear and compelling reports. SAS Visual
Points Lines Connected points X-Y Scatter. X-Y Matrix Star Plot Histogram Box Plot. Bar Group Bar Stacked H-Bar Grouped H-Bar Stacked
 Plotting Menu: QCExpert Plotting Module graphs offers various tools for visualization of uni- and multivariate data. Settings and options in different types of graphs allow for modifications and customizations
Statistical graphics in analysis Multivariable data in PCP & scatter plot matrix. Paula Ahonen-Rainio Maa Visual Analysis in GIS
 Statistical graphics in analysis Multivariable data in PCP & scatter plot matrix Paula Ahonen-Rainio Maa-123.3530 Visual Analysis in GIS 11.11.2015 Topics today YOUR REPORTS OF A-2 Thematic maps with charts
Jurisdictional Guidelines for Accepting a UCC Record Presented for Filing 2010 Amendments & the 2011 IACA Forms
 Jurisdictional Guidelines for ing a UCC Record Presented for Filing 2010 Amendments & the 2011 IACA Forms The following assumptions apply: 1. The problem described is the only issue; all other information
MIS2502: Review for Exam 2. Jing Gong
 MIS2502: Review for Exam 2 Jing Gong gong@temple.edu http://community.mis.temple.edu/gong Overview Date/Time: Thursday, March 24, in class (1 hour 20 minutes) Place: Regular classroom Please arrive 5 minutes
Marks. Marks can be classified according to the number of dimensions required for their representation: Zero: points. One: lines.
 Marks and channels Definitions Marks are basic geometric elements that depict items or links. Channels control the appearance of the marks. This way you can describe the design space of visual encodings
Week 6: Networks, Stories, Vis in the Newsroom
 Week 6: Networks, Stories, Vis in the Newsroom Tamara Munzner Department of Computer Science University of British Columbia JRNL 520H, Special Topics in Contemporary Journalism: Data Visualization Week
Working with Charts Stratum.Viewer 6
 Working with Charts Stratum.Viewer 6 Getting Started Tasks Additional Information Access to Charts Introduction to Charts Overview of Chart Types Quick Start - Adding a Chart to a View Create a Chart with
Lecture 6: Statistical Graphics
 Lecture 6: Statistical Graphics Information Visualization CPSC 533C, Fall 2009 Tamara Munzner UBC Computer Science Mon, 28 September 2009 1 / 34 Readings Covered Multi-Scale Banking to 45 Degrees. Jeffrey
CIS 467/602-01: Data Visualization
 CIS 467/602-01: Data Visualization Interaction Dr. David Koop Interaction Recap The view changes over time Changes can affect almost any aspect of the visualization - encoding - arrangement - ordering
8. MINITAB COMMANDS WEEK-BY-WEEK
 8. MINITAB COMMANDS WEEK-BY-WEEK In this section of the Study Guide, we give brief information about the Minitab commands that are needed to apply the statistical methods in each week s study. They are
Presentation to NANC. January 22, 2003
 Presentation to NANC January 22, 2003 Introduction Service Offering Numbering No Special Number Exhaust Issues Associated with VoIP Providers January 22, 2003 Who is Vonage? 2002 saw the introduction of
MATH 117 Statistical Methods for Management I Chapter Two
 Jubail University College MATH 117 Statistical Methods for Management I Chapter Two There are a wide variety of ways to summarize, organize, and present data: I. Tables 1. Distribution Table (Categorical
Scalable Data Analysis (CIS )
") Scalable Data Analysis (CIS 602-01) Introduction Dr. David Koop NYC Taxi Data [Analyzing 1.1 Billion NYC Taxi and Uber Trips, with a Vengeance, T. W. Schneider] 2 What are your questions about this data?
Scalable Data Analysis (CIS 602-01) Introduction Dr. David Koop NYC Taxi Data [Analyzing 1.1 Billion NYC Taxi and Uber Trips, with a Vengeance, T. W. Schneider] 2 What are your questions about this data?
2013 Product Catalog. Quality, affordable tax preparation solutions for professionals Preparer s 1040 Bundle... $579
 2013 Product Catalog Quality, affordable tax preparation solutions for professionals 2013 Preparer s 1040 Bundle... $579 Includes all of the following: Preparer s 1040 Edition Preparer s 1040 All-States
Chap 12: Facet Into Multiple Views Paper: Multiform Matrices and Small Multiples
 Chap 12: Facet Into Multiple Views Paper: Multiform Matrices and Small Multiples Tamara Munzner Department of Computer Science University of British Columbia CPSC 547: Information Visualization Mon Oct
Perception Maneesh Agrawala CS : Visualization Fall 2013 Multidimensional Visualization
 Perception Maneesh Agrawala CS 294-10: Visualization Fall 2013 Multidimensional Visualization 1 Visual Encoding Variables Position Length Area Volume Value Texture Color Orientation Shape ~8 dimensions?
On All Forms. Financing Statement (Form UCC1) Statutory, MARS or Other Regulatory Authority to Deviate
 Statutory, MARS or Other Regulatory Authority to Deviate") Field Action Article 9 Section Jurisdiction Deviations On All Forms Boxes A-C: Contact Information Statutory, MARS or Other Regulatory Authority to Deviate a. The filer fails to provide information in
Field Action Article 9 Section Jurisdiction Deviations On All Forms Boxes A-C: Contact Information Statutory, MARS or Other Regulatory Authority to Deviate a. The filer fails to provide information in
LAB 1 INSTRUCTIONS DESCRIBING AND DISPLAYING DATA
 LAB 1 INSTRUCTIONS DESCRIBING AND DISPLAYING DATA This lab will assist you in learning how to summarize and display categorical and quantitative data in StatCrunch. In particular, you will learn how to