8. Visual Analytics. Prof. Tulasi Prasad Sariki SCSE, VIT, Chennai
|
|
|
- Alfred Snow
- 5 years ago
- Views:
Transcription

1 8. Visual Analytics Prof. Tulasi Prasad Sariki SCSE, VIT, Chennai
2 Graphs & Trees Graph Vertex/node with one or more edges connecting it to another node. Cyclic or acyclic Edge can be weighted (value) or categorized Tree Undirected graph where two nodes are connected by only one edge used for hierarchy Rooted or unrooted Edge can be weighted (value) or categorized
3 Design Choices Connectivity Node-link graphs Good for finding pairwise/multiway relations Good for following paths through structure Force-directed placement Containment Effective at showing hierarchical structure Good for finding attributes of leaf nodes Treemaps, nested views Matrices
4 Node link diagrams The most common visual encoding idiom for tree and network data is with node link diagrams, where nodes are drawn as point marks and the links connecting them are drawn as line marks. Triangular vertical Spline radial layout
5 Node link diagrams Networks are also very commonly represented as node link diagrams, using connection. Nodes that are directly connected by a single link are perceived as having the tightest grouping, while nodes with a long path of multiple hops between them are less closely grouped. The number of hops within a path - the number of individual links that must be traversed to get from one node to another - is a network-oriented way to measure distances. The connection marks support path tracing via these discrete hops.
6 Node link diagrams Node link diagrams in general are well suited for tasks that involve understanding the network topology: the direct and indirect connections between nodes in terms of the number of hops between them through the set of links. Examples of topology tasks include finding all possible paths from one node to another, finding the shortest path between two nodes, finding all the adjacent nodes one hop away from a target node, and finding nodes that act as a bridge between two components of the network that would otherwise be disconnected.
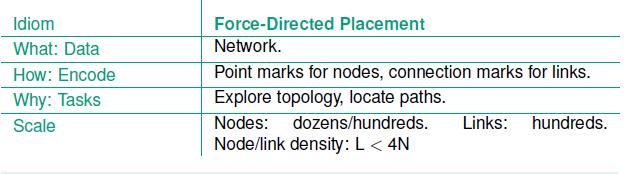
7 Ex: Force-Directed Placement One of the most widely used idioms for node link network layout using connection marks is force-directed placement. There are many variants in the force-directed placement idiom family; in one variant, the network elements are positioned according to a simulation of physical forces where nodes push away from each other while links act like springs that draw Forcedirected placement their endpoint nodes closer to each other. Strengths: Very easy to implement. Relatively easy to understand and explain at a conceptual level,
8 Ex: Force-Directed Placement Analyzing the visual encoding created by force-directed placement is somewhat subtle. Spatial position does not directly encode any attributes of either nodes or links; the placement algorithm uses it indirectly. A tightly interconnected group of nodes with many links between them will often tend to form a visual clump, so spatial proximity does indicate grouping through a strong perceptual cue. However, some visual clumps may simply be artifacts: nodes that have been pushed near each other because they were repelled from elsewhere, not because they are closely connected in the network. Thus, proximity is sometimes meaningful but sometimes arbitrary; this ambiguity can mislead the user.

9 Ex: Force-Directed Placement (a) with size coding for link attributes. (b) with size coding for node attributes.
10 Ex: Force-Directed Placement Weekness One weakness of force-directed placement is that the layouts are often nondeterministic, meaning that they will look different each time the algorithm is run, rather than deterministic approaches such as a scatterplot or a bar chart that yield an identical layout each time for a specific dataset. A major weakness of force-directed placement is scalability, both in terms of the visual complexity of the layout and the time required to compute it.
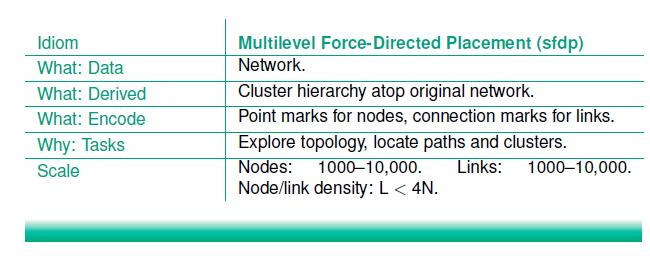
11 Multilevel network idioms Many recent approaches to scalable network drawing are multilevel network idioms, where the original network is augmented with a derived cluster hierarchy to form a compound network. The Cluster hierarchy is computed by coarsening the original network into successively simpler networks that nevertheless attempt to capture the most essential aspects of the original s structure.
12 Multilevel network idioms
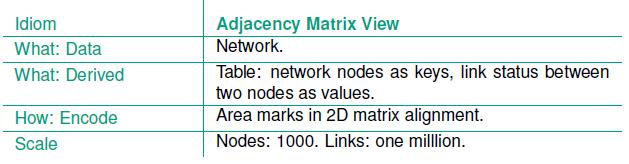
13 Matrix Views Network data can also be encoded with a matrix view by deriving a table from the original network data. Example: Adjacency Matrix View where all of the nodes in the network are laid out along the vertical and horizontal edges of a square region and links between two nodes are indicated by coloring an area mark in the cell in the matrix that is the intersection between their row and column. That is, the network is transformed into the derived dataset of a table with two key attributes that are separate full lists of every node in the network, and one value attribute for each cell records whether a link exists between the nodes that index the cell.
14 Example: Adjacency Matrix View Matrix views of networks can achieve very high information density, up to a limit of one thousand nodes and one million edges, just like cluster heatmaps and all other matrix views that use small area marks.

15 Costs and Benefits: Connection versus Matrix

16 Containment: Hierarchy Marks Containment marks are very effective at showing complete information about hierarchical structure, in contrast to connection marks that only show pairwise relationships between two items at once. Tree Maps: The idiom of treemaps is an alternative to node link tree drawings, where the hierarchical relationships are shown with containment rather than connection.
17 Seven different visual encoding idioms for tree data Using different combinations of visual channels. (a) Rectilinear vertical node link, using connection to show link relationships, with vertical spatial position showing tree depth and horizontal spatial position showing sibling order.
18 Seven different visual encoding idioms for tree data Using different combinations of visual channels. (b) Icicle, with vertical spatial position and size showing tree depth, and horizontal spatial position showing link relationships and sibling order.
 Radial node link, using connection to show link relationships, with radial depth spatial position showing tree depth and radial")
19 Seven different visual encoding idioms for tree data Using different combinations of visual channels. (c) Radial node link, using connection to show link relationships, with radial depth spatial position showing tree depth and radial angular position showing sibling order.
20 Seven different visual encoding idioms for tree data Using different combinations of visual channels. (d) Concentric circles, with radial depth spatial position and size showing tree depth and radial angular spatial position showing link relationships and sibling order.

21 Seven different visual encoding idioms for tree data Using different combinations of visual channels. (e) Nested circles, using radial containment, with nesting level and size showing tree depth.

22 Seven different visual encoding idioms for tree data Using different combinations of visual channels. (f) Treemap, using rectilinear containment, with nesting level and size showing tree depth.
 Indented outline, with horizontal spatial position showing tree depth and link relationships and vertical spatial")
23 Seven different visual encoding idioms for tree data Using different combinations of visual channels. (g) Indented outline, with horizontal spatial position showing tree depth and link relationships and vertical spatial position showing sibling order.
 shows a network (b) shows a cluster hierarchy built on top of it.")
24 Compound Network A compound network is a combination of a network and a tree on top of it, where the nodes in the network are the leaves of the tree. Thus, the interior nodes of the tree encompass multiple network nodes. (a) shows a network (b) shows a cluster hierarchy built on top of it. (c) shows a combined view using of containment marks for the associated hierarchy and connection marks for the original network links
25 Thank You
IAT 355 Intro to Visual Analytics Graphs, trees and networks 2. Lyn Bartram
 IAT 355 Intro to Visual Analytics Graphs, trees and networks 2 Lyn Bartram Graphs and Trees: Connected Data Graph Vertex/node with one or more edges connecting it to another node Cyclic or acyclic Edge
Week 6: Networks, Stories, Vis in the Newsroom
 Week 6: Networks, Stories, Vis in the Newsroom Tamara Munzner Department of Computer Science University of British Columbia JRNL 520H, Special Topics in Contemporary Journalism: Data Visualization Week
3.Data Abstraction. Prof. Tulasi Prasad Sariki SCSE, VIT, Chennai 1 / 26
 3.Data Abstraction Prof. Tulasi Prasad Sariki SCSE, VIT, Chennai www.learnersdesk.weebly.com 1 / 26 Outline What can be visualized? Why Do Data Semantics and Types Matter? Data Types Items, Attributes,
Lecture 13: Graphs/Trees
 Lecture 13: Graphs/Trees Information Visualization CPSC 533C, Fall 2009 Tamara Munzner UBC Computer Science Mon, 31 October 2011 1 / 41 Readings Covered Graph Visualisation in Information Visualisation:
4.Task Abstraction. Prof. Tulasi Prasad Sariki SCSE, VIT, Chennai 1 / 16
 4.Task Abstraction Prof. Tulasi Prasad Sariki SCSE, VIT, Chennai www.learnersdesk.weebly.com 1 / 16 Outline Why Analyze Tasks Abstractly? Who: Designer or User Actions Analyze Consume, Produce Search Lookup,
Graph and Tree Layout
 CS8B :: Nov Graph and Tree Layout Topics Graph and Tree Visualization Tree Layout Graph Layout Jeffrey Heer Stanford University Goals Overview of layout approaches and their strengths and weaknesses Insight
cs6964 March TREES & GRAPHS Miriah Meyer University of Utah
 cs6964 March 1 2012 TREES & GRAPHS Miriah Meyer University of Utah cs6964 March 1 2012 TREES & GRAPHS Miriah Meyer University of Utah slide acknowledgements: Hanspeter Pfister, Harvard University Jeff
Basic Idea. The routing problem is typically solved using a twostep
 Global Routing Basic Idea The routing problem is typically solved using a twostep approach: Global Routing Define the routing regions. Generate a tentative route for each net. Each net is assigned to a
Graph and Tree Layout
 CS8B :: Nov Graph and Tree Layout Topics Graph and Tree Visualization Tree Layout Graph Layout Goals Overview of layout approaches and their strengths and weaknesses Insight into implementation techniques
RINGS : A Technique for Visualizing Large Hierarchies
 RINGS : A Technique for Visualizing Large Hierarchies Soon Tee Teoh and Kwan-Liu Ma Computer Science Department, University of California, Davis {teoh, ma}@cs.ucdavis.edu Abstract. We present RINGS, a
HYBRID FORCE-DIRECTED AND SPACE-FILLING ALGORITHM FOR EULER DIAGRAM DRAWING. Maki Higashihara Takayuki Itoh Ochanomizu University
 HYBRID FORCE-DIRECTED AND SPACE-FILLING ALGORITHM FOR EULER DIAGRAM DRAWING Maki Higashihara Takayuki Itoh Ochanomizu University ABSTRACT Euler diagram drawing is an important problem because we may often
Starting guide for using graph layout with JViews Diagrammer
 Starting guide for using graph layout with JViews Diagrammer Question Do you have a starting guide that list those layouts, and describe the main parameters to use them? Answer IBM ILOG JViews Diagrammer
Trees & Graphs. Nathalie Henry Riche, Microsoft Research
 Trees & Graphs Nathalie Henry Riche, Microsoft Research About Nathalie Henry Riche nath@microsoft.com Researcher @ Microsoft Research since 2009 Today: - Overview of techniques to visualize trees & graphs
Clustering CS 550: Machine Learning
 Clustering CS 550: Machine Learning This slide set mainly uses the slides given in the following links: http://www-users.cs.umn.edu/~kumar/dmbook/ch8.pdf http://www-users.cs.umn.edu/~kumar/dmbook/dmslides/chap8_basic_cluster_analysis.pdf
University of Florida CISE department Gator Engineering. Clustering Part 4
 Clustering Part 4 Dr. Sanjay Ranka Professor Computer and Information Science and Engineering University of Florida, Gainesville DBSCAN DBSCAN is a density based clustering algorithm Density = number of
Clustering Part 4 DBSCAN
 Clustering Part 4 Dr. Sanjay Ranka Professor Computer and Information Science and Engineering University of Florida, Gainesville DBSCAN DBSCAN is a density based clustering algorithm Density = number of
6. Graphs and Networks visualizing relations
 6. Graphs and Networks visualizing relations Vorlesung Informationsvisualisierung Prof. Dr. Andreas Butz, WS 2011/12 Konzept und Basis für n: Thorsten Büring 1 Outline Graph overview Terminology Networks
Project and Production Management Prof. Arun Kanda Department of Mechanical Engineering Indian Institute of Technology, Delhi
 Project and Production Management Prof. Arun Kanda Department of Mechanical Engineering Indian Institute of Technology, Delhi Lecture - 8 Consistency and Redundancy in Project networks In today s lecture
Ray Tracing Acceleration Data Structures
 Ray Tracing Acceleration Data Structures Sumair Ahmed October 29, 2009 Ray Tracing is very time-consuming because of the ray-object intersection calculations. With the brute force method, each ray has
Scene Graphs. COMP 575/770 Fall 2010
 Scene Graphs COMP 575/770 Fall 2010 1 Data structures with transforms Representing a drawing ( scene ) List of objects Transform for each object can use minimal primitives: ellipse is transformed circle
Anatomy of Tables and Graphs. Matthew Wettergreen, PhD
 Anatomy of Tables and Graphs Matthew Wettergreen, PhD What You Will Learn Tables: Data in a Tabular Form Anatomy of a Table Types of Tables Graphs: Data in a Visual Form Anatomy of a Graph Commonly used
Lecture 12: Graphs/Trees
 Lecture 12: Graphs/Trees Information Visualization CPSC 533C, Fall 2009 Tamara Munzner UBC Computer Science Mon, 26 October 2009 1 / 37 Proposal Writeup Expectations project title (not just 533 Proposal
Information Visualization. Jing Yang Spring Hierarchy and Tree Visualization
 Information Visualization Jing Yang Spring 2008 1 Hierarchy and Tree Visualization 2 1 Hierarchies Definition An ordering of groups in which larger groups encompass sets of smaller groups. Data repository
Graph Clarity, Simplification, & Interaction
 Graph Clarity, Simplification, & Interaction http://i.imgur.com/cw19ibr.jpg https://www.reddit.com/r/cablemanagement/ Today Today s Reading: Lombardi Graphs Bezier Curves Today s Reading: Clustering/Hierarchical
CP SC 8810 Data Visualization. Joshua Levine
 CP SC 8810 Data Visualization Joshua Levine levinej@clemson.edu Lecture 15 Text and Sets Oct. 14, 2014 Agenda Lab 02 Grades! Lab 03 due in 1 week Lab 2 Summary Preferences on x-axis label separation 10
Graph Models for Global Routing: Grid Graph
 Graph Models for Global Routing: Grid Graph Each cell is represented by a vertex. Two vertices are joined by an edge if the corresponding cells are adjacent to each other. The occupied cells are represented
6. Graphs & Networks. Visualizing relations. Dr. Thorsten Büring, 29. November 2007, Vorlesung Wintersemester 2007/08
 6. Graphs & Networks Visualizing relations Dr. Thorsten Büring, 29. November 2007, Vorlesung Wintersemester 2007/08 Slide 1 / 46 Outline Graph overview Terminology Networks and trees Data structures Graph
Spatial Data Structures
 CSCI 420 Computer Graphics Lecture 17 Spatial Data Structures Jernej Barbic University of Southern California Hierarchical Bounding Volumes Regular Grids Octrees BSP Trees [Angel Ch. 8] 1 Ray Tracing Acceleration
Introduction to Graphs. CS2110, Spring 2011 Cornell University
 Introduction to Graphs CS2110, Spring 2011 Cornell University A graph is a data structure for representing relationships. Each graph is a set of nodes connected by edges. Synonym Graph Hostile Slick Icy
Graph Layout. Last Time: Conveying Structure. Framework for conveying structure. Photographs and illustrations. What is a good view?
 Graph Layout Maneesh Agrawala Last Time: Conveying Structure CS 294-10: Visualization Spring 2011 Photographs and illustrations Framework for conveying structure Goal: Expose important internal features
Spatial Analysis (Vector) II
 II") Spatial Analysis (Vector) II GEOG 300, Lecture 9 Dr. Anthony Jjumba 1 A Spatial Network is a set of geographic locations interconnected in a system by a number of routes is a system of linear features
Spatial Analysis (Vector) II GEOG 300, Lecture 9 Dr. Anthony Jjumba 1 A Spatial Network is a set of geographic locations interconnected in a system by a number of routes is a system of linear features
Graph and Digraph Glossary
 1 of 15 31.1.2004 14:45 Graph and Digraph Glossary A B C D E F G H I-J K L M N O P-Q R S T U V W-Z Acyclic Graph A graph is acyclic if it contains no cycles. Adjacency Matrix A 0-1 square matrix whose
CIS 467/602-01: Data Visualization
 CIS 467/602-01: Data Visualization Tables Dr. David Koop Assignment 2 http://www.cis.umassd.edu/ ~dkoop/cis467/assignment2.html Plagiarism on Assignment 1 Any questions? 2 Recap (Interaction) Important
Spatial Data Structures
 CSCI 480 Computer Graphics Lecture 7 Spatial Data Structures Hierarchical Bounding Volumes Regular Grids BSP Trees [Ch. 0.] March 8, 0 Jernej Barbic University of Southern California http://www-bcf.usc.edu/~jbarbic/cs480-s/
Transformation Hierarchies. CS 4620 Lecture 5
 Transformation Hierarchies CS 4620 Lecture 5 2013 Steve Marschner 1 Data structures with transforms Representing a drawing ( scene ) List of objects Transform for each object can use minimal primitives:
6. Graphs and Networks visualizing relations
 6. Graphs and Networks visualizing relations Vorlesung Informationsvisualisierung Prof. Dr. Andreas Butz, WS 2009/10 Konzept und Basis für n: Thorsten Büring 1 Outline Graph overview Terminology Networks
i-vis Information Visualization Research Group
 version 1.0 BILKENT UNIVERSITY i-vis Information Visualization Research Group Chisio User s Guide B I L K E N T I - V I S R E S E A R C H G R O U P Chisio User s Guide i-vis Research Group Computer Engineering
Data Abstractions. National Chiao Tung University Chun-Jen Tsai 05/23/2012
 Data Abstractions National Chiao Tung University Chun-Jen Tsai 05/23/2012 Concept of Data Structures How do we store some conceptual structure in a linear memory? For example, an organization chart: 2/32
CS839: Epistemic Net Visualization Challenge
 CS839: Epistemic Net Visualization Challenge Chaman Singh Verma, Kim Nak Ho and Emma Turetsky March 17, 2010 Abstract Epistemic networks consist of sets of correlated concepts. The data is represented
Review of Graph Theory. Gregory Provan
 Review of Graph Theory Gregory Provan Overview Need for graphical models of computation Cloud computing Data centres Telecommunications networks Graph theory Graph Models for Cloud Computing Integration
Chapter 8: Data Abstractions
 Chapter 8: Data Abstractions Computer Science: An Overview Tenth Edition by J. Glenn Brookshear Presentation files modified by Farn Wang Copyright 28 Pearson Education, Inc. Publishing as Pearson Addison-Wesley
3. Cluster analysis Overview
 Université Laval Multivariate analysis - February 2006 1 3.1. Overview 3. Cluster analysis Clustering requires the recognition of discontinuous subsets in an environment that is sometimes discrete (as
CSE 5243 INTRO. TO DATA MINING
 CSE 5243 INTRO. TO DATA MINING Cluster Analysis: Basic Concepts and Methods Huan Sun, CSE@The Ohio State University 09/28/2017 Slides adapted from UIUC CS412, Fall 2017, by Prof. Jiawei Han 2 Chapter 10.
Graph. Vertex. edge. Directed Graph. Undirected Graph
 Module : Graphs Dr. Natarajan Meghanathan Professor of Computer Science Jackson State University Jackson, MS E-mail: natarajan.meghanathan@jsums.edu Graph Graph is a data structure that is a collection
2.2. Data Format Save as UCINET files in Netdraw Import from VNA format Node Level Analysis Degree...
 Contents 0. Processing the Tie Data and Create a VNA File for Binary Network... 2 1. Appearance of UCINET... 4 2. UCINET dataset... 5 2.1 Set Default Folder... 5 2.2. Data Format... 5 2.3 Save as UCINET
CSE 5243 INTRO. TO DATA MINING
 CSE 5243 INTRO. TO DATA MINING Cluster Analysis: Basic Concepts and Methods Huan Sun, CSE@The Ohio State University 09/25/2017 Slides adapted from UIUC CS412, Fall 2017, by Prof. Jiawei Han 2 Chapter 10.
Course Introduction / Review of Fundamentals of Graph Theory
 Course Introduction / Review of Fundamentals of Graph Theory Hiroki Sayama sayama@binghamton.edu Rise of Network Science (From Barabasi 2010) 2 Network models Many discrete parts involved Classic mean-field
Let s start with occluding contours (or interior and exterior silhouettes), and look at image-space algorithms. A very simple technique is to render
, and look at image-space algorithms. A very simple technique is to render") 1 There are two major classes of algorithms for extracting most kinds of lines from 3D meshes. First, there are image-space algorithms that render something (such as a depth map or cosine-shaded model),
1 There are two major classes of algorithms for extracting most kinds of lines from 3D meshes. First, there are image-space algorithms that render something (such as a depth map or cosine-shaded model),
VISUALIZING TREES AND GRAPHS. Petra Isenberg
 VISUALIZING TREES AND GRAPHS Petra Isenberg RECAP you have learned about simple plots multi-attribute data visualization DATA AND ITS STRUCTURE STRUCTURED DATA UNSTRUCTURED DATA STRUCTURED DATA there are
DSC 201: Data Analysis & Visualization
 DSC 201: Data Analysis & Visualization Visualization Design Dr. David Koop Definition Computer-based visualization systems provide visual representations of datasets designed to help people carry out tasks
 Graph Matrices and Applications: Motivational Overview The Problem with Pictorial Graphs Graphs were introduced as an abstraction of software structure. There are many other kinds of graphs that are useful
Unit 7: Maze (Area) and Global Routing
 and Global Routing") Unit 7: Maze (Area) and Global Routing Course contents Routing basics Maze (area) routing Global routing Readings Chapters 9.1, 9.2, 9.5 Filling Unit 7 1 Routing Unit 7 2 Routing Constraints 100% routing
Unit 7: Maze (Area) and Global Routing Course contents Routing basics Maze (area) routing Global routing Readings Chapters 9.1, 9.2, 9.5 Filling Unit 7 1 Routing Unit 7 2 Routing Constraints 100% routing
CS 310 Advanced Data Structures and Algorithms
 CS 31 Advanced Data Structures and Algorithms Graphs July 18, 17 Tong Wang UMass Boston CS 31 July 18, 17 1 / 4 Graph Definitions Graph a mathematical construction that describes objects and relations
Unsupervised Learning : Clustering
 Unsupervised Learning : Clustering Things to be Addressed Traditional Learning Models. Cluster Analysis K-means Clustering Algorithm Drawbacks of traditional clustering algorithms. Clustering as a complex
8. Write an example for expression tree. [A/M 10] (A+B)*((C-D)/(E^F))
![8. Write an example for expression tree. [A/M 10] (A+B)*((C-D)/(E^F))](/thumbs/89/97773603.jpg "8. Write an example for expression tree. [A/M 10] (A+B)*((C-D)/(E^F))") DHANALAKSHMI COLLEGE OF ENGINEERING DEPARTMENT OF COMPUTER SCIENCE AND ENGINEERING EC6301 OBJECT ORIENTED PROGRAMMING AND DATA STRUCTURES UNIT IV NONLINEAR DATA STRUCTURES Part A 1. Define Tree [N/D 08]
DHANALAKSHMI COLLEGE OF ENGINEERING DEPARTMENT OF COMPUTER SCIENCE AND ENGINEERING EC6301 OBJECT ORIENTED PROGRAMMING AND DATA STRUCTURES UNIT IV NONLINEAR DATA STRUCTURES Part A 1. Define Tree [N/D 08]
Challenges in Geographic Routing: Sparse Networks, Obstacles, and Traffic Provisioning
 Challenges in Geographic Routing: Sparse Networks, Obstacles, and Traffic Provisioning Brad Karp Berkeley, CA bkarp@icsi.berkeley.edu DIMACS Pervasive Networking Workshop 2 May, 2 Motivating Examples Vast
Notes. Reminder: HW2 Due Today by 11:59PM. Review session on Thursday. Midterm next Tuesday (10/09/2018)
") 1 Notes Reminder: HW2 Due Today by 11:59PM TA s note: Please provide a detailed ReadMe.txt file on how to run the program on the STDLINUX. If you installed/upgraded any package on STDLINUX, you should
1 Notes Reminder: HW2 Due Today by 11:59PM TA s note: Please provide a detailed ReadMe.txt file on how to run the program on the STDLINUX. If you installed/upgraded any package on STDLINUX, you should
On Your Own. ). Another way is to multiply the. ), and the image. Applications. Unit 3 _ _
. Another way is to multiply the. ), and the image. Applications. Unit 3 _ _") Applications 1 a 90 clockwise rotation matrix: - b As can be seen by the diagram, the image of P is Q and the image of R is P The coordinate of Q can be found by symmetry y R 1 P, Thus, the 45 clockwise
Applications 1 a 90 clockwise rotation matrix: - b As can be seen by the diagram, the image of P is Q and the image of R is P The coordinate of Q can be found by symmetry y R 1 P, Thus, the 45 clockwise
Data Visualization (CIS/DSC 468)
") Data Visualization (CIS/DSC 468) Data & Tasks Dr. David Koop Programmatic SVG Example Draw a horizontal bar chart - var a = [6, 2, 6, 10, 7, 18, 0, 17, 20, 6]; Steps: - Programmatically create SVG - Create
Data Visualization (CIS/DSC 468) Data & Tasks Dr. David Koop Programmatic SVG Example Draw a horizontal bar chart - var a = [6, 2, 6, 10, 7, 18, 0, 17, 20, 6]; Steps: - Programmatically create SVG - Create
Graphs & Digraphs Tuesday, November 06, 2007
 Graphs & Digraphs Tuesday, November 06, 2007 10:34 PM 16.1 Directed Graphs (digraphs) like a tree but w/ no root node & no guarantee of paths between nodes consists of: nodes/vertices - a set of elements
Spatial Data Structures
 15-462 Computer Graphics I Lecture 17 Spatial Data Structures Hierarchical Bounding Volumes Regular Grids Octrees BSP Trees Constructive Solid Geometry (CSG) April 1, 2003 [Angel 9.10] Frank Pfenning Carnegie
Drawing Problem. Possible properties Minimum number of edge crossings Small area Straight or short edges Good representation of graph structure...
 Graph Drawing Embedding Embedding For a given graph G = (V, E), an embedding (into R 2 ) assigns each vertex a coordinate and each edge a (not necessarily straight) line connecting the corresponding coordinates.
An undirected graph is a tree if and only of there is a unique simple path between any 2 of its vertices.
 Trees Trees form the most widely used subclasses of graphs. In CS, we make extensive use of trees. Trees are useful in organizing and relating data in databases, file systems and other applications. Formal
Data Mining Cluster Analysis: Basic Concepts and Algorithms. Lecture Notes for Chapter 8. Introduction to Data Mining
 Data Mining Cluster Analysis: Basic Concepts and Algorithms Lecture Notes for Chapter 8 Introduction to Data Mining by Tan, Steinbach, Kumar Tan,Steinbach, Kumar Introduction to Data Mining 4/18/004 1
CSE 373 Autumn 2012: Midterm #2 (closed book, closed notes, NO calculators allowed)
") Name: Sample Solution Email address: CSE 373 Autumn 0: Midterm # (closed book, closed notes, NO calculators allowed) Instructions: Read the directions for each question carefully before answering. We may
Name: Sample Solution Email address: CSE 373 Autumn 0: Midterm # (closed book, closed notes, NO calculators allowed) Instructions: Read the directions for each question carefully before answering. We may
CSE 417 Dynamic Programming (pt 4) Sub-problems on Trees
 Sub-problems on Trees") CSE 417 Dynamic Programming (pt 4) Sub-problems on Trees Reminders > HW4 is due today > HW5 will be posted shortly Dynamic Programming Review > Apply the steps... 1. Describe solution in terms of solution
CSE 417 Dynamic Programming (pt 4) Sub-problems on Trees Reminders > HW4 is due today > HW5 will be posted shortly Dynamic Programming Review > Apply the steps... 1. Describe solution in terms of solution
Introduction to Geospatial Analysis
 Introduction to Geospatial Analysis Introduction to Geospatial Analysis 1 Descriptive Statistics Descriptive statistics. 2 What and Why? Descriptive Statistics Quantitative description of data Why? Allow
Data Mining Concepts & Techniques
 Data Mining Concepts & Techniques Lecture No 08 Cluster Analysis Naeem Ahmed Email: naeemmahoto@gmailcom Department of Software Engineering Mehran Univeristy of Engineering and Technology Jamshoro Outline
HW4 VINH NGUYEN. Q1 (6 points). Chapter 8 Exercise 20
. Chapter 8 Exercise 20") HW4 VINH NGUYEN Q1 (6 points). Chapter 8 Exercise 20 a. For each figure, could you use single link to find the patterns represented by the nose, eyes and mouth? Explain? First, a single link is a MIN version
HW4 VINH NGUYEN Q1 (6 points). Chapter 8 Exercise 20 a. For each figure, could you use single link to find the patterns represented by the nose, eyes and mouth? Explain? First, a single link is a MIN version
CS570: Introduction to Data Mining
 CS570: Introduction to Data Mining Scalable Clustering Methods: BIRCH and Others Reading: Chapter 10.3 Han, Chapter 9.5 Tan Cengiz Gunay, Ph.D. Slides courtesy of Li Xiong, Ph.D., 2011 Han, Kamber & Pei.
ASSOCIATION BETWEEN VARIABLES: SCATTERGRAMS (Like Father, Like Son)
") POLI 300 Handouts #11 N. R. Miller ASSOCIATION BETWEEN VARIABLES: SCATTERGRAMS (Like Father, Like Son) Though it is not especially relevant to political science, suppose we want to research the following
POLI 300 Handouts #11 N. R. Miller ASSOCIATION BETWEEN VARIABLES: SCATTERGRAMS (Like Father, Like Son) Though it is not especially relevant to political science, suppose we want to research the following
Visual Mapping of Program Components to Resources Representation: a 3D Analysis of Grid Parallel Applications
 Visual Mapping of Program Components to Resources Representation: a 3D Analysis of Grid Parallel Applications Lucas Mello Schnorr, Guillaume Huard, Philippe Olivier Alexandre Navaux Federal University
Spatial Data Structures
 15-462 Computer Graphics I Lecture 17 Spatial Data Structures Hierarchical Bounding Volumes Regular Grids Octrees BSP Trees Constructive Solid Geometry (CSG) March 28, 2002 [Angel 8.9] Frank Pfenning Carnegie
CSC Computer Graphics
 // CSC. Computer Graphics Lecture Kasun@dscs.sjp.ac.lk Department of Computer Science University of Sri Jayewardanepura Polygon Filling Scan-Line Polygon Fill Algorithm Span Flood-Fill Algorithm Inside-outside
Graph Theory Review. January 30, Network Science Analytics Graph Theory Review 1
 Graph Theory Review Gonzalo Mateos Dept. of ECE and Goergen Institute for Data Science University of Rochester gmateosb@ece.rochester.edu http://www.ece.rochester.edu/~gmateosb/ January 30, 2018 Network
2D/3D Geometric Transformations and Scene Graphs
 2D/3D Geometric Transformations and Scene Graphs Week 4 Acknowledgement: The course slides are adapted from the slides prepared by Steve Marschner of Cornell University 1 A little quick math background
OPTIMIZING MOBILITY MANAGEMENT IN FUTURE IPv6 MOBILE NETWORKS
 OPTIMIZING MOBILITY MANAGEMENT IN FUTURE IPv6 MOBILE NETWORKS Sandro Grech Nokia Networks (Networks Systems Research) Supervisor: Prof. Raimo Kantola 1 SANDRO GRECH - OPTIMIZING MOBILITY MANAGEMENT IN
Ordering and Ranking Multivariate Data
 Ordering and Ranking Multivariate Data The concept of order or rank within a multivariate dataset can be quite complicated. How would you rank these data: 1 Obs. Number x 1 x 2 1 10 66 2 19 52 3 8 88 4
Parallel Coordinates ++
 Parallel Coordinates ++ CS 4460/7450 - Information Visualization Feb. 2, 2010 John Stasko Last Time Viewed a number of techniques for portraying low-dimensional data (about 3
Algorithm Design (8) Graph Algorithms 1/2
 Graph Algorithms 1/2") Graph Algorithm Design (8) Graph Algorithms / Graph:, : A finite set of vertices (or nodes) : A finite set of edges (or arcs or branches) each of which connect two vertices Takashi Chikayama School of
Graph Algorithm Design (8) Graph Algorithms / Graph:, : A finite set of vertices (or nodes) : A finite set of edges (or arcs or branches) each of which connect two vertices Takashi Chikayama School of
Edge Equalized Treemaps
 Edge Equalized Treemaps Aimi Kobayashi Department of Computer Science University of Tsukuba Ibaraki, Japan kobayashi@iplab.cs.tsukuba.ac.jp Kazuo Misue Faculty of Engineering, Information and Systems University
CSC Intro to Intelligent Robotics, Spring Graphs
 CSC 445 - Intro to Intelligent Robotics, Spring 2018 Graphs Graphs Definition: A graph G = (V, E) consists of a nonempty set V of vertices (or nodes) and a set E of edges. Each edge has either one or two
17/07/2013 RASTER DATA STRUCTURE GIS LECTURE 4 GIS DATA MODELS AND STRUCTURES RASTER DATA MODEL& STRUCTURE TIN- TRIANGULAR IRREGULAR NETWORK
 RASTER DATA STRUCTURE GIS LECTURE 4 GIS DATA MODELS AND STRUCTURES Space is subdivided into regular grids of square grid cells or other forms of polygonal meshes known as picture elements (pixels) the
Inf 496/596 Topics in Informatics: Analysis of Social Network Data
 Inf 496/596 Topics in Informatics: Analysis of Social Network Data Jagdish S. Gangolly Department of Informatics College of Computing & Information State University of New York at Albany Lecture 1B (Graphs)
Question 2: How do you solve a linear programming problem with a graph?
 Question : How do you solve a linear programming problem with a graph? Now that we have several linear programming problems, let s look at how we can solve them using the graph of the system of inequalities.
Lecture Notes for Chapter 7. Introduction to Data Mining, 2 nd Edition. by Tan, Steinbach, Karpatne, Kumar
 Data Mining Cluster Analysis: Basic Concepts and Algorithms Lecture Notes for Chapter 7 Introduction to Data Mining, 2 nd Edition by Tan, Steinbach, Karpatne, Kumar Hierarchical Clustering Produces a set
Unsupervised Learning
 Outline Unsupervised Learning Basic concepts K-means algorithm Representation of clusters Hierarchical clustering Distance functions Which clustering algorithm to use? NN Supervised learning vs. unsupervised
University of Florida CISE department Gator Engineering. Clustering Part 2
 Clustering Part 2 Dr. Sanjay Ranka Professor Computer and Information Science and Engineering University of Florida, Gainesville Partitional Clustering Original Points A Partitional Clustering Hierarchical
Data can be in the form of numbers, words, measurements, observations or even just descriptions of things.
 + What is Data? Data is a collection of facts. Data can be in the form of numbers, words, measurements, observations or even just descriptions of things. In most cases, data needs to be interpreted and
3.1 Basic Definitions and Applications. Chapter 3. Graphs. Undirected Graphs. Some Graph Applications
 Chapter 3 31 Basic Definitions and Applications Graphs Slides by Kevin Wayne Copyright 2005 Pearson-Addison Wesley All rights reserved 1 Undirected Graphs Some Graph Applications Undirected graph G = (V,
CS443: Digital Imaging and Multimedia Binary Image Analysis. Spring 2008 Ahmed Elgammal Dept. of Computer Science Rutgers University
 CS443: Digital Imaging and Multimedia Binary Image Analysis Spring 2008 Ahmed Elgammal Dept. of Computer Science Rutgers University Outlines A Simple Machine Vision System Image segmentation by thresholding
Data Visualization. Fall 2016
 Data Visualization Fall 2016 Information Visualization Upon now, we dealt with scientific visualization (scivis) Scivisincludes visualization of physical simulations, engineering, medical imaging, Earth
cs6964 February TABULAR DATA Miriah Meyer University of Utah
 cs6964 February 23 2012 TABULAR DATA Miriah Meyer University of Utah cs6964 February 23 2012 TABULAR DATA Miriah Meyer University of Utah slide acknowledgements: John Stasko, Georgia Tech Tamara Munzner,
Computational Discrete Mathematics
 Computational Discrete Mathematics Combinatorics and Graph Theory with Mathematica SRIRAM PEMMARAJU The University of Iowa STEVEN SKIENA SUNY at Stony Brook CAMBRIDGE UNIVERSITY PRESS Table of Contents
Visualizing Etymology: A Radial Graph Displaying Derivations and Origins
 Visualizing Etymology: A Radial Graph Displaying Derivations and Origins Chinmayi Dixit Stanford University cdixit@stanford.edu Filippa Karrfelt Stanford University filippak@stanford.edu ABSTRACT Study
BBS654 Data Mining. Pinar Duygulu. Slides are adapted from Nazli Ikizler
 BBS654 Data Mining Pinar Duygulu Slides are adapted from Nazli Ikizler 1 Classification Classification systems: Supervised learning Make a rational prediction given evidence There are several methods for
Chapter 9: Elementary Graph Algorithms Basic Graph Concepts
 hapter 9: Elementary Graph lgorithms asic Graph oncepts msc 250 Intro to lgorithms graph is a mathematical object that is used to model different situations objects and processes: Linked list Tree (partial
1. [1 pt] What is the solution to the recurrence T(n) = 2T(n-1) + 1, T(1) = 1
![1. [1 pt] What is the solution to the recurrence T(n) = 2T(n-1) + 1, T(1) = 1](/thumbs/80/82301067.jpg "1. [1 pt] What is the solution to the recurrence T(n) = 2T(n-1) + 1, T(1) = 1") Asymptotics, Recurrence and Basic Algorithms 1. [1 pt] What is the solution to the recurrence T(n) = 2T(n-1) + 1, T(1) = 1 1. O(logn) 2. O(n) 3. O(nlogn) 4. O(n 2 ) 5. O(2 n ) 2. [1 pt] What is the solution
Asymptotics, Recurrence and Basic Algorithms 1. [1 pt] What is the solution to the recurrence T(n) = 2T(n-1) + 1, T(1) = 1 1. O(logn) 2. O(n) 3. O(nlogn) 4. O(n 2 ) 5. O(2 n ) 2. [1 pt] What is the solution
Clustering Lecture 3: Hierarchical Methods
 Clustering Lecture 3: Hierarchical Methods Jing Gao SUNY Buffalo 1 Outline Basics Motivation, definition, evaluation Methods Partitional Hierarchical Density-based Mixture model Spectral methods Advanced
Principles of Architectural and Environmental Design EARC 2417 Lecture 2 Forms
 Islamic University-Gaza Faculty of Engineering Architecture Department Principles of Architectural and Environmental Design EARC 2417 Lecture 2 Forms Instructor: Dr. Suheir Ammar 2016 1 FORMS ELEMENTS