USING POINT CLOUDS FOR TRANSPORTATION PROJECTS
|
|
|
- Bennett Henry
- 5 years ago
- Views:
Transcription


1 USING POINT CLOUDS FOR TRANSPORTATION PROJECTS Ron Grant, Director of Marketing, Roads, Bentley Ray Filipiak, Global Pre-Sales Technical Manager, Bentley Presented by Sponsored by
2 TABLE OF CONTENTS Introduction... 1 Reality modeling... 1 Industry drivers... 2 OTHER BENEFITS OF point clouds... 2 LiDAR... 3 Acute3D... 4 Typical point cloud workflow... 7 Preprocess and creating point cloud deliverables... 7 Processing data... 7 Clipping and Sectioning Point Clouds... 8 Creating terrain models and 3D objects... 9 RGB values Coordinate systems Tiling Creating Terrain Models No classifications? Other line and shape extraction Bringing it all together Conclusion Contributors... 29

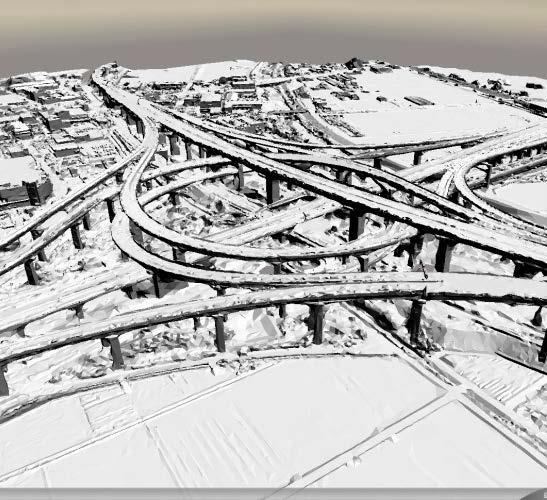
3 INTRODUCTION Data acquisition is a requirement for any civil project. But it can be expensive, time consuming and even dangerous. The increasing prevalence of point clouds, coupled with the advent of drones for gathering them is reducing costs and improving safety. On top of that, there are now many tools available that make point clouds easier to use, and many methods for extracting relevant data from point clouds. There are also many innovations on how those point clouds are prepared for use on transportation projects. But how is this done and what are some real-world applications for this content? REALITY MODELING Point clouds provide us with the ability to model our world as it really exists. The term for this is reality modeling. But why are we focusing on point clouds, visualization tools, and reality modeling and their relationship to 3D modeling in the engineering workflow? Figure 1 1
4 INDUSTRY DRIVERS The Federal Highway Administration s Every Day Counts initiative focuses on bringing 3D modeling into the world of transportation engineering. Much of this involves using point clouds or LiDAR-based data to either create the models of existing structures along the roadway, or provide asset management. The Administration is behind digital asset management, but one key element of this initiative is to provide a safe way to collect data. LiDAR and other means of collecting point clouds offer this safe way of collecting data. This is welcome news to anyone working within this industry who knows just how dangerous these types of projects can be. OTHER BENEFITS OF POINT CLOUDS Beyond issues of safety, and other industry drivers, we are focusing on the use of point clouds because they bring many benefits. When carefully incorporated into a project, point clouds can: Increase productivity Shorten project timeline Decrease project cost Enable better collaboration Improve decision making Improve Information Mobility Increase safety 2

5 Figure 2 LIDAR Point clouds are most often created using LiDAR. Though it might seem like a modern invention, LiDAR has been around for some time. It was invented during World War II as Allied forces were looking for different ways to capture information. They looked at light intensity as a potential to capture data, but LiDAR quickly lost out to sonar and radar since laser focus was not advanced enough, and there wasn t enough computing power developed at that point to address this issue. It wasn t until the 60s and 70s that laser technology became more mature. During this time computers began to advance much faster, allowing for innovations in laser technology. With the vast computing power available today, we can accomplish great things. For instance, today we can stream data to any desktop in the form of a scalable DTM. A scalable DTM works much like 3
6 Google Earth where, from a distance, you can see a vast array of information, but as you zoom in closer and closer you can start to see streets, hotel locations, street names or other more micro information. In this way, the closeness of your view determines the amount of information you are presented with. A scalable DTM works along the same line. For example, if you wanted to know the contours of something that is 50,000 feet, you could break this up into smaller pieces and analyze the data at 20 or 30-foot intervals, seeing a more detailed view of the data. Combining technology like LiDAR and computing power unveils new possibilities. Today, point clouds are very powerful, they can be a tool that we use in preliminary design work, or throughout the asset lifecycle. They're becoming more and more a part of our everyday workflow. PROJECTWISE As streaming and other kinds of data portability solutions becoming a big part of the modern world, it becomes our responsibility to uphold quality of data. Today, it is easy to transfer large data sets onto a flash drive and hand that off to someone. But if this data changes, how will you ensure that person has the most relevant information? It is a responsibility we face today and one which requires strict attention. This is where project management tools like ProjectWise come in. This technology allows you to manage data, but it also allows you to limit the portion of the data that you may be using. This becomes relevant when you are dealing with large-scale projects that might span miles of road, for instance. If you only are worried about a portion of that road, ProjectWise will allow you to stream this data anywhere in the world and manage it effectively. ACUTE3D Rich 3D models can be created using Bentley s Acute3D. These models are created by shooting multiple photos of a site either with a cell phone or a drone. 4

7 Figure 3 This obviously has uses for many industries, but the transportation sector is a particularly effective arena for these applications. With as little as 40 pictures taken with a cell phone camera, 3D models can be generated in a short amount of time to reflect important building components such as conduits and pipes. Modeling as-built structures with these applications provides an accurate, effective representation of the current structural components. On a larger scale, flying over an interchange like this one in Japan can allow for the creation of effective 3D meshes that can aid in transportation-related projects. 5

8 Figure 4 Figure 5 6
9 TYPICAL POINT CLOUD WORKFLOW Though there are many ways to create a point cloud, the typical process involves having a service provider collect and register the point cloud data. From here, this service provider processes the information to create a deliverable. This might involve bringing that data into an environment to integrate into a design or producing a hybrid model of a 3D model along with the point cloud information. PREPROCESS AND CREATING POINT CLOUD DELIVERABLES In the initial stages of a project, Pointools can be used to prepare data. The application is intuitive, easy to learn and requires minimal training. It takes the pain out of working with large point cloud files and is useful because it delivers meaningful output and enhances point cloud workflows. For the processing portion of this workflow, tools like Descartes will allow you to extract features, integrate with design, manage large terrain models and produce hybrid deliverables. This 3D imagery advanced processing allows for better image processing, terrain modeling, point cloud processing, hybrid raster/vector and 3D modeling. PROCESSING DATA When it comes to actually processing the data once it s in the acquisition environment, any type of point cloud can be used in Bentley Pointools. Users can look at the point cloud in animation mode or rendering mode, and even perform tasks like clash detection. Essentially, Pointools is a tool that brings the data in and allows you to view and manipulate it so that your design team can create rich models. A typical point cloud might consist of billions of points. This is often the case when multiple point clouds are merged to create one massive dataset. High points, low points and bounds of information can all be seen within Pointools. You can turn information on and off within Pointools and decide how much of it you need within the view stream to be able to work with it effectively within that environment. Data can also be recolored to fix things like reflectivity that may not indicate the real information. To adjust these discolorations, a paintbrush or 7

10 eyedropper tool can pick the color you want to use from the data and recolor the information to make it be more reflective of what is really in the field. This ensures that you have the most accurate representation of the true data. Looking at a point cloud made up literally of billions of points can be a bit overwhelming. With Pointools, it s easy to zoom in smaller portions of data, and turn features or surrounds off and on to allow you to focus properly on what you intend to study. And with the ability to rotate and change your view, you can look at data from a variety of perspectives. Figure 6 CLIPPING AND SECTIONING POINT CLOUDS Filtering out data allows you to provide a more useful end product for your client. This allows you to ask yourself, what do they really want? Do they want to just see bare earth? Or do they want the whole 3D model that s created representing that ground? As data moves into the design environment, there are many tools available to manipulate the point cloud data. When working with a large point cloud 8

11 you can isolate a volume of interest with the Clip Box tools. The Section Viewer allows you to move a thin Clip Box through your data. Figure 7 Figure 8 CREATING TERRAIN MODELS AND 3D OBJECTS Applications like Bentley Descartes can be used to manipulate point cloud data then MicroStation or InRoads can be used for terrain creation and manipulation. So how does this work in the transportation industry? 9

12 The main goal of the following example is to look at some of the features that are delineated by the different reflectivity or RGB values from a point cloud to be able to extract break lines or other feature objects like copper rails. With this information, a 3D model can be created. There are many ways to look at data, so it is important to choose the right design presentation environment. There are also numerous ways to move around the point cloud data within the design environment. In the following example, the data was colorized based upon the classification and what was reflected back to the scanner when it picked up the data. Here, you can read intensity, elevation, or classification of all points. There are many different ways to view this data. First there is bare earth. Figure 9 There is elevation intensity. 10


13 Figure 10 And there are ways just to view the raw point with no reflectivity associated with it. Figure 11 11

14 Changing the views in this way gives you as the designer different ways to look at your information so you can decide the right backdrop to allow you to get the desired effect from that point cloud information. RGB VALUES Capturing RGB values with your point cloud data provides effective, photo realistic information. When you combine this with orthophoto, you ll have high quality point cloud information that you can use in a design environment. Figure 12 12

15 With programs like InRoads, you can set up cameras within your point cloud and walk around virtually. As you move around the point cloud, you can shift your perspective to look at a wider expanse of data, or to narrow in. Walking around a point cloud in this way gives you a good perspective of what needs to be done for your project. It also shows you what information is out there that can be used for your design. You can set the width of your camera, walk forward or backward, and look left or right as you make your way through the point cloud. Figure 13 With this ability to visualize your projects within the point cloud, you don t need to go into the field and visit projects as frequently. Having the option to see what s in the real world without actually going on site opens up many possibilities for reality modeling. 13


16 COORDINATE SYSTEMS With the right coordinate system, you can re-project on-the-fly. So if you didn t use the right coordinate system, you can easily transform your data into the right geodesy. Figure 14 It s also possible to merge different datum together as needed. Figure 15 14

17 TILING About 25 years ago, computer speeds struggled to keep up with the dense raster imagery picked up from photogrammetry. In order to improve this, tiling was created. Tiling essentially allows you to take large data sets and look at or use only information that falls within that block of tiles. Figure 16 These tiles can be whatever size you choose. The process itself is efficient and fast, so you don t need to take a break or wait for the information to load. This information can be streamed anywhere you chose. You can also choose only to stream the project information relevant to what you are working on. 15

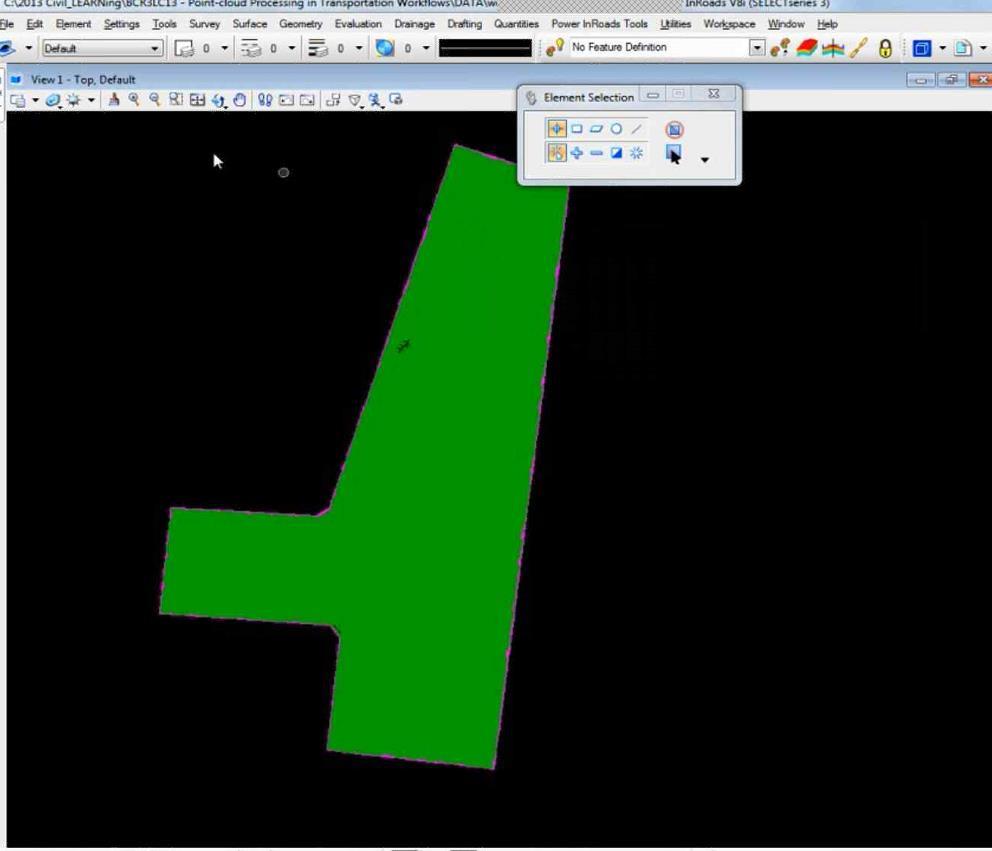
18 CREATING TERRAIN MODELS Creating terrain models can be done directly from a point cloud using tools like GEOPAK, InRoads or MX. You can create terrain models from the whole point cloud, or just from one area. Then you can create contours or slope vectors. You can also colorize based upon elevation slopes or other features. In the following example, bare earth is captured within a terrain model. First, a boundary is set up. From here, a portion of the point cloud was extracted for use in civil design products. With this tool, the user was able to specify edge length, maximum triangle length, pitch boundaries, remove exterior slithers, and input points into a terrain model. Figure 17 Once the terrain model is created, display tools within products like InRoads can turn on triangles. The data within the triangle might be tighter or looser. 16

19 Figure 18 Figure 19 17

20 NO CLASSIFICATIONS? Typical data collection for a point cloud project might involve working with millions or even billions of points. But maybe the only thing you re interested in are break points. Or, maybe you want to pick up points every 25 feet on a grid within a model, instead of every centimeter. But what do you do when you don t have classifications? How do you snap to points, drape points, or pick up cross section data from your massive dataset? This example looks at a rail line. Using Descartes tools, top of rail points along this rail path are gathered. This can be done by grabbing the highest point in the model and setting up parameters within a cylinder within two or three meters. Figure 20 18

21 Once the highest point within the boundary is established, points can be connected as a top of rail. This is done by identifying and snapping to a point. The highest point within this cylinder can be connected to the top of rail. This data can then be used by civil designers. Once top of rail data is captured, the next thing to do might be to gather drape lines or other linear features parallel to the track. This done using MicroStation. Figure 21 In this case, the user paralleled the top of rail and created linear features. Because they are at a parallel point, they have no elevation assigned to them. These features are then draped along the point cloud. 19

22 Figure 22 From here, the user can specify that he wants to pick up vertices that cross a point in the point cloud, or only pick up every 25 or 100 feet. Next, the user wants to pick up random points outside of the road bed section of the track. To do this, he uses an array tool to specify that he wants to lay five points perpendicular to the outside linear feature. Figure 23 20


23 Once these points are laid down and evenly spaced, the array tool can copy those five points to create a 5 foot grid of random points along the track that are draped to the point cloud. Figure 24 With these steps an accurate but less dense model can be created. From here the user picks the points that he s going to array to and copies them along parallel to his track. Figure 25 21


24 Another tool allows you to look at lines and trace them based upon intensity. Here, if you turn down the intensity of surrounding points and assign higher intensity to something like a rail, the system can automatically trace that object. Figure 26 Figure 27 22

25 Figure 28 OTHER LINE AND SHAPE EXTRACTION This technology also works for 3D structures. In this instance, a template is created to tell the product just to follow along those points and a 3D model of this Jersey barrier. When doing this you can look at section views in the point cloud, see the barriers and create a template of that barrier and store it within the library. 23

26 Figure 29 Once the template has been created, you can compare that template to scan lines in your point cloud. When you do this, you might realize you need to make slight adjustments to the barrier. And because each these key points are interactive, you can move them to match the point cloud data. That way is you get to a point where the template changes drastically, you can insert or delete points and change the 3D perspective of the barrier. 24

27 Figure 30 The same thing can be done with objects like bridge decks. Here, a point cloud of the bridge deck has been scanned on top and underneath the bridge. A 3D template of the bridge deck can then be created to make the 3D model. Making adjustments in intervals allows you to create an accurate 3D model of the existing bridge deck. 25

28 Figure 31 BRINGING IT ALL TOGETHER Now that the 3D structures have been created, it s time to bring everything together. Using a 3D model and a point cloud, a 3D model has been created within Descartes, InRoads and MicroStation. The end result is a rich, 3D model of the project that is using all your point cloud data and gives you a solid model of what you re working with within that environment. 26
29 Figure 32 Figure 33 27

30 You can also create a model along the track and then include the 3D model, along with your point cloud data to have two different end products. In other words, part of your deliverable is a model of the actual rail you created, and the other part is your point cloud. Within MicroStation and InRoads you can even drive the rail track and see what your model looks like. Figure 34 CONCLUSION With 3D imaging and data capture, there are infinite possibilities to create rich, accurate end products that both improve efficiency and minimize safety hazards from putting workers onsite. Merging huge point clouds together and filtering to extract only specific structures or features allows users to access real-world information from a project site, without having to plan ahead to collect data only for one section. Nowhere is this more useful than in the transportation industry. From collecting and 28
31 documenting rail lines, to virtually driving through a project site, the various software tools available today allow for better collaboration possibilities. And with the ability to stream information anywhere with tools like ProjectWise, teams across the world can share in the building and development of rich, 3D models that offer insight into real-world data. CONTRIBUTORS Ron Gant is the director of marketing for Roads Bentley. He is a registered professional engineer in Texas who worked for 13 years in the electrical utility industry as a design construction engineer on major fossil and nuclear power projects. In 1990, Ron joined Intergraph Corporation. He moved to Bentley in 2000, when Bentley acquired Intergraph s civil and plotting products. For more than 25 years, Ron has managed technical marketing or sales organizations for Bentley civil products. Ray Filipiak is the global pre-sales technical manager at Bentley. He worked in the civil industry for 25 years at the Illinois Department of Transportation. Ray moved to the Atlanta, Georgia area in 1995 to work for C&G Survey Software. He joined Bentley Systems as an Applications Engineer in He has been involved with the Bentley civil and platform products for the past 25 years, either as a user or in technical sales & support. Ray has been with Bentley for the past 18 years. * Note: This whitepaper is the product of the transcript of a live webinar on While the speakers are cited here as contributors, this whitepaper was not written by the contributors or speakers who appeared in the presentation, nor is it endorsed by the contributors or speakers, or any company, organization or entity they represent. For more information on how this whitepaper was produced, send inquiries via to info@sparpointgroup.com. 29
Bentley Descartes and what s new in Descartes V8i (SELECTseries 3) What is Bentley Descartes? 2011 Bentley Systems, Incorporated
 What is Bentley Descartes? 2011 Bentley Systems, Incorporated") Bentley Descartes and what s new in Descartes V8i (SELECTseries 3) Tom Stogdill Bentley Systems, Inc. What is Bentley Descartes? Image Processing Raster Geo-Referencing Advanced raster transformation (warping,
Bentley Descartes and what s new in Descartes V8i (SELECTseries 3) Tom Stogdill Bentley Systems, Inc. What is Bentley Descartes? Image Processing Raster Geo-Referencing Advanced raster transformation (warping,
USING CONTEXTCAPTURE IN 3D MODELING PRELIMINARY VISUALIZATION PRODUCTION
 USING CONTEXTCAPTURE IN 3D MODELING PRELIMINARY VISUALIZATION PRODUCTION Mo Harmon, Solutions Executive, Roads and Bridges, Bentley Kurt Stiles, VERG Manager, WSDOT Ron Jones, VERG 3D Modeler-Animator,
2011 Bentley Systems, Incorporated. Bentley Descartes V8i Advancing Information Modeling For Intelligent Infrastructure
 Bentley Descartes V8i Advancing Information Modeling For Intelligent Infrastructure Agenda Why would you need Bentley Descartes? What is Bentley Descartes? Advanced Point Cloud Workflows Advanced Terrain
2011 Bentley Systems, Incorporated. Bentley Descartes V8i (SELECTseries 3) Advancing Information Modeling For Intelligent Infrastructure
 Advancing Information Modeling For Intelligent Infrastructure") Bentley Descartes V8i (SELECTseries 3) Advancing Information Modeling For Intelligent Infrastructure What is Bentley Descartes? Image Processing Raster Geo-Referencing Advanced raster transformation (warping,
Bentley Descartes V8i (SELECTseries 3) Advancing Information Modeling For Intelligent Infrastructure What is Bentley Descartes? Image Processing Raster Geo-Referencing Advanced raster transformation (warping,
Innovation. lidarnews.com. volume 3 issue 5. Points clouds and terrain models support rail project. Structured light scanning for human head modeling
 volume 3 issue 5 LIDAR lidarnews.com SCALABILITY Points clouds and terrain models support rail project EXPRESSION Structured light scanning for human head modeling FLUCTUATION Scanning moving objects using
CREATING CUSTOMIZED SPATIAL MODELS WITH POINT CLOUDS USING SPATIAL MODELER OPERATORS TO PROCESS POINT CLOUDS IN IMAGINE 2014
 CREATING CUSTOMIZED SPATIAL MODELS WITH POINT CLOUDS USING SPATIAL MODELER OPERATORS TO PROCESS POINT CLOUDS IN IMAGINE 2014 White Paper December 22, 2016 Contents 1. Introduction... 3 2. ERDAS IMAGINE
Point Cloud Processing and Large Scalable Terrain Model Extraction Inga Morozoff
 Point Cloud Processing and Large Scalable Terrain Model Extraction Inga Morozoff 1 Point cloud data is a new data type that s being driven by the need for accurate 3D as-built information. Point cloud
2/9/2016. Session Agenda: Implementing new Geospatial Technologies for more efficient data capture
 Implementing new Geospatial Technologies for more efficient data capture Jay Haskamp Applied Geospatial Engineer Steve Richter VP Sales Session Agenda: Today s changing technologies and what lies ahead
Title: Improving Your InRoads DTM. Mats Dahlberg Consultant Civil
 Title: Improving Your InRoads DTM Mats Dahlberg Consultant Civil Improving Your InRoads Digital Terrain Model (DTM) Digital Terrain Model A digital representation of a surface topography or terrain composed
Should Contours Be Generated from Lidar Data, and Are Breaklines Required? Lidar data provides the most
 Should Contours Be Generated from Lidar Data, and Are Breaklines Required? Lidar data provides the most accurate and reliable representation of the topography of the earth. As lidar technology advances
Slide 1. Bentley Descartes V8i. Presented by: Inga Morozoff, Bentley
 Slide 1 Bentley Descartes V8i Presented by: Inga Morozoff, Bentley Slide 2 Agenda What is Bentley Descartes? Where is it used? Features Benefits Live demo Questions and Answers 2 WWW.BENTLEY.COM Slide
Suite en It Up with Autodesk ReCap
 Chad Studer ADSK Solutions RC3165 Static and mobile laser scanning technologies capture millions of points and provide photorealistic interactive virtual sites known as point clouds. With Autodesk ReCap
BIM in infrastructure case study: Swedish road projects vägplan
 BIM in infrastructure case study: Swedish road projects vägplan Mateusz Nettmann Moving Poland s construction industry into the future with BIM (BIM Event BPCC) January, 11, 2018 AGENDA Introduction: AECOM
Reality Modeling Webinar
 Reality Modeling Webinar Leveraging 3D Reality Meshes for Real-Time Asset Management and Monitoring What is Reality Modeling? Images & video? What is Reality Modeling? Images & video As-built drawings
Terrain Modeling and Mapping for Telecom Network Installation Using Scanning Technology. Maziana Muhamad
 Terrain Modeling and Mapping for Telecom Network Installation Using Scanning Technology Maziana Muhamad Summarising LiDAR (Airborne Laser Scanning) LiDAR is a reliable survey technique, capable of: acquiring
Workflows for Managing and Serving Elevation (and Lidar) Data. Cody Benkelman
 Data. Cody Benkelman") Workflows for Managing and Serving Elevation (and Lidar) Data Cody Benkelman Outline Usage Modes Data Management - Architecture - Workflow Automation for Repeatability & Scalability A few options re: Cloud,
Workflows for Managing and Serving Elevation (and Lidar) Data Cody Benkelman Outline Usage Modes Data Management - Architecture - Workflow Automation for Repeatability & Scalability A few options re: Cloud,
N.J.P.L.S. An Introduction to LiDAR Concepts and Applications
 N.J.P.L.S. An Introduction to LiDAR Concepts and Applications Presentation Outline LIDAR Data Capture Advantages of Lidar Technology Basics Intensity and Multiple Returns Lidar Accuracy Airborne Laser
MODULE 1 BASIC LIDAR TECHNIQUES
 MODULE SCENARIO One of the first tasks a geographic information systems (GIS) department using lidar data should perform is to check the quality of the data delivered by the data provider. The department
Introduction to InfraWorks 360 for Civil
 Eric Chappell Autodesk Aimed at Civil industry professional, this class will cover basic importing of data sources to make an existing model, followed by creation of roads, buildings, and city furniture
Understanding Geospatial Data Models
 Understanding Geospatial Data Models 1 A geospatial data model is a formal means of representing spatially referenced information. It is a simplified view of physical entities and a conceptualization of
DIGITALGLOBE ENHANCES PRODUCTIVITY
 DIGITALGLOBE ENHANCES PRODUCTIVITY WITH NVIDIA GRID High-performance virtualized desktops transform daily tasks and drastically improve staff efficiency. ABOUT DIGITALGLOBE FIVE REASONS FOR NVIDIA GRID
Feature Extraction from Imagery & Lidar. Kurt Schwoppe, Esri Mark Romero, Esri Gregory Bacon, Fairfax County
 Feature Extraction from & Lidar Kurt Schwoppe, Esri Mark Romero, Esri Gregory Bacon, Fairfax County Today s Speakers Image Processing Experts and Good Colleagues Kurt Schwoppe Industry Lead Esri Mark Romero
Aerial and Mobile LiDAR Data Fusion
 Creating Value Delivering Solutions Aerial and Mobile LiDAR Data Fusion Dr. Srini Dharmapuri, CP, PMP What You Will Learn About LiDAR Fusion Mobile and Aerial LiDAR Technology Components & Parameters Project
Surveying like never before
 CAD functionalities GCP Mapping and Aerial Image Processing Software for Land Surveying Specialists Surveying like never before www.3dsurvey.si Modri Planet d.o.o., Distributors: info@3dsurvey.si +386
Bentleyuser.dk Årsmøde 2012 Nordic Civil 2012
 Bentleyuser.dk Årsmøde 2012 Nordic Civil 2012 5.-7. November 2012, Munkebjerg Hotel, Vejle Workshop X7 Civil Design Review: 3D Modeling and Team Leader: Joe Waxmonsky, PE Bentley Systems, Incorporated
Validation of Aerial LiDAR Products For Transportation Applications
 Creating Value Delivering Solutions Validation of Aerial LiDAR Products For Transportation Applications Dr. Srini Dharmapuri, CP, PMP Michael Baker Jr., Inc. Lauren Little, PE Alaska DOT Public Facility
POINT CLOUD PROCESSING
 POINT CLOUD PROCESSING August 19-20 Northern California Bentley Bash 2011 UC Berkeley Berkeley, CA Taught by: Mike Lazear Point Cloud Processing Point Cloud Processing N O R T H E R N C A L I F O R N I
Bentley Civil Workshop
 Bentley Civil Workshop 2013 Bentley LEARNing Conference BCR4WK2 - IMPORTING AND EDITING SURVEY DATA Team Leader: Kevin Jackson Bentley Systems, Incorporated 685 Stockton Drive Exton, PA 19341 www.bentley.com
APPENDIX E2. Vernal Pool Watershed Mapping
 APPENDIX E2 Vernal Pool Watershed Mapping MEMORANDUM To: U.S. Fish and Wildlife Service From: Tyler Friesen, Dudek Subject: SSHCP Vernal Pool Watershed Analysis Using LIDAR Data Date: February 6, 2014
Managing and Serving Elevation and Lidar Data. Cody Benkelman UC 2018
 Managing and Serving Elevation and Lidar Data Cody Benkelman UC 2018 Outline Usage Modes Data Management - Architecture - Workflow Automation for Repeatability & Scalability A few options Usage Modes of
MRR (Multi Resolution Raster) Revolutionizing Raster
 Revolutionizing Raster") MRR (Multi Resolution Raster) Revolutionizing Raster Praveen Gupta Praveen.Gupta@pb.com Pitney Bowes, Noida, India T +91 120 4026000 M +91 9810 659 350 Pitney Bowes, pitneybowes.com/in 5 th Floor, Tower
MRR (Multi Resolution Raster) Revolutionizing Raster Praveen Gupta Praveen.Gupta@pb.com Pitney Bowes, Noida, India T +91 120 4026000 M +91 9810 659 350 Pitney Bowes, pitneybowes.com/in 5 th Floor, Tower
Trimble Business Center Software, v3.30
 Trimble Business Center Software, v3.30 We are pleased to announce a new version of the Trimble Business Center software, version 3.30. This new version includes over 30 new features and enhancements increasing
Jeffrey A. Schepers P.S. EIT Geospatial Services Holland Engineering Inc. 220 Hoover Blvd, Suite 2, Holland, MI Desk
 Jeffrey A. Schepers P.S. EIT Geospatial Services Holland Engineering Inc. 220 Hoover Blvd, Suite 2, Holland, MI 49423 616-594-5127 Desk 616-322-1724 Cell 616-392-5938 Office Mobile LiDAR - Laser Scanning
Digital Photogrammetric System. Version 6.3 USER MANUAL. LIDAR Data processing
 Digital Photogrammetric System Version 6.3 USER MANUAL Table of Contents 1. About... 3 2. Import of LIDAR data... 3 3. Load LIDAR data window... 4 4. LIDAR data loading and displaying... 6 5. Splitting
Creating a Competitive Edge with FARO Scanners
 CASE STUDY Creating a Competitive Edge with FARO Scanners Wesley Grimes President of Collision Engineering Associates, Inc Crash Reconstruction Firm Adopts FARO Laser Scanners To Safely Capture Scenes
Hamilton County Enhances GIS Base Mapping with 1-foot Contours
 Hamilton County Enhances GIS Base Mapping with 1-foot Contours Presented by Larry Stout, Hamilton County GIS Manager Brad Fugate, Woolpert Inc. Today s Presentation Hamilton County s 2004 Base Mapping
GIS Tools for Hydrology and Hydraulics
 1 OUTLINE GIS Tools for Hydrology and Hydraulics INTRODUCTION Good afternoon! Welcome and thanks for coming. I once heard GIS described as a high-end Swiss Army knife: lots of tools in one little package
ADVANCING REALITY MODELING WITH CONTEXTCAPTURE
 ADVANCING REALITY MODELING WITH CONTEXTCAPTURE Knowing the existing conditions of a project is a key asset in any decision process. Governments need to better know their territories, through mapping operations,
UAV s in Surveying: Integration/processes/deliverables A-Z. 3Dsurvey.si
 UAV s in Surveying: Integration/processes/deliverables A-Z Info@eGPS.net TODAY S PROGRAM Introduction to photogrammetry and 3Dsurvey Theoretical facts about the technology and basics of 3dsurvey Introduction
TAKING FLIGHT JULY/AUGUST 2015 COMMERCIAL UAS ADVANCEMENT BALLOONS THE POOR MAN S UAV? SINGLE PHOTON SENSOR REVIEW VOLUME 5 ISSUE 5
 VOLUME 5 ISSUE 5 JULY/AUGUST 2015 TAKING FLIGHT 14 COMMERCIAL UAS ADVANCEMENT 24 BALLOONS THE POOR MAN S UAV? 30 SINGLE PHOTON SENSOR REVIEW Closing in on 500 authorizations the FAA has expedited the exemption
A New Way to Control Mobile LiDAR Data
 A New Way to Control Mobile LiDAR Data Survey control has always been a critically important issue when conducting mobile LiDAR surveys. While the accuracies currently being achieved with the most capable
An Introduction to Lidar & Forestry May 2013
 An Introduction to Lidar & Forestry May 2013 Introduction to Lidar & Forestry Lidar technology Derivatives from point clouds Applied to forestry Publish & Share Futures Lidar Light Detection And Ranging
GE1LC7 - Getting to Know Bentley Descartes for Advanced Image Viewing, Editing and Processing
 GE1LC7 - Getting to Know Bentley Descartes for Advanced Image Viewing, Editing and Processing Inga Morozoff Introduction: Raster data is everywhere - whether you do CAD design, mapping or GIS analysis,
ON THE ROAD JULY/AUGUST MAP PROJECTIONS The importance of horizontal and vertical datums in GIS mapping
 VOLUME 4 ISSUE 5 JULY/AUGUST 2014 ON THE ROAD 30 40 62 MAP PROJECTIONS The importance of horizontal and vertical datums in GIS mapping FOLLOW THE LEDDAR A special purpose sensor that does several 3D measurement
Iowa Department of Transportation Office of Design. Photogrammetric Mapping Specifications
 Iowa Department of Transportation Office of Design Photogrammetric Mapping Specifications March 2015 1 Purpose of Manual These Specifications for Photogrammetric Mapping define the standards and general
TcpMDT. Digital Terrain Model Version 7.5. TcpMDT
 Digital Terrain Model Version 7.5 Versions and Modules PROFESSIONAL STANDARD IMAGES SURVEYING POINT CLOUD Product Features STANDARD Surveying Points Management Digital Terrain Model Contours Terrain Cross
OPEN. INTELLIGENT. Laser Scanning Software Solutions
 OPEN. INTELLIGENT. Laser Scanning Software Solutions www.lfm-software.com The Future of Laser Scanning Safe and efficient operation of complex engineering assets, and the efficient management of their
Chapter 4: Setting Up A SADA File
 Chapter 4: Setting Up A SADA File Let s start out by creating a brand new SADA file. This is very easy to do. Its setting up the site after the file has been created that can take a bit more effort. When
Realworks Software. A Powerful 3D Laser Scanning Office Software Suite
 TECHNICAL NOTES Realworks Software A Powerful 3D Laser Scanning Office Software Suite Trimble RealWorks is a powerful office software that imports rich data from your 3D laser scanning instrument and transforms
RealWorks Software. A Powerful 3D Laser Scanning Office Software Suite
 TECHNICAL NOTES RealWorks Software A Powerful 3D Laser Scanning Office Software Suite Trimble RealWorks is a powerful office software that imports rich data from your 3D laser scanning instrument and transforms
Dynamic 3D representation of information using low cost Cloud ready Technologies
 National Technical University Of Athens School of Rural and Surveying Engineering Laboratory of Photogrammetry Dynamic 3D representation of information using low cost Cloud ready Technologies George MOURAFETIS,
NEXTMap World 10 Digital Elevation Model
 NEXTMap Digital Elevation Model Intermap Technologies, Inc. 8310 South Valley Highway, Suite 400 Englewood, CO 80112 10012015 NEXTMap (top) provides an improvement in vertical accuracy and brings out greater
TerraScan Tool Guide
 TerraScan Main Toolbox General Toolbar Draw Toolbar Groups Toolbar Vectorize Towers Toolbar Road Toolbar Buildings Toolbar Building Edges Toolbar View Laser Toolbar Model Toolbar Vectorize Wires Toolbar
Channel Conditions in the Onion Creek Watershed. Integrating High Resolution Elevation Data in Flood Forecasting
 Channel Conditions in the Onion Creek Watershed Integrating High Resolution Elevation Data in Flood Forecasting Lukas Godbout GIS in Water Resources CE394K Fall 2016 Introduction Motivation Flooding is
3D in the ArcGIS Platform. Chris Andrews
 3D in the ArcGIS Platform Chris Andrews Geospatial 3D is already all around us 3D is expanding the GIS community s opportunity to provide value 3D City & Infrastructure Models Generated 3D features Photogrammetrc
LiDAR Derived Contours
 LiDAR Derived Contours Final Delivery June 10, 2009 Prepared for: Prepared by: Metro 600 NE Grand Avenue Portland, OR 97232 Watershed Sciences, Inc. 529 SW Third Avenue, Suite 300 Portland, OR 97204 Metro
Tools, Tips, and Workflows LP360 Rail Extraction Tools LP360, versions and above
 , Tips, and Workflows LP360, versions 2016.1 and above l 06 March 2017 L. Graham Overview LP360 includes tools to automatically extract a rail alignment (centerline) feature as a polyline as well as classify
Lecture 4: Digital Elevation Models
 Lecture 4: Digital Elevation Models GEOG413/613 Dr. Anthony Jjumba 1 Digital Terrain Modeling Terms: DEM, DTM, DTEM, DSM, DHM not synonyms. The concepts they illustrate are different Digital Terrain Modeling
Reality Check: Processing LiDAR Data. A story of data, more data and some more data
 Reality Check: Processing LiDAR Data A story of data, more data and some more data Red River of the North Red River of the North Red River of the North Red River of the North Introduction and Background
Bentley Civil Workshop
 Bentley Civil Workshop 2015 Spring NCLUG Conference Workshop 32B Using Point Clouds in Civil Workflows Team Leader: Bob Rolle Team Members: Bentley Systems, Incorporated 685 Stockton Drive Exton, PA 19341
Tips for a Good Meshing Experience
 Tips for a Good Meshing Experience Meshes are very powerful and flexible for modeling 2D overland flows in a complex urban environment. However, complex geometries can be frustrating for many modelers
Trimble Realworks Software
 TECHNICAL NOTES Trimble Realworks Software A Powerful 3D Laser Scanning Office Software Suite DESIGNED FOR TODAY S MULTIFACETED SCANNING PROFESSIONAL, TRIMBLE REALWORKS IS A POWERFUL OFFICE SOFTWARE THAT
NEW PERSPECTIVE SEPTEMBER 2017
 VOLUME 7 ISSUE 6 SEPTEMBER 2017 NEW PERSPECTIVE 18 26 38 POLARIS SHOWS THE WAY The terrestrial laser scanning market continues to evolve, providing today s practitioner with an abundance of options LITTLE
TcpMDT Version 7.0 Summary of Differences with Version 6.5
 Sumatra, 9 E-29190 Málaga (Spain) www.aplitop.com Tel.: +34 95 2439771 Fax: +34 95 2431371 TcpMDT Version 7.0 Summary of Differences with Version 6.5 CAD Versions supported TcpMDT 7 works with several
Data Integration in Building Virtual Models
 Data Integration in Building Virtual Models Erik Singels, Geospatial Information Sciences Program Brent Vollmar, Department of Geosciences Adewale Okunoren, Department of Geosciences Carlos L. V. Aiken,
Advanced Data Procurement From A Contractors Perspective
 Advanced Data Procurement From a Contractors Perspective Advanced Data Procurement From A Contractors Perspective Brian K. Smith & Travis Rauscher, PE 1 Session Summary Laser scanning and UAV data procurement
Using rasters for interpolation and visualization in GMS
 v. 10.3 GMS 10.3 Tutorial Using rasters for interpolation and visualization in GMS Objectives This tutorial teaches how GMS uses rasters to support all kinds of digital elevation models and how rasters
ProjectWise for Civil Users
 ProjectWise for Civil Users Arbie Parker, Services Consultant, ProjectWise arbie.parker@bentley.com 1 WWW.BENTLEY.COM 2016 Bentley Systems, Incorporated 2016 Bentley Systems, Incorporated Changes to Civil
LIDAR MAPPING FACT SHEET
 1. LIDAR THEORY What is lidar? Lidar is an acronym for light detection and ranging. In the mapping industry, this term is used to describe an airborne laser profiling system that produces location and
Big Spatial Data Performance With Oracle Database 12c. Daniel Geringer Spatial Solutions Architect
 Big Spatial Data Performance With Oracle Database 12c Daniel Geringer Spatial Solutions Architect Oracle Exadata Database Machine Engineered System 2 What Is the Oracle Exadata Database Machine? Oracle
3D SCANNING SERVICES FOR PUBLIC & PRIVATE CLIENTS
 Services provided include: 3D Scanning of Existing Structures & Equipment 3D Modeling for Current or Future Planning What can be scanned? Any 3-Dimensional Space Industrial Facilities Transshipment and
Assimilation of Break line and LiDAR Data within ESRI s Terrain Data Structure (TDS) for creating a Multi-Resolution Terrain Model
 for creating a Multi-Resolution Terrain Model") Assimilation of Break line and LiDAR Data within ESRI s Terrain Data Structure (TDS) for creating a Multi-Resolution Terrain Model Tarig A. Ali Department of Civil Engineering American University of Sharjah,
Assimilation of Break line and LiDAR Data within ESRI s Terrain Data Structure (TDS) for creating a Multi-Resolution Terrain Model Tarig A. Ali Department of Civil Engineering American University of Sharjah,
Bentley OpenRoads Workshop 2017 FLUG Fall Training Event
 Bentley OpenRoads Workshop 2017 FLUG Fall Training Event F-2P - QuickStart for Roadway Modeling in OpenRoads Technology Bentley Systems, Incorporated 685 Stockton Drive Exton, PA 19341 www.bentley.com
Overview September 7, 2017
 Overview September 7, 2017 Purpose The purpose of this presentation is to provide an overview of the changes to the required deliverables and workflow for developing plans and models for Illinois DOT projects
High resolution survey and orthophoto project of the Dosso-Gaya region in the Republic of Niger. by Tim Leary, Woolpert Inc.
 High resolution survey and orthophoto project of the Dosso-Gaya region in the Republic of Niger by Tim Leary, Woolpert Inc. Geospatial Solutions Photogrammetry & Remote Sensing LiDAR Professional Surveying
Practice Workbook. Pad and Parking Lot Modeling
 Practice Workbook This workbook is designed for use in Live instructor-led training and for OnDemand selfstudy. The explanations and demonstrations are provided by the instructor in the classroom, or in
TCP MDT Digital Terrain Model - V7.5
 TCP MDT Digital Terrain Model - V7.5 Standard Version Introduction The Standard Version is suitable for carrying out all kinds of topographical survey projects, terrain profiles, volume calculations etc.
Bentleyuser.dk Årsmøde 2012 Nordic Civil 2012
 Bentleyuser.dk Årsmøde 2012 Nordic Civil 2012 5.-7. November 2012, Munkebjerg Hotel, Vejle Workshop X13 Advanced Geometrical Layout for Compound and Reversed Curves Team Leader: Richard Bradshaw Bentley
PRODUCT BROCHURE IMAGESTATION HIGH VOLUME PHOTOGRAMMETRY AND PRODUCTION MAPPING
 PRODUCT BROCHURE IMAGESTATION HIGH VOLUME PHOTOGRAMMETRY AND PRODUCTION MAPPING UNPARALLELED PROCESSING, ACCURATE RESULTS FOR CAD AND GIS-BASED WORKFLOWS The ImageStation software suite enables digital
Visualization Insider A Little Background Information
 Visualization Insider A Little Background Information Visualization Insider 2 Creating Backgrounds for 3D Scenes Backgrounds are a critical part of just about every type of 3D scene. Although they are
Improved Applications with SAMB Derived 3 meter DTMs
 Improved Applications with SAMB Derived 3 meter DTMs Evan J Fedorko West Virginia GIS Technical Center 20 April 2005 This report sums up the processes used to create several products from the Lorado 7
The Trimble 3D Scanning Solution: Designed by Surveyors for Surveyors
 The Trimble 3D Scanning Solution: Designed by Surveyors for Surveyors TRIMBLE 3D SCANNING Designed by surveyors for surveyors, the Trimble 3D scanning solution follows the surveying workflow you re familiar
NEWSLETTER Practical Solutions to Technical Problems. Welcome to NRG Import PDF. Import Point Cloud. Overview. Road / Rail Design
 NEWSLETTER 2018 2018 Welcome to NRG 2018 Import PDF Page NRGWIN Projects Overview 2 Road Design 7 Import Point Cloud Overview DTM Map Workspace 2 Show List 2 Merge multiple files 3 Multiple render models
3D Analyst Visualization with ArcGlobe. Brady Hoak, ESRI DC
 3D Analyst Visualization with ArcGlobe Brady Hoak, ESRI DC 3D GIS Viewing geospatial data in 3D leads to new insights 2D 3D Sometimes you need to edit your data in 3D 2D 3D Some problems can only be solved
technical notes trimble realworks software
 technical notes trimble realworks software A POWERFUL 3D LASER SCANNING OFFICE SOFTWARE SUITE Designed for today s multifaceted scanning professional, Trimble RealWorks is a powerful office software that
On Grid: Tools and Techniques to Place Reality Data in a Geographic Coordinate System
 RC21940 On Grid: Tools and Techniques to Place Reality Data in a Geographic Coordinate System Seth Koterba Principal Engineer ReCap Autodesk Ramesh Sridharan Principal Research Engineer Infraworks Autodesk
Microwave. Infrared. Preprogrammed Chip
 Advanced Technology for Design Mapping and Construction Layout AACE A.A.C.E. Meeting August 5, 2009 Daniel K. Mardock RBF Consulting Survey Manager Registered Land Surveyor Certified Federal Surveyor Arizona
Frequently Asked Questions for GeoMedia 3D Customers
 Frequently Asked Questions for GeoMedia 3D Customers Version 2, January 4, 2011 1. Q: What is Intergraph GeoMedia 3D? A: Intergraph s GeoMedia 3D provides 3D enablement for the GeoMedia desktop. However,
Indoor. Heritage Preservation CAD versus Cloud. inside. Applanix and CSIRO. Grows with LiDAR. Vol. 2 Issue 4 ABOVE & BEYOND. ipad & Tablet Ready!
 inside Indoor Mapping Applanix and CSIRO SMALL BUSINESS Grows with LiDAR Heritage Preservation CAD versus Cloud Vol. 2 Issue 4 ABOVE & BEYOND ipad & Tablet Ready! RE-MODELING THE MIXMASTER From Mobile
A Quick Spin on Autodesk Architectural Studio
 December 2-5, 2003 MGM Grand Hotel Las Vegas A Quick Spin on Autodesk Architectural Studio Mario Guttman, AIA Kevin Durham Christie Landry (Instructor) (Assistant) (Assistant) BD13-5L Autodesk Architectural
Surveying Prof. Bharat Lohani Indian Institute of Technology, Kanpur. Lecture - 1 Module - 6 Triangulation and Trilateration
 Surveying Prof. Bharat Lohani Indian Institute of Technology, Kanpur Lecture - 1 Module - 6 Triangulation and Trilateration (Refer Slide Time: 00:21) Welcome to this another lecture on basic surveying.
ROAD-SCANNER COMPACT APPLICATION FIELDS MAIN FEATURES
 ROAD-SCANNER COMPACT Mobile Mapping System by GEXCEL & SITECO collaboration A smaller mobile system for asset management and cartography suited for ZOLLER & FRÖHLICH PROFILER 9012 laser scanner. 2 + 3
Most as-built information is still manually collected. Today s Design Market
 Agenda 1. Overview of 3D laser scanning 2. HDS 3D Laser scanning applications Leica ScanStation2 True Color Scan 3. Demonstration of HDS & Trueview 4. Questions and Answers The advanced 3D Laser Scanning
This document will cover some of the key features available only in SMS Advanced, including:
 Key Differences between SMS Basic and SMS Advanced SMS Advanced includes all of the same functionality as the SMS Basic Software as well as adding numerous tools that provide management solutions for multiple
Reality Modeling Drone Capture Guide
 Reality Modeling Drone Capture Guide Discover the best practices for photo acquisition-leveraging drones to create 3D reality models with ContextCapture, Bentley s reality modeling software. Learn the
Merging LiDAR Data with Softcopy Photogrammetry Data
 Merging LiDAR Data with Softcopy Photogrammetry Data Cindy McCallum WisDOT\Bureau of Technical Services Surveying & Mapping Section Photogrammetry Unit Overview Terms and processes Why use data from LiDAR
Revealing the. Stonehenge. In a major project for English Heritage, Through 3D Digital Modelling. By Neil McLeod
 Revealing the Secrets of Stonehenge Through 3D Digital Modelling In a major project for English Heritage, survey specialists Greenhatch Group used laser scanning, digital photogrammetry and Geomagic Studio
Mobile Mapping Solutions for Ohio s Integrated Transportation Network. Brian Foster, CP
 Mobile Mapping Solutions for Ohio s Integrated Transportation Network Brian Foster, CP About Woolpert Established in 1911 Over 600 Professionals 25 Offices $12,000,000 invested in new technology in last
Visualizing 2D Data in a 3D World
 Visualizing 2D Data in a 3D World Karl Kliparchuk, M.Sc., GISP, and Brendan Walashek, B.Sc. McElhanney Consulting Services Ltd. Email: kkliparchuk@mcelhanney.com and bwalashek@mcelhanney.com Agenda A Quick
Trimble MX2 mobile mapping
 Trimble MX2 mobile mapping user applications Point clouds within your reach The Trimble MX2 is a vehicle-mounted spatial imaging system which combines high resolution laser scanning and panoramic cameras