Section 1.1 The Distance and Midpoint Formulas
|
|
|
- Lesley Lang
- 5 years ago
- Views:
Transcription
1 Section 1.1 The Distance and Midpoint Formulas 1
2 y axis origin x axis 2

, (")
3 Plot the points: ( 3, 5), (0,7), ( 6,0), (6,4) 3
4 Distance Formula y x 4
5 Finding the Distance Between Two Points Find the distance d between the points (2, 4) and ( 1, 3). 5
6 Midpoint Formula y (x 2, y 2 ) y M (x 1, y 1 ) x x 6
7 Find the midpoint of the line segment from P 1 = (4, 2) to P 2 = (2, 5). Plot the points and their midpoint. 7
8 Find the endpoint of the line segment P 2 given P 1 = ( 4, 5) and M = ( 6, 1). Plot the points and their midpoint. 8
9 Section 1.2 Graphs of Equations In Two Variables; Intercepts; Symmetry 9

10 Examples of Equations in Two Variables What rate of return can you expect with a 17% level of risk? What percentage of foreign vs. US investments minimizes risk? What percentage of foreign vs. US investments maximizes return? What is y when x = 4? What is x when y = 3? 10
11 Graph of An Equation The graph of an equation is a drawing that represents all its solutions. Solve: 2x + 3y = 6 11
12 Determining Whether a Point is on the Graph of an Equation Determine if the following points are on the graph of the equation 3x +y = 6 (a) (0, 4) (b) ( 2, 0) (c) ( 1, 3) 12

13 Graphing an Equation by Plotting Points Graph the equation: y = 2x
14 Graphing an Equation by Plotting Points Graph the equation: y = x 2 14
15 Intercepts from a Graph 15
16 Find the intercepts of the graph. Finding Intercepts from a Graph
17 Find Intercepts from an Equation Finding Intercepts To find the x intercepts of the the graph of an equation: To find the y intercepts of the graph of an equation: 17
18 Finding Intercepts from an Equation Find the x intercept(s) and the y intercept(s) of the graph of then graph by plotting points. y = x 4 18
19 Finding Intercepts from an Equation Find the x intercept(s) and the y intercept(s) of the graph of then graph by plotting points. y = x 2 + x 6 19
 on the graph, the point (, ) is also on the graph.")
20 Symmetry and Graphs A graph is said to be symmetric with respect to the x axis if for every point (x, y) on the graph, the point (, ) is also on the graph. 20
21 Points Symmetric with Respect to the x Axis If a graph is symmetric with respect to the x axis and the point (3,2) is on the graph, what other point is also on the graph? 21
 on the graph, the point (, ) is also on the graph.")
22 Symmetry and Graphs A graph is said to be symmetric with respect to the y axis if for every point (x, y) on the graph, the point (, ) is also on the graph. 22
23 Points Symmetric with Respect to the y Axis If a graph is symmetric with respect to the y axis and the point (3,2) is on the graph, what other point is also on the graph? 23

 is also on the graph. 24")
24 Symmetry and Graphs A graph is said to be symmetric with respect to the origin if for every point (x, y) on the graph, the point (, ) is also on the graph. 24
25 Points Symmetric with Respect to the Origin If a graph is symmetric with respect to the origin and the point (3,2) is on the graph, what other point is also on the graph? 25
26 Tests for Symmetry To test the graph of an equation for symmetry with respect to the: x axis: y axis: Origin: 26
27 Testing an Equation for Symmetry 27
28 Know How to Graph Key Equations y = x y = x 2 y = x 3 y = 1 x y = x x = y 2 28
29 Graphing the Equation: y = x 29
30 Graphing the Equation: y = x 2 30
31 Graphing the Equation: y = x 3 31
32 Graphing the Equation: y = x 1 32
33 Graphing the Equation: y = x 33
34 Graphing the Equation: x = y 2 34
35 YOUR TURN!! Testing an Equation for Symmetry Find the intercepts and test for symmetry. 4x 2 + y 2 = 4 35
36 Section 1.3 Lines 36
37 Linear Equations and Slope y = mx + b ax + by = c Slope of a Line (m): 1. Slope is defined by the ratio: m = 2. The slope tells how "steep" a line is and what "direction" it points 3. The slope tells how to get from one point on a line to another point on the line 37
38 The Sign of Slope 38
39 Deriving the Slope Formula m = m = m = 39
40 Compute the slopes of the lines containing the following pairs of points. A = (2, 3) B = ( 1, 2) C = ( 5, 2) D = (3, 2) E = ( 3, 4) F = ( 7, 6) G = (7, 5) H = (7, 2) 40
41 (c) 2 41
42 Graphs of y = mx + 2 Graphs of y = 2x + b 42
43 Find the slope m and y intercept b of the equation 3x 2y = 6. Graph the equation. 43
44 Graph the linear equation 3x + 2y = 6 by finding its intercepts. 44
45 Graph the equation: y = 2 45
46 Graph the equation: x = 2 46
47 Finding an Equation for a Line To find the equation of a line you need:
48 Find the equation of a line with slope 3 and containing the point (0, 5). 48
49 Find the equation of a line with slope 3 and containing the point ( 1, 4). 49
50 Find the equation of a horizontal line containing the point (2, 4). 50
51 Find an equation of the line containing the points ( 1, 4) and (3, 1). 51
52 Parallel Lines 52
53 53
54 Find an equation for the line that contains the point ( 1, 3) and is parallel to the line 3x 4y =
55 Perpendicular Lines 55
56 Find the slope of a line perpendicular to a line with slope. 56
57 Find an equation for the line that contains the point ( 1, 3) and is perpendicular to the line 3x 4y =
58 YOUR TURN!! Finding an Equation for a Line Find the equation for the line passing through the points ( 3, 4) and (2, 5). 58
59 YOUR TURN!! Finding an Equation for a Line Find the equation for the line perpendicular to the line 2x + 3y = 6 passing through the point (2, 5). 59
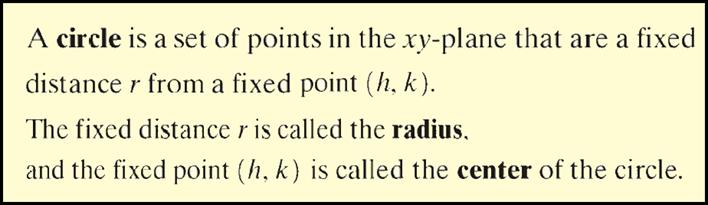
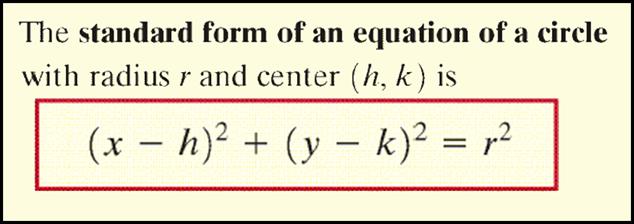
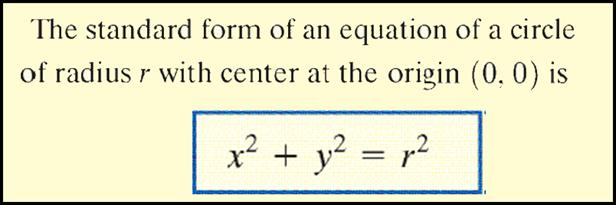
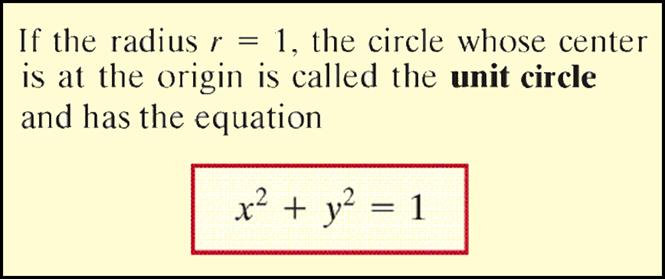
60 Section 1.4 Circles 60
61 61
62 62
63 63
64 64
65 Write the standard form of the equation of the circle with radius 12 and center at the origin. 65
66 Write the standard form of the equation of the circle with radius 4 and center (2, 4). 66
67 67
68 Graph the equation: x 2 + y 2 = 16 68
69 69
70 70
71 71
72 72
73 73
74 Finding an Equations for Circle and Tangent Line Using Distance and Midpoint. (1, 6) A C B (5, 4) 74
75 YOUR TURN!! Finding an Equation for Circle Find the equation for the circle with radius 7 and center ( 3, 5). 75
76 YOUR TURN!! More Circle Stuff Find the center of the circle, any intercepts, and graph. x 2 + y 2 6x + 2y + 9 = 0 76
77 YOUR TURN!! Yet More Circle Stuff Find the equation for the tangent line to the circle x 2 + y 2 = 25 at the point (3, 4) 77
78 Proof: "If two nonvertical lines are perpendicular, then the product of their slopes is 1." y Assume lines are perpendicular 1 x 78
79 79
Test Name: Chapter 3 Review
 Test Name: Chapter 3 Review 1. For the following equation, determine the values of the missing entries. If needed, write your answer as a fraction reduced to lowest terms. 10x - 8y = 18 Note: Each column
WHAT YOU SHOULD LEARN
 GRAPHS OF EQUATIONS WHAT YOU SHOULD LEARN Sketch graphs of equations. Find x- and y-intercepts of graphs of equations. Use symmetry to sketch graphs of equations. Find equations of and sketch graphs of
Each point P in the xy-plane corresponds to an ordered pair (x, y) of real numbers called the coordinates of P.
 of real numbers called the coordinates of P.") Lecture 7, Part I: Section 1.1 Rectangular Coordinates Rectangular or Cartesian coordinate system Pythagorean theorem Distance formula Midpoint formula Lecture 7, Part II: Section 1.2 Graph of Equations
Lecture 7, Part I: Section 1.1 Rectangular Coordinates Rectangular or Cartesian coordinate system Pythagorean theorem Distance formula Midpoint formula Lecture 7, Part II: Section 1.2 Graph of Equations
3.5 Day 1 Warm Up. Graph each line. 3.4 Proofs with Perpendicular Lines
 3.5 Day 1 Warm Up Graph each line. 1. y = 4x 2. y = 3x + 2 3. y = x 3 4. y = 4 x + 3 3 November 2, 2015 3.4 Proofs with Perpendicular Lines Geometry 3.5 Equations of Parallel and Perpendicular Lines Day
Graphing Linear Equations
 Graphing Linear Equations Question 1: What is a rectangular coordinate system? Answer 1: The rectangular coordinate system is used to graph points and equations. To create the rectangular coordinate system,
1.8 Coordinate Geometry. Copyright Cengage Learning. All rights reserved.
 1.8 Coordinate Geometry Copyright Cengage Learning. All rights reserved. Objectives The Coordinate Plane The Distance and Midpoint Formulas Graphs of Equations in Two Variables Intercepts Circles Symmetry
slope rise run Definition of Slope
 The Slope of a Line Mathematicians have developed a useful measure of the steepness of a line, called the slope of the line. Slope compares the vertical change (the rise) to the horizontal change (the
Section Graphs and Lines
 Section 1.1 - Graphs and Lines The first chapter of this text is a review of College Algebra skills that you will need as you move through the course. This is a review, so you should have some familiarity
Chapter 1. Linear Equations and Straight Lines. 2 of 71. Copyright 2014, 2010, 2007 Pearson Education, Inc.
 Chapter 1 Linear Equations and Straight Lines 2 of 71 Outline 1.1 Coordinate Systems and Graphs 1.4 The Slope of a Straight Line 1.3 The Intersection Point of a Pair of Lines 1.2 Linear Inequalities 1.5
Bell Ringer Write each phrase as a mathematical expression. Thinking with Mathematical Models
 Bell Ringer Write each phrase as a mathematical expression. 1. the sum of nine and eight 2. the sum of nine and a number 3. nine increased by a number x 4. fourteen decreased by a number p 5. the product
Lesson 19: The Graph of a Linear Equation in Two Variables is a Line
 Lesson 19: The Graph of a Linear Equation in Two Variables is a Line Classwork Exercises Theorem: The graph of a linear equation y = mx + b is a non-vertical line with slope m and passing through (0, b),
Geometry Unit 2: Linear. Section Page and Problems Date Assigned
 Geometry Name: Geometry Unit 2: Linear Topics Covered: Midpoint formula Distance formula Slope Slope- Intercept Form Point- Slope Form Standard Form Assignment # Section Page and Problems Date Assigned
Geometry Unit 5 Geometric and Algebraic Connections. Table of Contents
 Geometry Unit 5 Geometric and Algebraic Connections Table of Contents Lesson 5 1 Lesson 5 2 Distance.p. 2-3 Midpoint p. 3-4 Partitioning a Directed Line. p. 5-6 Slope. p.7-8 Lesson 5 3 Revisit: Graphing
A is any set of ordered pairs of real numbers. This is a set of ordered pairs of real numbers, so it is a.
 Fry Texas A&M University!! Math 150!! Chapter 3!! Fall 2014! 1 Chapter 3A Rectangular Coordinate System A is any set of ordered pairs of real numbers. A relation can be finite: {(-3, 1), (-3, -1), (0,
The Rectangular Coordinate System and Equations of Lines. College Algebra
 The Rectangular Coordinate System and Equations of Lines College Algebra Cartesian Coordinate System A grid system based on a two-dimensional plane with perpendicular axes: horizontal axis is the x-axis
CHAPTER 2 REVIEW COORDINATE GEOMETRY MATH Warm-Up: See Solved Homework questions. 2.2 Cartesian coordinate system
 CHAPTER 2 REVIEW COORDINATE GEOMETRY MATH6 2.1 Warm-Up: See Solved Homework questions 2.2 Cartesian coordinate system Coordinate axes: Two perpendicular lines that intersect at the origin O on each line.
The x coordinate tells you how far left or right from center the point is. The y coordinate tells you how far up or down from center the point is.
 We will review the Cartesian plane and some familiar formulas. College algebra Graphs 1: The Rectangular Coordinate System, Graphs of Equations, Distance and Midpoint Formulas, Equations of Circles Section
Exam 2 Review. 2. What the difference is between an equation and an expression?
 Exam 2 Review Chapter 1 Section1 Do You Know: 1. What does it mean to solve an equation? 2. What the difference is between an equation and an expression? 3. How to tell if an equation is linear? 4. How
1.6 Modeling with Equations
 1.6 Modeling with Equations Steps to Modeling Problems with Equations 1. Identify the variable you want to solve for. 2. Express all unknown quantities in terms of this variable. 3. Set up the model by
Sec 4.1 Coordinates and Scatter Plots. Coordinate Plane: Formed by two real number lines that intersect at a right angle.
 Algebra I Chapter 4 Notes Name Sec 4.1 Coordinates and Scatter Plots Coordinate Plane: Formed by two real number lines that intersect at a right angle. X-axis: The horizontal axis Y-axis: The vertical
Math Analysis Chapter 1 Notes: Functions and Graphs
 Math Analysis Chapter 1 Notes: Functions and Graphs Day 6: Section 1-1 Graphs Points and Ordered Pairs The Rectangular Coordinate System (aka: The Cartesian coordinate system) Practice: Label each on the
EQUATIONS OF ALTITUDES, MEDIANS, and PERPENDICULAR BISECTORS
 EQUATIONS OF ALTITUDES, MEDIANS, and PERPENDICULAR BISECTORS Steps to Find the Median of a Triangle: -Find the midpoint of a segment using the midpoint formula. -Use the vertex and midpoint to find the
Algebra 1 Semester 2 Final Review
 Team Awesome 011 Name: Date: Period: Algebra 1 Semester Final Review 1. Given y mx b what does m represent? What does b represent?. What axis is generally used for x?. What axis is generally used for y?
Section 1.5. Finding Linear Equations
 Section 1.5 Finding Linear Equations Using Slope and a Point to Find an Equation of a Line Example Find an equation of a line that has slope m = 3 and contains the point (2, 5). Solution Substitute m =
Linear Topics Notes and Homework DUE ON EXAM DAY. Name: Class period:
 Linear Topics Notes and Homework DUE ON EXAM DAY Name: Class period: Absolute Value Axis b Coordinate points Continuous graph Constant Correlation Dependent Variable Direct Variation Discrete graph Domain
Module 3: Graphing Quadratic Functions
 Haberman MTH 95 Section V Quadratic Equations and Functions Module 3 Graphing Quadratic Functions In this module, we'll review the graphing quadratic functions (you should have studied the graphs of quadratic
Section 3.1 Objective 1: Plot Points in the Rectangular Coordinate System Video Length 12:35
 Section 3.1 Video Guide The Rectangular Coordinate System and Equations in Two Variables Objectives: 1. Plot Points in the Rectangular Coordinate System 2. Determine If an Ordered Pair Satisfies an Equation
Math Analysis Chapter 1 Notes: Functions and Graphs
 Math Analysis Chapter 1 Notes: Functions and Graphs Day 6: Section 1-1 Graphs; Section 1- Basics of Functions and Their Graphs Points and Ordered Pairs The Rectangular Coordinate System (aka: The Cartesian
Math 8 Honors Coordinate Geometry part 3 Unit Updated July 29, 2016
 Review how to find the distance between two points To find the distance between two points, use the Pythagorean theorem. The difference between is one leg and the difference between and is the other leg.
CHAPTER. Graphs of Linear Equations. 3.1 Introduction to Graphing 3.2 Graphing Linear Equations 3.3 More with Graphing 3.4 Slope and Applications
 Graphs of Linear Equations CHAPTER 3 3.1 Introduction to Graphing 3.2 Graphing Linear Equations 3.3 More with Graphing 3.4 Slope and Applications Slide 2 3.1 Introduction to Graphing OBJECTIVES a Plot
SNAP Centre Workshop. Graphing Lines
 SNAP Centre Workshop Graphing Lines 45 Graphing a Line Using Test Values A simple way to linear equation involves finding test values, plotting the points on a coordinate plane, and connecting the points.
Writing and Graphing Linear Equations. Linear equations can be used to represent relationships.
 Writing and Graphing Linear Equations Linear equations can be used to represent relationships. Linear equation An equation whose solutions form a straight line on a coordinate plane. Collinear Points that
Section 1.1 The Distance and Midpoint Formulas; Graphing Utilities; Introduction to Graphing Equations
 Section 1.1 The Distance and Midpoint Formulas; Graphing Utilities; Introduction to Graphing Equations origin (x, y) Ordered pair (x-coordinate, y-coordinate) (abscissa, ordinate) x axis Rectangular or
Tangent line problems
 You will find lots of practice problems and homework problems that simply ask you to differentiate. The following examples are to illustrate some of the types of tangent line problems that you may come
Algebra Unit 2: Linear Functions Notes. Slope Notes. 4 Types of Slope. Slope from a Formula
 Undefined Slope Notes Types of Slope Zero Slope Slope can be described in several ways: Steepness of a line Rate of change rate of increase or decrease Rise Run Change (difference) in y over change (difference)
FLC Ch 3. Ex 1 Plot the points Ex 2 Give the coordinates of each point shown. Sec 3.2: Solutions and Graphs of Linear Equations
 Math 100 Elementary Algebra Sec 3.1: The Rectangular Coordinate System x-axis and y-axis origin ordered pair x-coordinate y-coordinate quadrants (I, II, III, and IV) Rectangular/Cartesian Coordinate System
UNIT 3 EXPRESSIONS AND EQUATIONS Lesson 3: Creating Quadratic Equations in Two or More Variables
 Guided Practice Example 1 Find the y-intercept and vertex of the function f(x) = 2x 2 + x + 3. Determine whether the vertex is a minimum or maximum point on the graph. 1. Determine the y-intercept. The
f( x ), or a solution to the equation f( x) 0. You are already familiar with ways of solving
, or a solution to the equation f( x) 0. You are already familiar with ways of solving") The Bisection Method and Newton s Method. If f( x ) a function, then a number r for which f( r) 0 is called a zero or a root of the function f( x ), or a solution to the equation f( x) 0. You are already
The Bisection Method and Newton s Method. If f( x ) a function, then a number r for which f( r) 0 is called a zero or a root of the function f( x ), or a solution to the equation f( x) 0. You are already
Graphs of Equations. MATH 160, Precalculus. J. Robert Buchanan. Fall Department of Mathematics. J. Robert Buchanan Graphs of Equations
 Graphs of Equations MATH 160, Precalculus J. Robert Buchanan Department of Mathematics Fall 2011 Objectives In this lesson we will learn to: sketch the graphs of equations, find the x- and y-intercepts
Math-2. Lesson 3-1. Equations of Lines
 Math-2 Lesson 3-1 Equations of Lines How can an equation make a line? y = x + 1 x -4-3 -2-1 0 1 2 3 Fill in the rest of the table rule x + 1 f(x) -4 + 1-3 -3 + 1-2 -2 + 1-1 -1 + 1 0 0 + 1 1 1 + 1 2 2 +
Graphing Linear Equations
 Graphing Linear Equations A.REI.10 Understand that the graph of an equation in two variables is the set of all its solutions plotted in the coordinate plane. What am I learning today? How to graph a linear
GEOMETRY HONORS COORDINATE GEOMETRY PACKET
 GEOMETRY HONORS COORDINATE GEOMETRY PACKET Name Period 1 Day 1 - Directed Line Segments DO NOW Distance formula 1 2 1 2 2 2 D x x y y Midpoint formula x x, y y 2 2 M 1 2 1 2 Slope formula y y m x x 2 1
Practice Test (page 391) 1. For each line, count squares on the grid to determine the rise and the run. Use slope = rise
 1. For each line, count squares on the grid to determine the rise and the run. Use slope = rise") Practice Test (page 91) 1. For each line, count squares on the grid to determine the rise and the. Use slope = rise 4 Slope of AB =, or 6 Slope of CD = 6 9, or Slope of EF = 6, or 4 Slope of GH = 6 4,
Practice Test (page 91) 1. For each line, count squares on the grid to determine the rise and the. Use slope = rise 4 Slope of AB =, or 6 Slope of CD = 6 9, or Slope of EF = 6, or 4 Slope of GH = 6 4,
Part I. Problems in this section are mostly short answer and multiple choice. Little partial credit will be given. 5 points each.
 Math 106/108 Final Exam Page 1 Part I. Problems in this section are mostly short answer and multiple choice. Little partial credit will be given. 5 points each. 1. Factor completely. Do not solve. a) 2x
UNIT 4 NOTES. 4-1 and 4-2 Coordinate Plane
 UNIT 4 NOTES 4-1 and 4-2 Coordinate Plane y Ordered pairs on a graph have several names. (X coordinate, Y coordinate) (Domain, Range) (Input,Output) Plot these points and label them: a. (3,-4) b. (-5,2)
Vocabulary Unit 2-3: Linear Functions & Healthy Lifestyles. Scale model a three dimensional model that is similar to a three dimensional object.
 Scale a scale is the ratio of any length in a scale drawing to the corresponding actual length. The lengths may be in different units. Scale drawing a drawing that is similar to an actual object or place.
Section 7.2 Characteristics of Quadratic Functions
 Section 7. Characteristics of Quadratic Functions A QUADRATIC FUNCTION is a function of the form " # $ N# 1 & ;# & 0 Characteristics Include:! Three distinct terms each with its own coefficient:! An x
Intro. To Graphing Linear Equations
 Intro. To Graphing Linear Equations The Coordinate Plane A. The coordinate plane has 4 quadrants. B. Each point in the coordinate plain has an x-coordinate (the abscissa) and a y-coordinate (the ordinate).
2.1. Rectangular Coordinates and Graphs. 2.1 Rectangular Coordinates and Graphs 2.2 Circles 2.3 Functions 2.4 Linear Functions. Graphs and Functions
 2 Graphs and Functions 2 Graphs and Functions 2.1 Rectangular Coordinates and Graphs 2.2 Circles 2.3 Functions 2.4 Linear Functions Sections 2.1 2.4 2008 Pearson Addison-Wesley. All rights reserved Copyright
UC Davis MAT 012, Summer Session II, Midterm Examination
 UC Davis MAT 012, Summer Session II, 2018 Midterm Examination Name: Student ID: DATE: August 24, 2018 TIME ALLOWED: 100 minutes INSTRUCTIONS 1. This examination paper contains SEVEN (7) questions and comprises
Coordinate Geometry. Coordinate geometry is the study of the relationships between points on the Cartesian plane
 Coordinate Geometry Coordinate geometry is the study of the relationships between points on the Cartesian plane What we will explore in this tutorial (a) Explore gradient I. Identify the gradient of a
Work Toward Verification of a Geometric Construction The Regular Pentagon
 Work Toward Verification of a Geometric Construction The Regular Pentagon Ed Ladenburger August 9, 007 Given: Steps for the geometric construction of a regular pentagon:. Construct a circle this circle,
About Graphing Lines
 About Graphing Lines TABLE OF CONTENTS About Graphing Lines... 1 What is a LINE SEGMENT?... 1 Ordered Pairs... 1 Cartesian Co-ordinate System... 1 Ordered Pairs... 2 Line Segments... 2 Slope of a Line
Accelerated Precalculus 1.2 (Intercepts and Symmetry) Day 1 Notes. In 1.1, we discussed using t-charts to help graph functions. e.g.
 Day 1 Notes. In 1.1, we discussed using t-charts to help graph functions. e.g.") Accelerated Precalculus 1.2 (Intercepts and Symmetry) Day 1 Notes In 1.1, we discussed using t-charts to help graph functions. e.g., Graph: y = x 3 What are some other strategies that can make graphing
Accelerated Precalculus 1.2 (Intercepts and Symmetry) Day 1 Notes In 1.1, we discussed using t-charts to help graph functions. e.g., Graph: y = x 3 What are some other strategies that can make graphing
3, 10,( 2, 4) Name. CP Algebra II Midterm Review Packet Unit 1: Linear Equations and Inequalities. Solve each equation. 3.
 Name. CP Algebra II Midterm Review Packet Unit 1: Linear Equations and Inequalities. Solve each equation. 3.") Name CP Algebra II Midterm Review Packet 018-019 Unit 1: Linear Equations and Inequalities Solve each equation. 1. x. x 4( x 5) 6x. 8x 5(x 1) 5 4. ( k ) k 4 5. x 4 x 6 6. V lhw for h 7. x y b for x z Find
Name CP Algebra II Midterm Review Packet 018-019 Unit 1: Linear Equations and Inequalities Solve each equation. 1. x. x 4( x 5) 6x. 8x 5(x 1) 5 4. ( k ) k 4 5. x 4 x 6 6. V lhw for h 7. x y b for x z Find
High School Geometry. Correlation of the ALEKS course High School Geometry to the ACT College Readiness Standards for Mathematics
 High School Geometry Correlation of the ALEKS course High School Geometry to the ACT College Readiness Standards for Mathematics Standard 5 : Graphical Representations = ALEKS course topic that addresses
Chapter P: Preparation for Calculus
 1. Which of the following is the correct graph of y = x x 3? E) Copyright Houghton Mifflin Company. All rights reserved. 1 . Which of the following is the correct graph of y = 3x x? E) Copyright Houghton
LINEAR TOPICS Notes and Homework: DUE ON EXAM
 NAME CLASS PERIOD LINEAR TOPICS Notes and Homework: DUE ON EXAM VOCABULARY: Make sure ou know the definitions of the terms listed below. These will be covered on the exam. Axis Scatter plot b Slope Coordinate
NAME: DATE: PERIOD: 1. Find the coordinates of the midpoint of each side of the parallelogram.
 NAME: DATE: PERIOD: Geometry Fall Final Exam Review 2017 1. Find the coordinates of the midpoint of each side of the parallelogram. My Exam is on: This review is due on: 2. Find the distance between the
Unit 12 Topics in Analytic Geometry - Classwork
 Unit 1 Topics in Analytic Geometry - Classwork Back in Unit 7, we delved into the algebra and geometry of lines. We showed that lines can be written in several forms: a) the general form: Ax + By + C =
Exploring Slope. We use the letter m to represent slope. It is the ratio of the rise to the run.
 Math 7 Exploring Slope Slope measures the steepness of a line. If you take any two points on a line, the change in y (vertical change) is called the rise and the change in x (horizontal change) is called
Math 3 Coordinate Geometry part 1 Unit November 3, 2016
 Reviewing the basics The number line A number line is a visual representation of all real numbers. Each of the images below are examples of number lines. The top left one includes only positive whole numbers,
HFCC Math Lab Intermediate Algebra 1 SLOPE INTERCEPT AND POINT-SLOPE FORMS OF THE LINE
 HFCC Math Lab Intermediate Algebra SLOPE INTERCEPT AND POINT-SLOPE FORMS OF THE LINE THE EQUATION OF A LINE Goal I. Use the slope-intercept form of the line to write the equation of a non-vertical line
You should be able to plot points on the coordinate axis. You should know that the the midpoint of the line segment joining (x, y 1 1
 Name GRAPHICAL REPRESENTATION OF DATA: You should be able to plot points on the coordinate axis. You should know that the the midpoint of the line segment joining (x, y 1 1 ) and (x, y ) is x1 x y1 y,.
3.1. 3x 4y = 12 3(0) 4y = 12. 3x 4y = 12 3x 4(0) = y = x 0 = 12. 4y = 12 y = 3. 3x = 12 x = 4. The Rectangular Coordinate System
 4y = 12. 3x 4y = 12 3x 4(0) = y = x 0 = 12. 4y = 12 y = 3. 3x = 12 x = 4. The Rectangular Coordinate System") 3. The Rectangular Coordinate System Interpret a line graph. Objectives Interpret a line graph. Plot ordered pairs. 3 Find ordered pairs that satisfy a given equation. 4 Graph lines. 5 Find x- and y-intercepts.
3. The Rectangular Coordinate System Interpret a line graph. Objectives Interpret a line graph. Plot ordered pairs. 3 Find ordered pairs that satisfy a given equation. 4 Graph lines. 5 Find x- and y-intercepts.
Geometry Pre AP Graphing Linear Equations
 Geometry Pre AP Graphing Linear Equations Name Date Period Find the x- and y-intercepts and slope of each equation. 1. y = -x 2. x + 3y = 6 3. x = 2 4. y = 0 5. y = 2x - 9 6. 18x 42 y = 210 Graph each
Forms of Linear Equations
 6. 1-6.3 Forms of Linear Equations Name Sec 6.1 Writing Linear Equations in Slope-Intercept Form *Recall that slope intercept form looks like y = mx + b, where m = slope and b = y=intercept 1) Writing
Multivariable Calculus
 Multivariable Calculus Chapter 10 Topics in Analytic Geometry (Optional) 1. Inclination of a line p. 5. Circles p. 4 9. Determining Conic Type p. 13. Angle between lines p. 6. Parabolas p. 5 10. Rotation
Chapter 1 Section 1 Solving Linear Equations in One Variable
 Chapter Section Solving Linear Equations in One Variable A linear equation in one variable is an equation which can be written in the form: ax + b = c for a, b, and c real numbers with a 0. Linear equations
Lesson 3 Practice Problems
 Name: Date: Lesson 3 Section 3.1: Linear Equations and Functions 1. Find the slope of the line that passes through the given points. Then determine if the line is increasing, decreasing or constant. Increasing,
Did You Find a Parking Space?
 Lesson.4 Skills Practice Name Date Did You Find a Parking Space? Parallel and Perpendicular Lines on the Coordinate Plane Vocabulary Complete the sentence. 1. The point-slope form of the equation of the
Warm-Up Exercises. Find the x-intercept and y-intercept 1. 3x 5y = 15 ANSWER 5; y = 2x + 7 ANSWER ; 7
 Warm-Up Exercises Find the x-intercept and y-intercept 1. 3x 5y = 15 ANSWER 5; 3 2. y = 2x + 7 7 2 ANSWER ; 7 Chapter 1.1 Graph Quadratic Functions in Standard Form A quadratic function is a function that
UNIT 6 CONNECTING ALGEBRA AND GEOMETRY THROUGH COORDINATES Station Activities Set 1: Parallel Lines, Slopes, and Equations
 Station Activities Set 1: Parallel Lines, Slopes, and Equations Station 1 At this station, you will find rulers. Use these to help you determine whether or not the following lines are parallel. Look at
Math 2 Coordinate Geometry Part 3 Inequalities & Quadratics
 Math 2 Coordinate Geometry Part 3 Inequalities & Quadratics 1 DISTANCE BETWEEN TWO POINTS - REVIEW To find the distance between two points, use the Pythagorean theorem. The difference between x 1 and x
WRITING AND GRAPHING LINEAR EQUATIONS ON A FLAT SURFACE #1313
 WRITING AND GRAPHING LINEAR EQUATIONS ON A FLAT SURFACE #11 SLOPE is a number that indicates the steepness (or flatness) of a line, as well as its direction (up or down) left to right. SLOPE is determined
Direction Fields; Euler s Method
 Direction Fields; Euler s Method It frequently happens that we cannot solve first order systems dy (, ) dx = f xy or corresponding initial value problems in terms of formulas. Remarkably, however, this
Geometry: Angle Relationships
 Geometry: Angle Relationships I. Define the following angles (in degrees) and draw an example of each. 1. Acute 3. Right 2. Obtuse 4. Straight Complementary angles: Supplementary angles: a + b = c + d
Advanced Algebra. Equation of a Circle
 Advanced Algebra Equation of a Circle Task on Entry Plotting Equations Using the table and axis below, plot the graph for - x 2 + y 2 = 25 x -5-4 -3 0 3 4 5 y 1 4 y 2-4 3 2 + y 2 = 25 9 + y 2 = 25 y 2
10-2 Circles. Warm Up Lesson Presentation Lesson Quiz. Holt Algebra2 2
 10-2 Circles Warm Up Lesson Presentation Lesson Quiz Holt Algebra2 2 Warm Up Find the slope of the line that connects each pair of points. 1. (5, 7) and ( 1, 6) 1 6 2. (3, 4) and ( 4, 3) 1 Warm Up Find
.(3, 2) Co-ordinate Geometry Co-ordinates. Every point has two co-ordinates. Plot the following points on the plane. A (4, 1) D (2, 5) G (6, 3)
 Co-ordinate Geometry Co-ordinates. Every point has two co-ordinates. Plot the following points on the plane. A (4, 1) D (2, 5) G (6, 3)") Co-ordinate Geometry Co-ordinates Every point has two co-ordinates. (3, 2) x co-ordinate y co-ordinate Plot the following points on the plane..(3, 2) A (4, 1) D (2, 5) G (6, 3) B (3, 3) E ( 4, 4) H (6,
Co-ordinate Geometry Co-ordinates Every point has two co-ordinates. (3, 2) x co-ordinate y co-ordinate Plot the following points on the plane..(3, 2) A (4, 1) D (2, 5) G (6, 3) B (3, 3) E ( 4, 4) H (6,
Section 3.3. Analyzing Graphs of Quadratic Functions
 Section 3.3 Analyzing Graphs of Quadratic Functions Introduction Definitions A quadratic function is a function with the form f (x) = ax 2 + bx + c, where a 0. Definitions A quadratic function is a function
Notre Dame High School. Mathematics is the gateway to all college and career opportunities. As stated by the National Research Council:
 Notre Dame High School 220 Jefferson Street Fairfield, CT 06825 June 2017 Dear Parent(s)/Guardian(s) and Incoming Honors and High Honors Analysis Students, Mathematics is the gateway to all college and
Geometry CP Constructions Part I Page 1 of 4. Steps for copying a segment (TB 16): Copying a segment consists of making segments.
: Copying a segment consists of making segments.") Geometry CP Constructions Part I Page 1 of 4 Steps for copying a segment (TB 16): Copying a segment consists of making segments. Geometry CP Constructions Part I Page 2 of 4 Steps for bisecting a segment
Geometry CP Constructions Part I Page 1 of 4 Steps for copying a segment (TB 16): Copying a segment consists of making segments. Geometry CP Constructions Part I Page 2 of 4 Steps for bisecting a segment
Conic Sections. College Algebra
 Conic Sections College Algebra Conic Sections A conic section, or conic, is a shape resulting from intersecting a right circular cone with a plane. The angle at which the plane intersects the cone determines
Algebra II. Slide 1 / 181. Slide 2 / 181. Slide 3 / 181. Conic Sections Table of Contents
 Slide 1 / 181 Algebra II Slide 2 / 181 Conic Sections 2015-04-21 www.njctl.org Table of Contents click on the topic to go to that section Slide 3 / 181 Review of Midpoint and Distance Formulas Introduction
L13-Mon-3-Oct-2016-Sec-1-1-Dist-Midpt-HW Graph-HW12-Moodle-Q11, page 1 L13-Mon-3-Oct-2016-Sec-1-1-Dist-Midpt-HW Graph-HW12-Moodle-Q11
 L13-Mon-3-Oct-016-Sec-1-1-Dist-Midpt-HW11-1--Graph-HW1-Moodle-Q11, page 1 L13-Mon-3-Oct-016-Sec-1-1-Dist-Midpt-HW11-1--Graph-HW1-Moodle-Q11 1.1 Rectangular Coordinate System: Suppose we know the sum of
You MUST know the big 3 formulas!
 Name 3-13 Review Geometry Period Date Unit 3 Lines and angles Review 3-1 Writing equations of lines. Determining slope and y intercept given an equation y = mx + b Writing the equation of a line given
11.9 Three dimensional Coordinates
 11.9 Three dimensional Coordinates Apr 1 10:06 AM 1 A Three Dimensional Coordinate System Dec 9 5:26 PM 2 With an ordered triple (x, y, z) Dec 9 5:26 PM 3 x axis y axis z axis Dec 9 5:26 PM 4 Dec 9 5:26
Important!!! First homework is due on Monday, September 26 at 8:00 am.
 Important!!! First homework is due on Monday, September 26 at 8:00 am. You can solve and submit the homework on line using webwork: http://webwork.dartmouth.edu/webwork2/m3cod/. If you do not have a user
Unit 6: Connecting Algebra and Geometry Through Coordinates
 Unit 6: Connecting Algebra and Geometry Through Coordinates The focus of this unit is to have students analyze and prove geometric properties by applying algebraic concepts and skills on a coordinate plane.
Section 18-1: Graphical Representation of Linear Equations and Functions
 Section 18-1: Graphical Representation of Linear Equations and Functions Prepare a table of solutions and locate the solutions on a coordinate system: f(x) = 2x 5 Learning Outcome 2 Write x + 3 = 5 as
WK # Given: f(x) = ax2 + bx + c
 = ax2 + bx + c") Alg2H Chapter 5 Review 1. Given: f(x) = ax2 + bx + c Date or y = ax2 + bx + c Related Formulas: y-intercept: ( 0, ) Equation of Axis of Symmetry: x = Vertex: (x,y) = (, ) Discriminant = x-intercepts: When
Alg2H Chapter 5 Review 1. Given: f(x) = ax2 + bx + c Date or y = ax2 + bx + c Related Formulas: y-intercept: ( 0, ) Equation of Axis of Symmetry: x = Vertex: (x,y) = (, ) Discriminant = x-intercepts: When
Math 165 Guided Activity to study ahead some concepts from sections 1.1 and 1.2 Name Section Distance and Midpoint Formula
 Math 165 Guided Activity to study ahead some concepts from sections 1.1 and 1. Name Section 1.1 - Distance and Midpoint Formula Use the power point presentation for sections 1.1 and 1. to answer the following
UNIT I READING: GRAPHICAL METHODS
 UNIT I READING: GRAPHICAL METHODS One of the most effective tools for the visual evaluation of data is a graph. The investigator is usually interested in a quantitative graph that shows the relationship
To graph the point (r, θ), simply go out r units along the initial ray, then rotate through the angle θ. The point (1, 5π 6
, simply go out r units along the initial ray, then rotate through the angle θ. The point (1, 5π 6") Polar Coordinates Any point in the plane can be described by the Cartesian coordinates (x, y), where x and y are measured along the corresponding axes. However, this is not the only way to represent points
Polar Coordinates Any point in the plane can be described by the Cartesian coordinates (x, y), where x and y are measured along the corresponding axes. However, this is not the only way to represent points
Math 154 Elementary Algebra. Equations of Lines 4.4
 Math Elementary Algebra Caspers Name Date Equations of Lines. For each graph, solve each equation for y (if necessary), then write down the slope and y-intercept.. y x. y x - - - - - - - - - - - - - -
Lecture 4. If P1(x1,y1) and P2(x2,y2) are points on a non-vertical line, then the slope m of the line is defined by
 and P2(x2,y2) are points on a non-vertical line, then the slope m of the line is defined by") Lines Lecture 4 In this section we shall discuss ways to measure the "steepness" or "slope" of a line in the plane. The ideas we develop here will be important when we discuss equations and graphs of straight
Lines Lecture 4 In this section we shall discuss ways to measure the "steepness" or "slope" of a line in the plane. The ideas we develop here will be important when we discuss equations and graphs of straight
Writing Equations of Parallel and Perpendicular Lines
 Writing Equations of Parallel and Perpendicular Lines The coordinate plane provides a connection between algebra and geometry. Postulates 17 and 18 establish a simple way to find lines that are parallel
Module 3: Stand Up Conics
 MATH55 Module 3: Stand Up Conics Main Math concepts: Conic Sections (i.e. Parabolas, Ellipses, Hyperbolas), nd degree equations Auxilliary ideas: Analytic vs. Co-ordinate-free Geometry, Parameters, Calculus.
Algebra II Notes Unit Two: Linear Equations and Functions
 Syllabus Objectives:.1 The student will differentiate between a relation and a function.. The student will identify the domain and range of a relation or function.. The student will derive a function rule